The Ultimate Guide to Agency Reporting: Best Practices and Tips
You are spending hours and hours on client reporting every week. Compiling data from scattered sources and putting it together to show that you’ve made progress on several fronts. The numbers make sense to you, but will they make sense to your client?
You try to be concise — not to bore the client with too much information, but you also need to be transparent by giving more details.
And then you learn that clients actually rarely read your reports. They just want you to help them grow. And that is understandable. After all, they are paying you for it.
However, in that case, you risk your agency-client relationship becoming purely transactional.
And that is not good.
Why?
Because clients are less engaged with your work. They don’t see you as a partner and advisor but as a service provider, making it easier for them to churn at the first bump in the road.
In this agency reporting guide, we’ll explore best practices and share essential agency reporting tips to help you streamline your reporting process, retain your clients, and ultimately drive better results for their campaigns.

Sep 04 2024●10 min read


What is marketing agency reporting?
Marketing agency reporting is the process by which marketing agencies collect, analyze, and present data to their clients to show the effectiveness of their marketing efforts. These reports usually include insights from various aspects of marketing campaigns, such as website traffic, lead generation, conversion rates, social media engagement, SEO performance, and ROI.
The goal of marketing agency reporting is to provide clients with a clear understanding of how the agency's strategies impact their business, identify improvement areas, and make data-driven decisions for future campaigns.
Effective reporting helps build trust and transparency between the agency and the client, ensuring that the agency's efforts are aligned with the client's business objectives.
Why effective reporting is essential for agencies
Reporting directly impacts client relationships, decision-making, and the overall success of marketing campaigns. Let’s explore several areas where you can set your agency apart from the competitors and prove a valuable partner to your clients using effective reporting.
Demonstrate value and build trust: By providing clear, data-driven evidence of how your strategies impact your client’s business, your agency can build trust and boost the client’s confidence in your services. As a result, clients can better understand the ROI of their marketing investment and be less likely to end the partnership.
Improve communication and alignment: Reporting ensures that both parties are on the same page about the goals, progress, and outcomes. Regular, consistent marketing agency reports help align your work with the client’s objectives, which is essential for setting realistic expectations and the client’s perception of you as a partner instead of just a service provider.
Strengthen client retention and loyalty: If an agency provides consistent, insightful reporting, it has more chances to retain clients. When clients can clearly see how the agency's efforts contribute to their success, they are more likely to stay loyal and continue the partnership. Also, detailed custom reports with actionable insights and recommendations demonstrate your agency’s commitment to proactive problem-solving and continuous improvement. Read more about exceeding client expectations in our separate guide.
Increase transparency and accountability: Reporting holds agencies accountable for their performance. By regularly presenting campaign outcomes, you can ensure that you are delivering on promises and meeting KPIs that you agreed upon. This accountability is essential for maintaining credibility and can even be a deciding factor when renewing the contract.
Provide a competitive advantage: Agencies that excel in reporting can set themselves apart from competitors. Quality marketing agency reports that not only present data but also provide strategic insights can position your agency as a trusted advisor. Clients are more likely to choose and stay with you if you not only help them understand their marketing performance but also use that knowledge to move them forward.
What metrics to include?
In short, include only the metrics clients need to see — those that show direct results of your efforts and their impact on the client’s business: traffic, engagement, and conversion.
Traffic metrics
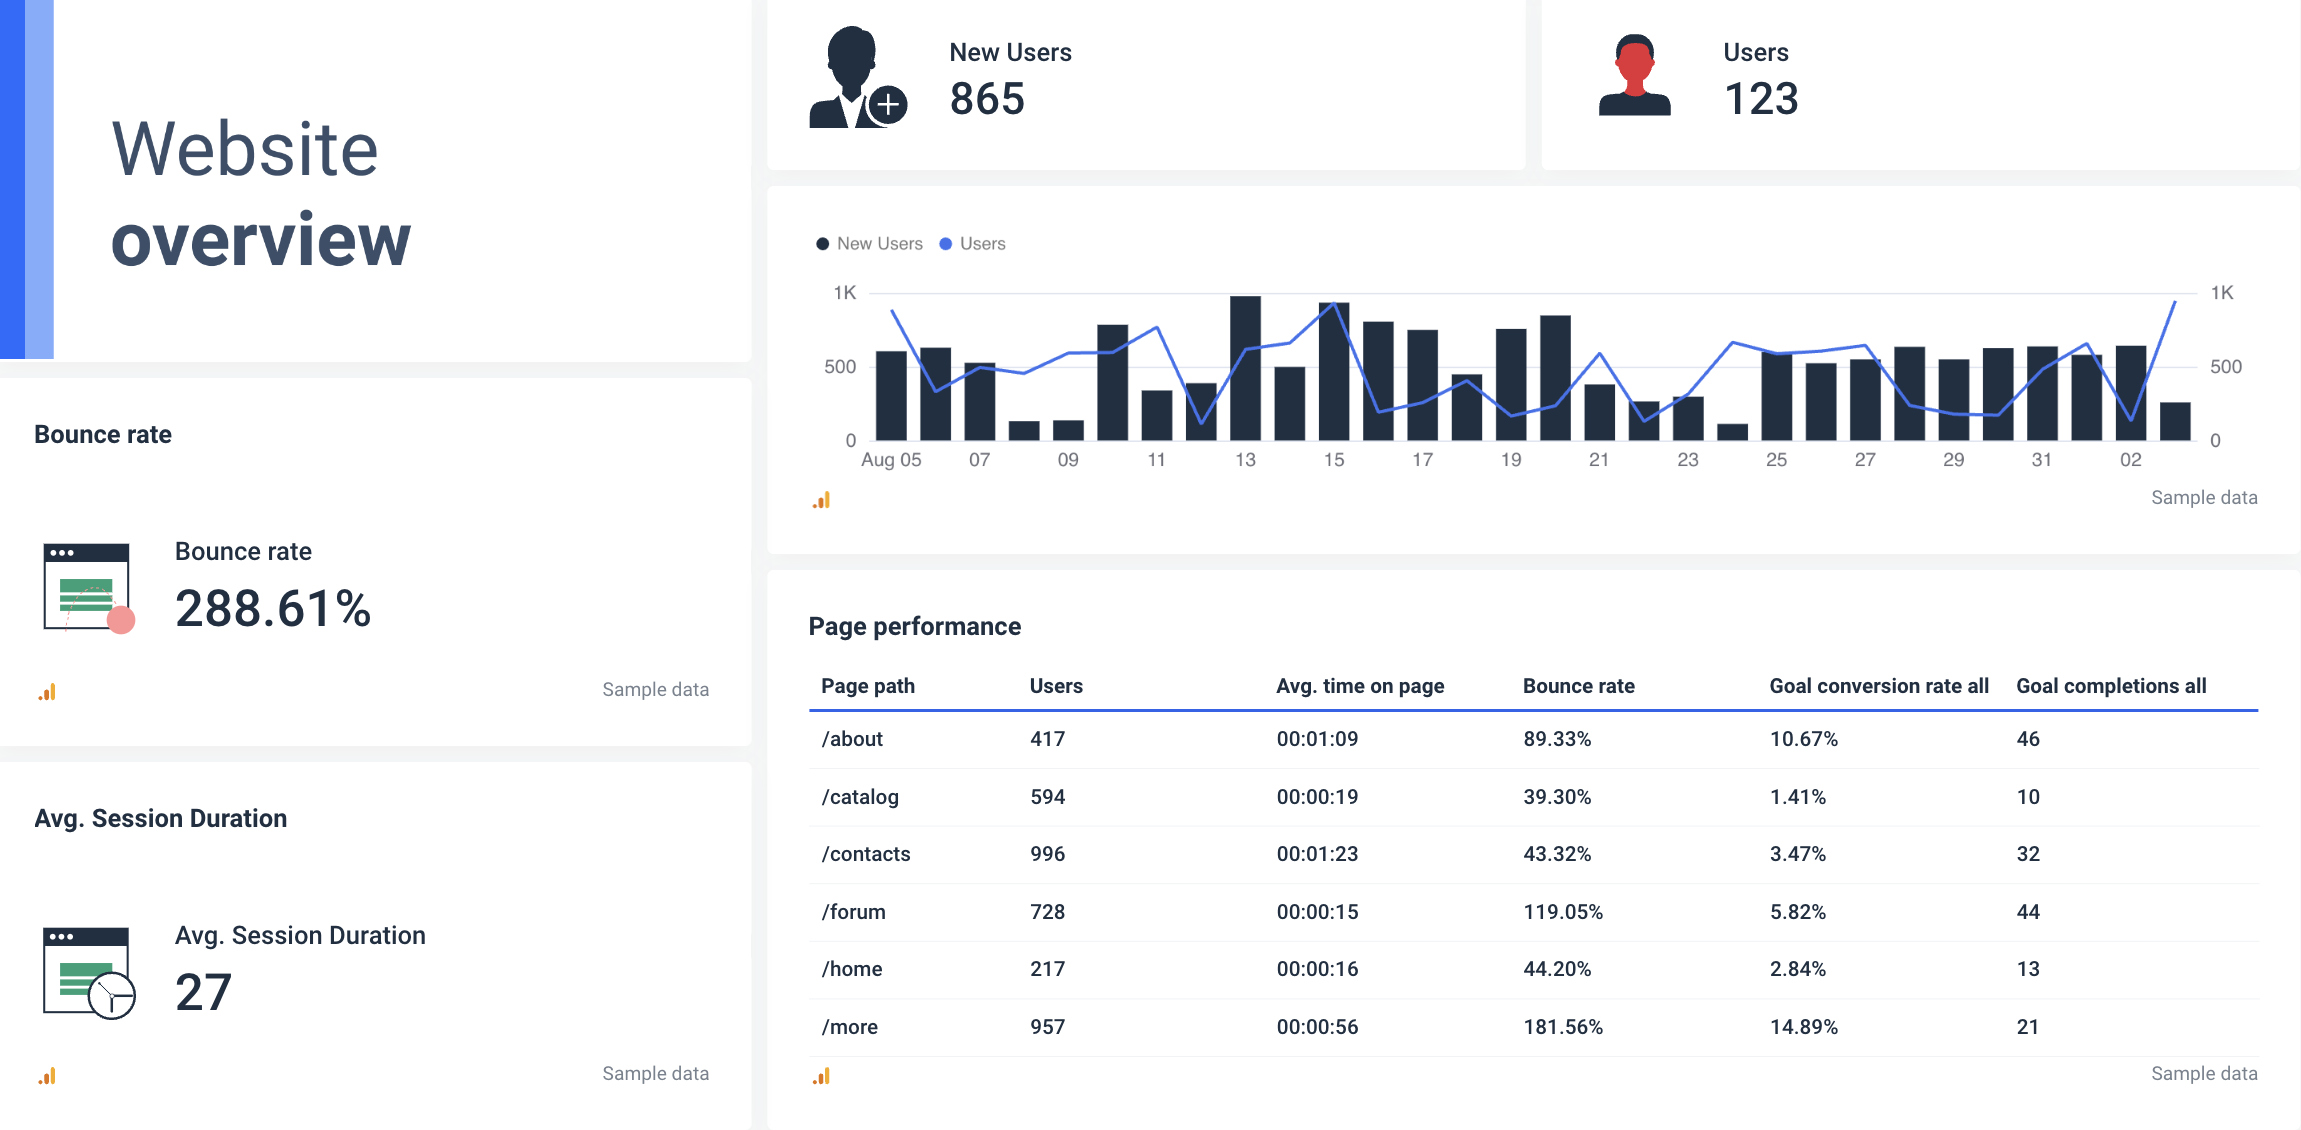
Include essential traffic metrics to provide a comprehensive view of website performance. These metrics can influence better-informed decisions to optimize marketing strategies and improve user experience.
1. Total website traffic
This metric shows the total number of visitors to a client’s website over a specified period. It’s a basic indicator of a website’s reach and popularity. Tracking total traffic helps you assess the effectiveness of marketing campaigns and identify trends in audience behavior.
2. Traffic sources
- Direct traffic: Visitors who enter the website URL directly into their browser. This is often a sign of brand awareness and loyal customers.
- Organic traffic: Visitors who find the website through search engines like Google. High organic traffic usually means strong SEO performance.
- Referral traffic: Traffic coming from other websites through backlinks. This metric helps agencies evaluate the effectiveness of their link-building strategies.
- Social traffic: Visitors who come from social media platforms. This metric indicates the success of social media marketing efforts.
- Paid traffic: Traffic generated through paid advertising campaigns, such as Google Ads or social media ads. This metric helps measure the ROI of paid campaigns.
3. Bounce rate
The bounce rate is the percentage of visitors who leave the site after viewing only one page. A high bounce rate may indicate that the landing page content isn’t engaging or interesting to visitors. Monitoring this metric helps improve user experience and content relevance.
4. Session duration
This metric measures the average amount of time a visitor spends on your client’s website during a single session (visit). Longer session durations often suggest that users find the content valuable and are engaged with the website. It’s a key indicator of content effectiveness and user engagement.
5. Pages per session
Pages per session refers to the average number of pages a visitor views during a single session. A higher number suggests that users are exploring more content on the site, which is often a sign of good site structure and compelling content.
6. New vs. returning visitors
This metric makes a difference between first-time visitors and those who return to the website. A balanced ratio between new and returning visitors indicates both successful outreach (new visitors) and customer retention (returning visitors).
7. Top landing pages
This metric identifies the most visited entry pages on the website. Analyzing top landing pages can provide insights into which content attracts and engages visitors the most, which, in return, informs your content strategy and optimization efforts.
8. Exit pages
Exit pages are the last pages visitors view before leaving the website. Analyzing exit pages can help identify potential issues with content or user flow that might be causing visitors to leave without converting. For example, a visitor who leaves the site without visiting a pricing page or from a TOFU content page is a sign that either a) their expectations were not met or b) they didn’t find the content compelling enough to explore more.
9. Geographical location
This metric provides insights into where the website traffic is coming from geographically. It helps in tailoring marketing strategies to target regions where the brand is most popular or where there’s potential for growth.
10. Device and browser data
This metric shows the devices (mobile, desktop, tablet) and browsers (Chrome, Safari, etc.) that visitors use. Understanding this helps optimize the website for the most common devices and browsers, improving user experience across platforms.
Engagement metrics
These essential engagement metrics help you understand how visitors interact with your client’s website, again allowing for better optimization of content, user experience, and overall engagement strategies.
1. Click-through rate (CTR)
CTR measures the percentage of users who click on a specific link, such as a call-to-action (CTA), ad, or email link. It’s an important metric for evaluating the effectiveness of marketing messages, content, and ad campaigns. A high CTR is a sign that the content or offer is resonating with the audience.
2. Social shares and comments:
This metric tracks how often content is shared on social media platforms and the number of comments it receives. High levels of social sharing and engagement suggest that the content is compelling, relevant, and valuable to the audience. It’s a key indicator of content virality and brand reach.
3. Scroll depth
Scroll depth measures how far down a page users scroll. It’s especially useful for understanding user engagement with long-form content. If users regularly scroll to the bottom, it is a sign that they are engaged with the content. On the other hand, if they stop scrolling early, it may signal that the content needs to be more compelling or better structured.
4. Video engagement metrics
If your client’s website has video content, metrics such as play rate (how many people click to play a video), watch time (how long they watch), and completion rate (how many people watch to the end) are important. These metrics help assess how well video content is capturing and maintaining audience attention.
5. Heatmaps
Heatmaps visually represent where users are clicking, scrolling, and hovering on a webpage. They provide insights into which areas of a page are attracting the most attention and which are being ignored. This information is valuable for optimizing page layout and CTAs to improve user engagement.
6. Customer feedback and reviews
Although not measurable metrics, customer reviews are important for understanding overall engagement. They provide direct insight into user satisfaction and areas where the website or service can be improved.
Conversion metrics
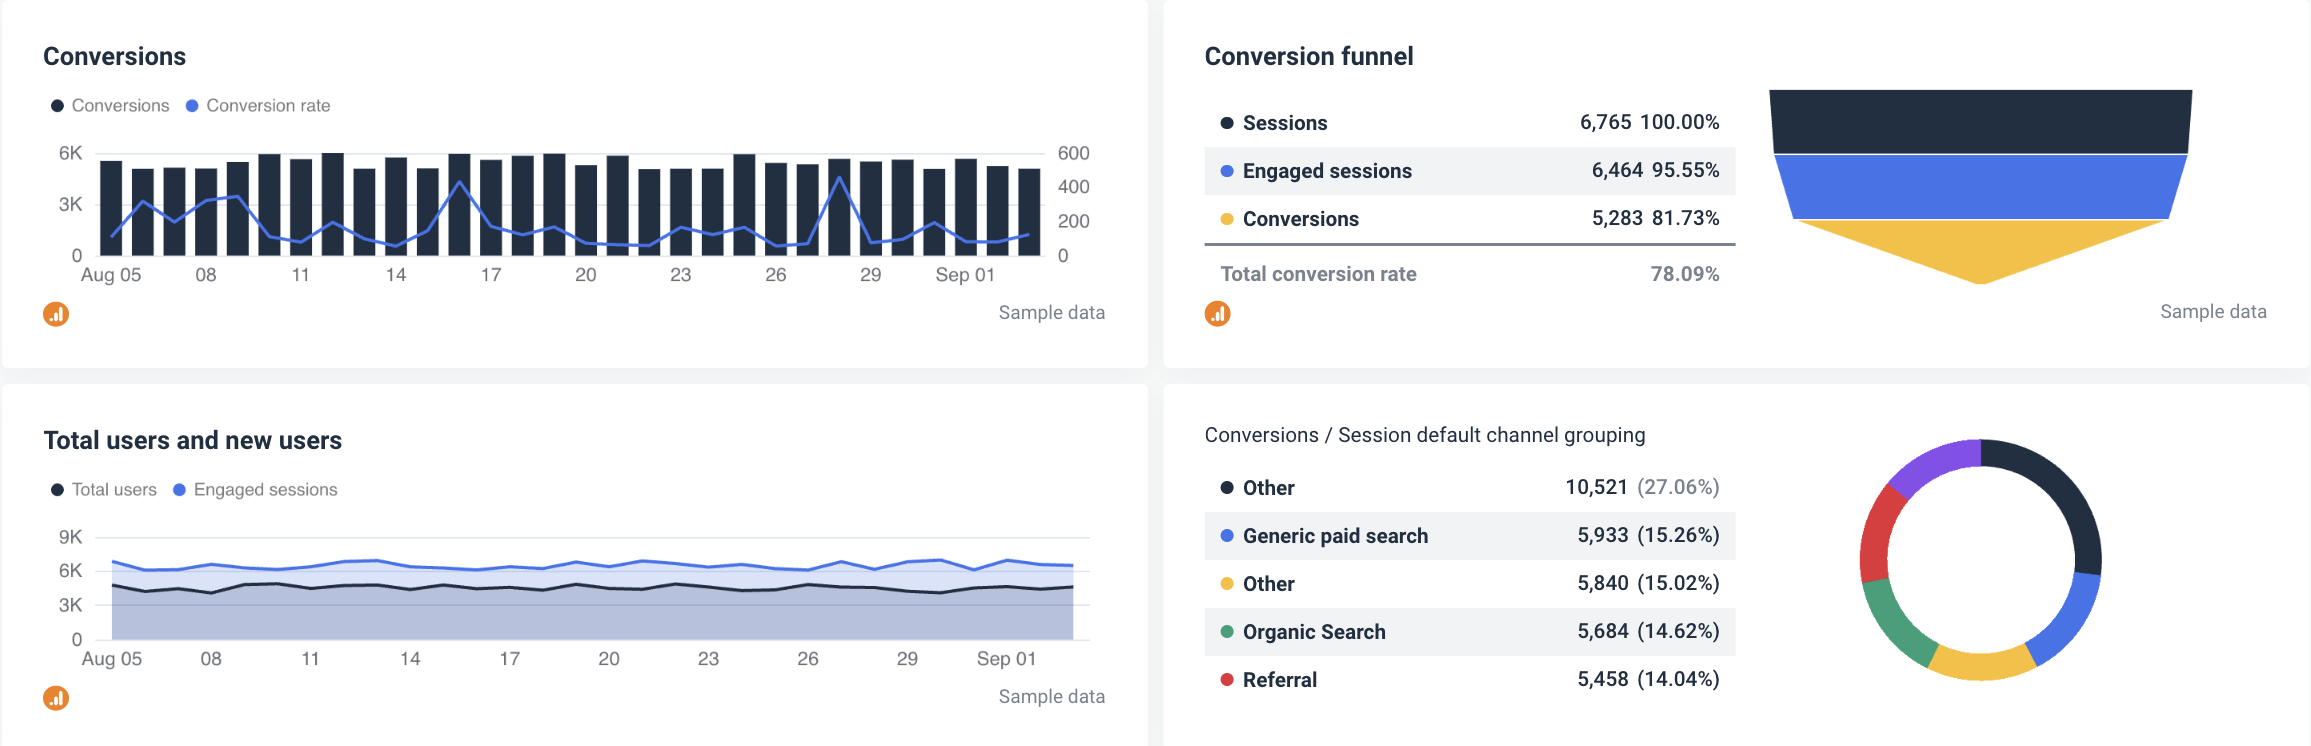
The conversion metrics indicate how effectively your website and marketing campaigns are turning visitors into leads, customers, and, eventually, revenue. These insights are vital for optimizing marketing strategies and driving business growth.
1. Conversion rate
Conversion rate is the percentage of website visitors who complete a desired action, such as making a purchase, filling out a form, or signing up for a newsletter. It’s a vital metric for understanding the effectiveness of your website or marketing campaigns in turning visitors into leads or customers.
2. Lead conversion rate
This metric specifically tracks the percentage of visitors who convert into leads, most often by filling out a contact form or signing up for a trial. It’s particularly important for B2B businesses or service-based industries where lead generation is a key goal. Monitoring this rate helps evaluate the effectiveness of lead generation strategies and the quality of incoming traffic.
3. Sales conversion rate
Sales conversion rate measures the percentage of leads that turn into paying customers. This metric is essential for assessing the efficiency of the sales funnel and the effectiveness of the sales team. A low sales conversion rate might indicate issues with lead qualification, pricing, or the sales process.
4. Cost per conversion (CPC)
CPC measures the total cost of acquiring a single conversion, including ad spend, marketing costs, and other expenses. This metric is important for understanding the profitability of marketing efforts. A lower CPC indicates that your marketing campaigns are cost-effective, while a higher CPC might signal that you need to optimize targeting or reduce costs.
5. Click-through rate (CTR) to conversion:
This metric tracks the percentage of users who click on a call-to-action (CTA) and then proceed to convert. It bridges the gap between CTR and conversion rate, providing insights into the effectiveness of both the CTA and the post-click experience. A high CTR but a low conversion rate could indicate issues with the client’s landing page or offer.
6. Abandonment rate
The abandonment rate refers to the percentage of users who start but do not complete a conversion process, such as adding items to a cart but not checking out. This metric is especially relevant for e-commerce sites. A high abandonment rate can highlight issues with the checkout process, such as complicated forms, unexpected costs, or lack of payment options.
7. Return on investment (ROI)
ROI measures the profitability of your marketing campaigns by comparing the revenue generated from conversions to the cost of the campaigns. It’s one of the most important metrics for assessing the overall effectiveness of marketing efforts. Positive ROI indicates that campaigns are profitable, while negative ROI suggests that spending is not translating into sufficient revenue.
8. Average order value (AOV)
AOV calculates the average amount spent each time a customer places an order. It’s a key metric for e-commerce businesses, helping to assess the effectiveness of cross-selling, up-selling, and pricing strategies. Increasing AOV can significantly boost revenue without increasing traffic or conversion rates.
9. Customer lifetime value (CLTV or CLV)
CLTV estimates the total revenue a business can expect from a single customer over the duration of their relationship. It’s an important metric for understanding the long-term value of acquiring new customers and for making informed decisions about marketing spend and customer retention strategies.
10. Goal completion rate
This metric tracks the percentage of visitors who complete a specific goal, such as signing up for a webinar, downloading a whitepaper, or requesting a demo. It’s particularly useful for tracking the effectiveness of content marketing efforts and lead nurturing strategies. Each goal completion contributes to the overall conversion process.
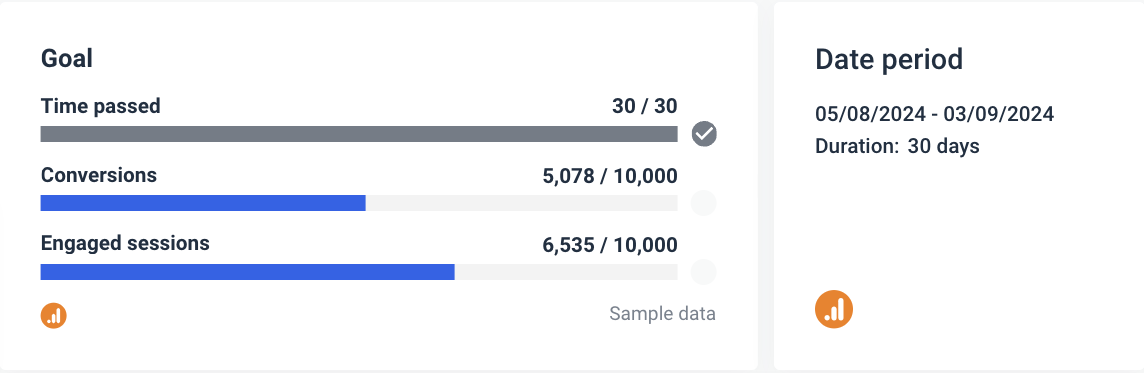
Our goal widget is not only useful for tracking client’s objectives. You can also use it to monitor the progress of your own agency KPIs. Here you can read more about what agency metrics and KPIs you should keep an eye on.
How to customize agency reporting to client needs
Customizing marketing agency reports to align with client's individual needs is essential for demonstrating value, improving transparency, and building strong client relationships.
Each client has unique goals, preferences, and levels of understanding, so tailoring reports to these factors ensures that the information is relevant, comprehensible, and actionable. Here are some agency reporting tips you can try.
Understand the client’s objectives
Start by understanding the client’s primary objectives. This may range from increasing brand awareness to generating leads, from driving sales to improving customer retention. Tailor the report to focus on metrics and insights that directly align with these goals. For example, a client focused on lead generation will find value in metrics like lead conversion rates and cost per lead, while an e-commerce client might be more eager to see sales conversion rates and average order value.
You should also work together with the client to identify the most important KPIs that you will monitor. This ensures that the report highlights the metrics that matter most to the client’s business success.
Tailor the report structure and content
Adapt the report’s language to match the client’s industry and internal terminology. Different data sources have different naming conventions, and your client might also name things differently throughout the company.
We use Whatagraph for all our client’s reports. The ability to title metrics differently is important to us because we often report the same metrics to different clients and just need to call them differently because many clients have internal terminology that is very different from one another.
This makes the report more relatable and easier for the client to understand. Avoid generic marketing jargon and ensure that explanations are clear and within a context.
As we’ve seen, even if you only include essential metrics, there are over 25. Focus on the most relevant to the client’s business objectives. For example, if the client is interested in SEO performance, emphasize organic traffic, keyword rankings, and backlink growth rather than social media engagement metrics.
To make your report feel more personalized and professional, you can incorporate the client’s logo, color scheme, and other branding elements. Although a small effort white labeling your marketing agency reports can improve the client’s experience.
Adjust the level of detail based on the audience
- Executive summary for decision-makers: For clients at the executive level who may not have the time to dive into detailed analytics, provide a high-level executive summary. This should include key insights, top-performing metrics, and strategic recommendations, without overwhelming them with too much data.
- Detailed analysis for marketing teams: For agency’s clients who are more hands-on with their marketing, such as a CMO or marketing team, provide a more detailed breakdown of the data. This might include granular metrics, campaign-specific performance, and in-depth analysis, allowing them to make informed decisions on future strategies.
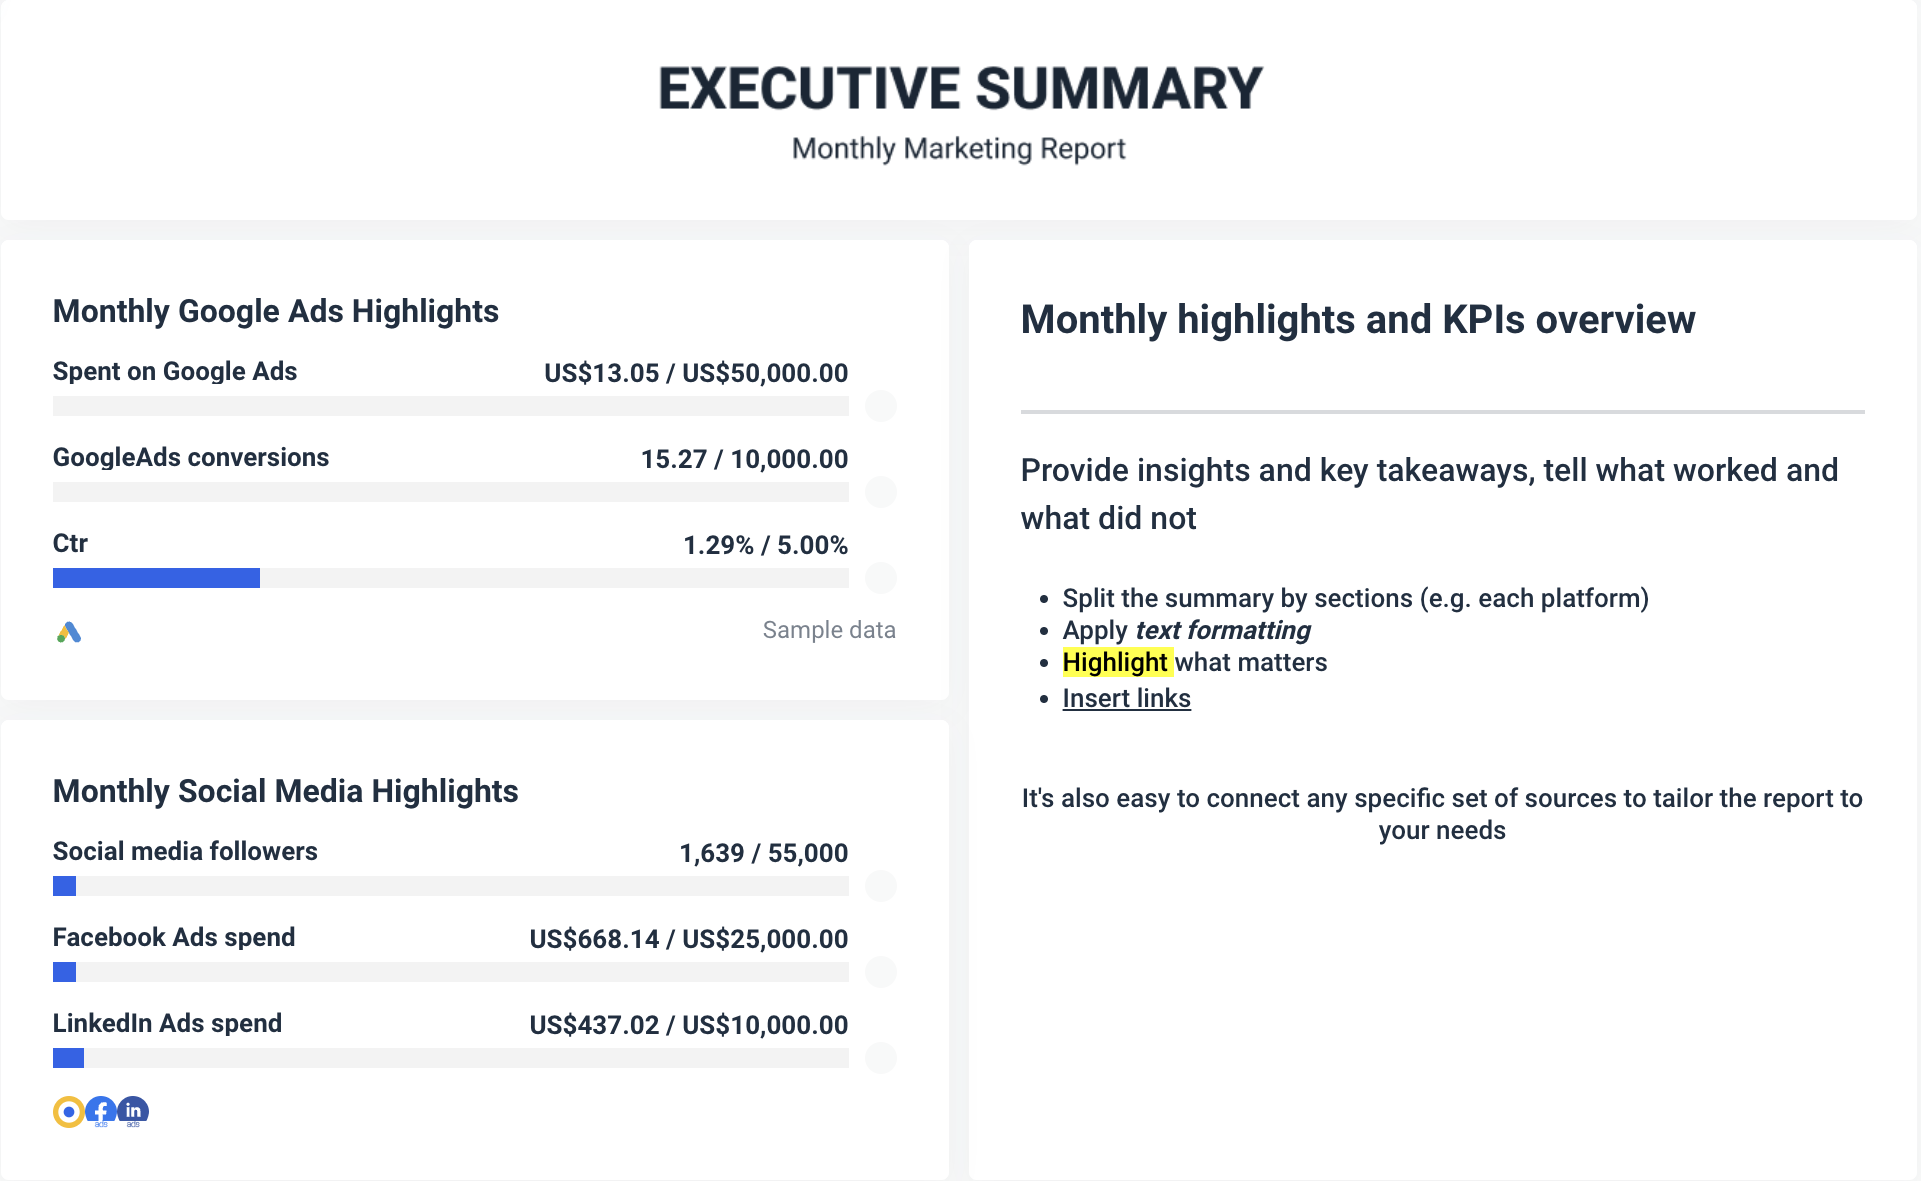
Whatagraph allows you to easily offer both levels in one report. Dedicate one page or report tab for an executive summary, and offer more in-depth marketing data in other tabs.
Visualize data effectively
Using visual representations of data, such as bar charts, line graphs, and pie charts, make it easier for clients to grasp complex information quickly. Customize these visuals to highlight trends, comparisons, and key performance changes over time. Whatagraph allows you to pick any color coding from the palette for chart fields to draw attention to the most important insights and recommendations. Using the intuitive drag-and-drop report builder, you can easily rearrange the visual elements to create logical clusters that tell the visual story of the client’s data.
Include actionable insights and recommendations
To present data is one thing, but interpreting it shows that you are ready to take extra steps to make your marketing agency reports more useful and personalized. Explain in simple words what the numbers mean in the context of the client’s goals, and suggest actionable steps that the client can take to improve performance. For instance, if a report shows a drop in organic traffic, provide insights on potential causes and recommendations for SEO improvements.
However, make sure to consider the client’s resources and capabilities when making recommendations. Provide solutions that are realistic and actionable given the client’s budget, team size, and other constraints. Alternatively, offer to make some changes yourself with clearly outlined expected results.
Provide a reporting cadence that meets the client’s needs
Some clients may require weekly updates, while others might prefer monthly reporting. Agree on frequency and establish a reporting schedule that aligns with the client’s expectations and allows for timely adjustments to strategies. Whatagraph’s automated reporting workflow allows you to set the cadence and put the whole agency reporting process on autopilot. And for clients who need more flexibility, Whatagraph has an option to share a live report that updates automatically via a live link. This way, your client has an on-demand dashboard they can access 24/7 without restrictions, which is especially important during campaign periods.
Listen to client feedback and improve
Check in with clients occasionally to ensure the report format and content continue to meet their needs. Client’s priorities may shift over time, so being open to feedback and making adjustments is key to maintaining relevance. If clients ask for certain data points or reporting styles, include their suggestions in the report. This customization shows that you value their input and are committed to delivering the most useful insights.
Common challenges in marketing agency reporting and how to overcome them
Even though reporting is one of the core agency processes, it has several specific challenges. Here are some of the agency reporting challenges you may be facing as well as how to overcome them.
Managing data overload
Marketing agencies have access to an overwhelming amount of information, from website analytics to social media insights. While this abundance of data can be a valuable resource, it can also lead to "data overload," making it challenging to identify what’s truly important. Here’s how agencies can filter and prioritize key data points to ensure that reports are both insightful and actionable:
- Align data with client goals: Identify the client’s primary business objectives, such as increasing sales, boosting brand awareness, or improving customer engagement. Focus on metrics that directly support these goals. For instance, if the goal is lead generation, prioritize metrics like conversion rates, cost per lead, and lead quality over vanity metrics like page views.
- Use the 80/20 rule: Also known as the Pareto Principle, this rule says that 80% of results come from 20% of efforts. Apply this to data analysis by identifying the 20% of metrics that are most impactful on the client’s success. This will help you filter out less important data and concentrate on what drives the most value.
- Segment your data: Break down large datasets into smaller, more manageable segments. For example, segment traffic data by source (organic, paid, social), or segment audience data by demographics. This allows for a more targeted analysis, making it easier to spot trends and actionable insights within specific areas of interest.
- Use dashboards or automated reporting tools: Use agency reporting tools to create custom dashboards that automatically pull and display only the most relevant data points from scattered sources. Whatagraph is a marketing data monitoring and reporting platform that increases marketing teams' efficiency by saving hours on manual tasks. It enables you to consolidate data from all channels, organize it, and turn it into dashboards and reports. These reports can be tailored to each client, ensuring that the data presented is always aligned with their specific needs.
By automating our data collection and reporting, we have not only made our own operations more efficient, but above all improved our customers' access to information. They can now benefit in real time from deeper insights presented in a clear and user-friendly way. We can now together make faster and even better decisions!
- Focus on trends and anomalies: Rather than getting lost in the sheer volume of data, focus on identifying trends (positive or negative) and anomalies that stand out from the norm. This approach helps pinpoint areas that need attention or optimization without the distraction of less significant data points.
- Regularly reassess data relevance: As campaigns evolve, so do the key metrics that need to be tracked. Regularly reassess which data points are most relevant to the client’s current objectives, and adjust reporting accordingly. This ensures that reports remain focused and avoid unnecessary clutter.
Balancing transparency with client expectations
Transparency is a cornerstone of effective client-agency relationships, but reporting on less favorable metrics — such as a drop in traffic, lower conversion rates, or underperforming campaigns — can be challenging. Here’s how agencies can maintain transparency without damaging client trust:
- Put data into context: When presenting unfavorable metrics, always provide context. Explain the possible reasons behind the drop, such as seasonality, market conditions, or recent changes in algorithms. Context helps clients understand that dips in performance are often part of a larger, more complex picture and not necessarily a sign of failure.
- Highlight the bigger picture: Place less favorable metrics within the context of overall performance. For example, while a particular campaign may not have performed as expected, it might still have contributed positively to long-term goals like brand awareness or lead nurturing. Emphasizing the broader impact helps clients see the value in their investment, even when specific metrics are down.
- Proactively offer solutions: Instead of simply reporting bad news, accompany it with actionable recommendations for improvement. For example, if organic traffic has decreased, suggest adjustments to the SEO strategy, such as targeting new keywords, updating content, or improving technical SEO elements. This proactive approach demonstrates your commitment to continuous improvement and reassures the client that you are actively working to address any issues.
Being proactive in suggesting optimizations and new strategies shows that the agency is committed to continuous improvement and delivering long-term value. We call that "advisory value" and we believe it is what separates us from other commoditized agencies.
And Mr. Hey’s agency reporting tip is not a drop in the ocean. While preparing for a recent webinar on client retention, we interviewed over 20 agency leaders and professionals and noticed that the role of an agency needs to definitely shift from a pay-as-you-go service provider to the one of a proactive advisor and strategic partner.
- Use visuals to help them understand: When dealing with complex or negative data, use visuals like trend lines, comparison charts, or heatmaps to make the information more digestible. Visuals can help soften the impact of bad news by showing it within the context of broader trends or by highlighting areas of stability or growth.
- Maintain a consistent reporting schedule: Regular reporting — whether weekly, monthly, or quarterly — helps build a narrative over time. By consistently sharing performance data, even when it’s not all positive, you build a foundation of trust. Clients are more likely to trust your analysis and recommendations when they see that you’re not just cherry-picking the best results.
- Always be honest but look for a solution: Honesty is important, but how you present that honesty matters. Avoid downplaying issues or being overly pessimistic. Instead, acknowledge the problem clearly and immediately follow up with a constructive plan of action. This shows clients that while challenges exist, you are equipped and prepared to overcome them.
Keeping up with industry changes
The digital marketing landscape is constantly evolving, with changes in algorithms, new tools, and emerging best practices that can impact how agencies report on SEO, PPC, and social media. Staying current with these changes is essential for providing accurate and relevant reports. Here’s how agencies can keep up with industry trends:
- Follow industry leaders and publications: Regularly read blogs, listen to podcasts, and attend webinars from industry leaders like Ahrefs, Semrush, HubSpot, and Google. These sources often provide the latest updates on SEO, PPC, and social media trends, including changes in algorithms, best reporting solutions, and best practices. Subscribe to newsletters from these sources to stay up to date with the latest developments.
- Encourage continuous learning: Motivate your team to apply for certifications and training programs in areas like Google Analytics, Google Ads, and social media management tools. Platforms like Coursera, LinkedIn Learning, and Google’s Skillshop offer courses that can help your team stay up-to-date with the latest industry standards and reporting techniques.
- Engage in industry communities: Join online communities and forums, such as Reddit’s r/SEO or specialized LinkedIn groups, where professionals share insights, challenges, and solutions related to digital marketing. Actively participating in these communities helps you stay informed about the latest trends and best practices, often before they become widely adopted.
- Attend marketing conferences and webinars: Participate in industry events like SMX, MozCon, or Social Media Week, where experts discuss the latest trends and future directions in digital marketing. These events provide valuable insights into emerging trends and allow you to brush shoulders with other professionals, gaining knowledge that can directly inform your reporting practices.
- Monitor algorithm changes and updates: Keep a close eye on major algorithm updates from Google, Facebook, and other platforms that can impact SEO rankings, PPC performance, and social media reach. Websites like Search Engine Journal and the official Google Search Central Blog often provide detailed analyses of these changes and how they might affect reporting metrics.
- Use advanced reporting software: Invest in tools that evolve with the industry, like Whatagraph, which regularly updates its features and the choice of integrations to reflect current trends. Apart from allowing agencies to automate much of their reporting, Whatagraph makes organizing connected data easy without any coding skills. It also comes with multiple time-saving features such as bulk report editing and the ability to save any widget or report you create as a template for future use.
On the other hand, agencies that use less flexible marketing dashboard tools such as Looker Studio (Google Data Studio) often run into limitations when they try to scale their reporting. If you still use Google’s reporting tool and feel that it’s getting harder and harder to make it work the way you want, don’t panic — maybe you have simply outgrown Looker Studio and are ready for a more capable all-in-one reporting platform.
- Regularly review and update reporting practices: Schedule regular reviews of your reporting practices to ensure they align with current trends and technologies. For instance, as Google continues to prioritize Core Web Vitals, it may be necessary to integrate these metrics into your SEO reports. Similarly, with the rise of video content on social media, you may need to start tracking video engagement metrics more closely.
Wrapping up
Effective agency reporting is more than just presenting the state of numbers after a period. It’s about telling a compelling story that demonstrates the value of your work, builds client trust, and positions your agency as a strategic partner rather than just a service provider.
By understanding the client’s business objectives, you can focus on reporting only the metrics that are really essential for the given period or campaign.
Tailoring the reports to your client preferences, such as layering the level of detail for different audiences and adding personalized insights that explain data in context, shows that you’re ready to take extra steps to provide value through your reporting.
Finally, whether you want to reduce data overload, offer engaging visual insights, or scale your reporting to more clients without compromising the quality of your reports, you need an agency reporting solution that can evolve with your needs.
Our Agency Dashboard seems to be the perfect fit. Try it for free for 7 days and see how much time you can save for more creative tasks.
Published on Mar 10 2020
WRITTEN BY
Nikola GemesNikola is a content marketer at Whatagraph with extensive writing experience in SaaS and tech niches. With a background in content management apps and composable architectures, it's his job to educate readers about the latest developments in the world of marketing data, data warehousing, headless architectures, and federated content platforms.