Google BigQuery Tutorial: The Complete Guide
BigQuery has become popular with marketers thanks to its ability to store and analyze data from sources like Google Analytics or Facebook Ads. The aim of this article is to provide a comprehensive BigQuery tutorial. Here you’ll learn what Google BigQuery is, how to set it up, how to use it, and most importantly, why you should use BigQuery in the first place.

Jan 17 2023●7 min read


What is Google BigQuery?
Google BigQuery is a fully-managed data warehouse that runs on the Google Cloud and allows users to store and analyze huge datasets.
Let’s now expand this answer with more accurate definitions.
Database
BigQuery is a database in the broadest sense. Databases are collections of related data, and BigQuery allows you to store petabytes of data.
Cloud-based data warehouse
The official title of BigQuery is a serverless data warehouse. Data warehouses are types of data storage where you can not only store structured data from multiple sources but also analyze it. In other words, BigQuery is an analytics database you can use to run queries and get insights from your business data using built-in features like machine learning, geospatial analysis, and business intelligence.
And to get insights from data coming from diverse sources, you need a data pipeline to transfer your data safely to BigQuery. When designing Whatagraph’s data transfer feature, we had two types of users in mind:
- Small non-tech teams
- Marketing agencies that handle hundreds of clients, each with their own data stacks
In both cases, teams needed an automated solution that allows them to quickly and effortlessly load data from multiple sources to Google BigQuery.
We removed all the coding on the user side, so you can now complete the data transfer process with a few clicks.

Columnar storage system
BigQuery features a columnar storage system that supports nested and repeated columns as semi-structured data. This is mostly a technical definition that will appeal to data-savvy professionals.
Spreadsheet database
This is the most basic definition of BigQuery. BigQuery combines the features of both spreadsheet software like Google Sheets, and a database management system like MySQL.
BigQuery allows you to collaborate with partners, analysts, or other stakeholders in a familiar spreadsheet interface but also to retrieve information from structured datasets.
How to set up BigQuery?
A big selling point of BigQuery is that it is a cloud service. You don’t have to install any software and worry about compatibility or updates. Google handles the infrastructure, and you only need to set up BigQuery.
Step 1: Open the Google Cloud Platform
If this is a first-time visit, you need to select your country and agree to the Terms of Service.
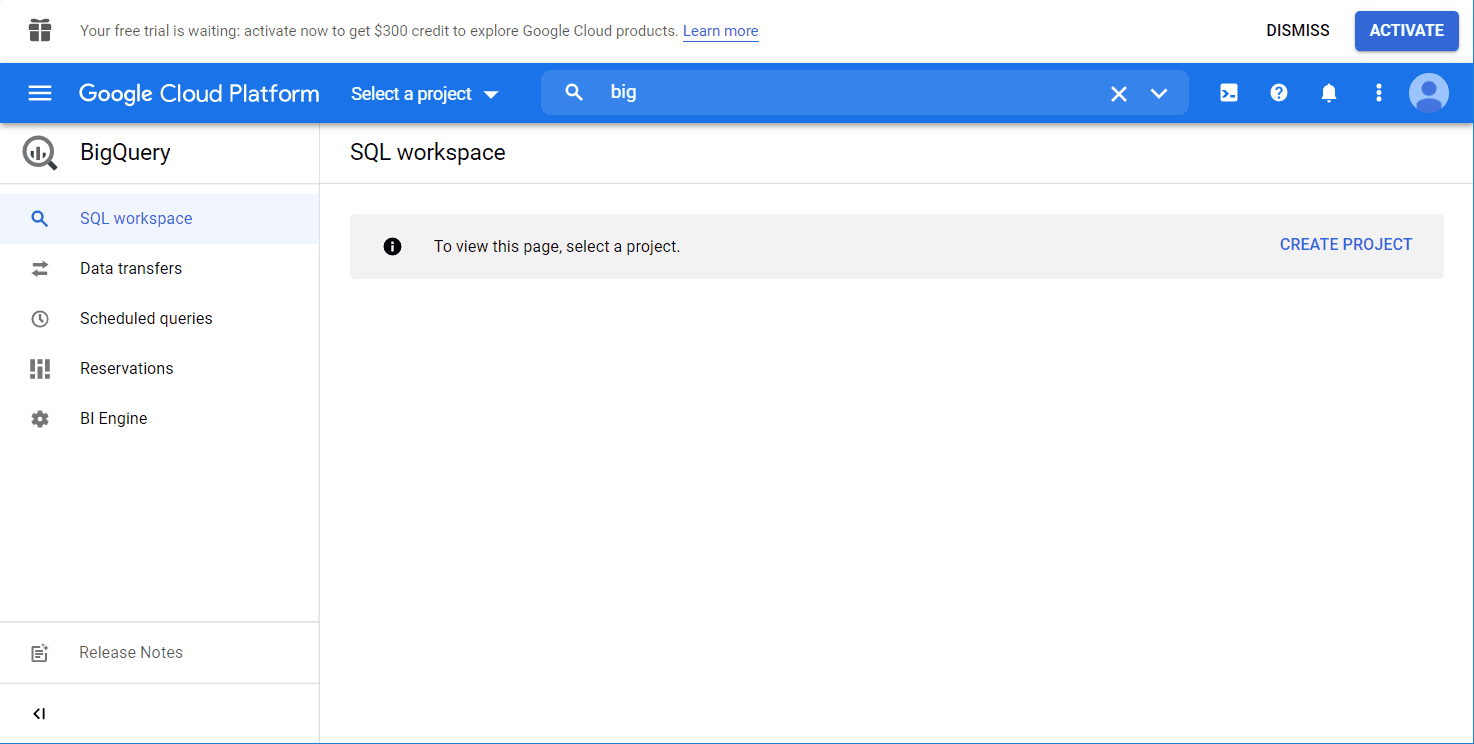
Step 2: Go to BigQuery
You can find it either through the search bar or by selecting it manually in the left menu.
This is how BigQuery looks when you open it for the first time.
Step 3: Create a project
Click the Create Project button to start. Name your project, choose an organization, if needed, and click Create.
You’ll get an official welcome window to BigQuery.
What is the BigQuery Sandbox?
BigQuery Sandbox is a BigQuery initiative that allows you to explore the capabilities of this data warehouse at no cost, to determine whether BigQuery fits your needs.
Once you start a BigQuery project, you’ll see two messages at the top of the BigQuery console:
1. Sandbox: Set up billing to upgrade to the full BigQuery experience.
2. Your free trial is waiting: activate now to get a $300 credit to explore Google Cloud products.
Sandbox is a free account option that doesn’t require entering payment information. The sandbox gives you 10 GB of active storage and 1 TB of processed query data per month.
With your sandbox account, your tables expire in 60 days.
The second banner offers you to activate a free trial. The difference from the sandbox is that once you activate the trial, you’ll need to enter your payment details. Do it, and you get $300 of cloud credits for free.
For now, you can dismiss both options, because, in this tutorial, we’ll only be using the sandbox option.
How to use Google BigQuery?
Create a data set
First, we’re going to add some data into BigQuery to see how it works.
1. Click the project you want and then Create Dataset.
2. Assign a Dataset ID. You can enter letters and numbers. If needed, you can select the Data location as well as a table expiration (no longer than 60 days in the sandbox) and encryption. You’ve created a new dataset. Find it by clicking the Expand node button next to your project name.
3. Create a table. Click the Create Table button, and you have 5 options:
- Empty table: Create an empty table and fill it manually.
- Google Cloud Storage: Import a table from Google Cloud Storage.
- Upload: Upload a table from your device in one of the supported formats.
- Drive: Import a table from Google Drive (with this option, you can import Google Sheets).
- Google Cloud Bigtable: Import a table from Google Cloud Bigtable through the CLI.
What file formats can you import into BigQuery?
You can load your table data into BigQuery in these formats:
- CSV
- JSONL (JSON lines)
- Avro
- Parquet
- ORC
- Google Sheets ( for Google Drive only)
- Cloud Datastore Backup (only for Google Cloud Storage)
How to upload CSV data to BigQuery
Click the Create table butting and follow these steps:
1. Choose source — Upload
2. Select file — Click Browse and choose the CSV file from your device
3. File format — Choose CSV, although the system will probably detect the file format
4. Table name — Name your table
5. Tick the Auto detect checkbox
6. Click Create table
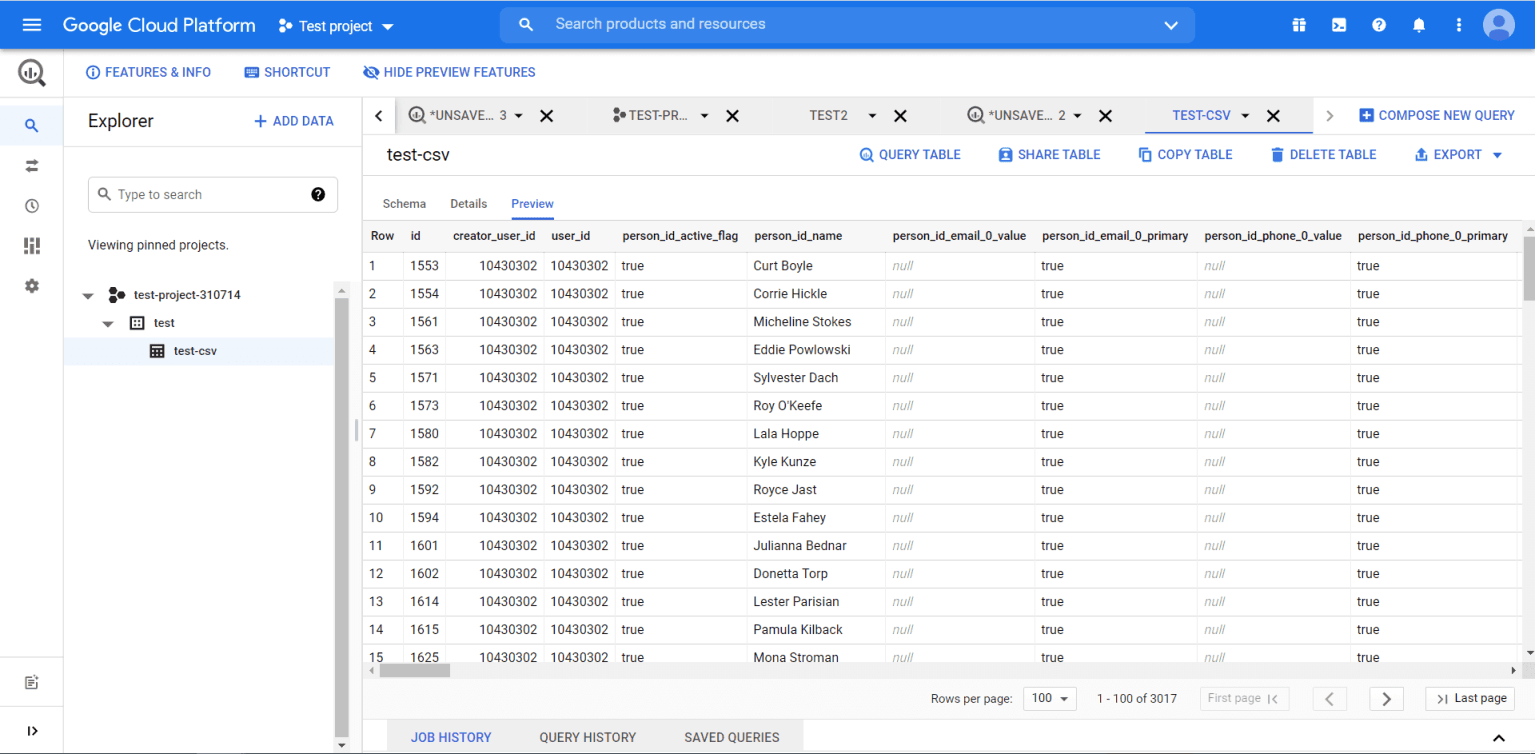
This is what the basic flow looks like if you're uploading a CSV file from your device.
This is what your BigQuery table looks like:
How to import data from Google Sheets to BigQuery manually?
BigQuery also allows you to upload Google Sheets tables manually. To do this, click the Create table button and:
1. Choose source — Drive
2. Select Drive URL — Insert the URL of your spreadsheet
3. File format — Choose Google Sheets
4. Sheet range — Specify the sheet and data range for import
5. Table name — Enter the table name
6. Check the Auto detect checkbox
7. Click Create table
Advanced options let you skip rows with column values that don’t match the schema, skip a specific number of rows from the top, and select an encryption key.
BigQuery will import the specified sheet from your spreadsheet.
How to import data to BigQuery on a schedule?
You may have a dataset in Google Sheets you need to load data to BigQuery every day. You can do this manually, or automate the import using Whatagraph.
Transfer data to BigQuery with Whatagraph
If you need to store data from multiple marketing tools in BigQuery, it makes much more sense to use Whatagraph.
Let’s say you want to transfer your Google Ads data to BigQuery for analysis:
1. Open Whatagraph and click the Data transfer tab. Click the Create new transfer button.
2. Enter the Project ID and click Test connection. If everything is OK, click Save and continue.
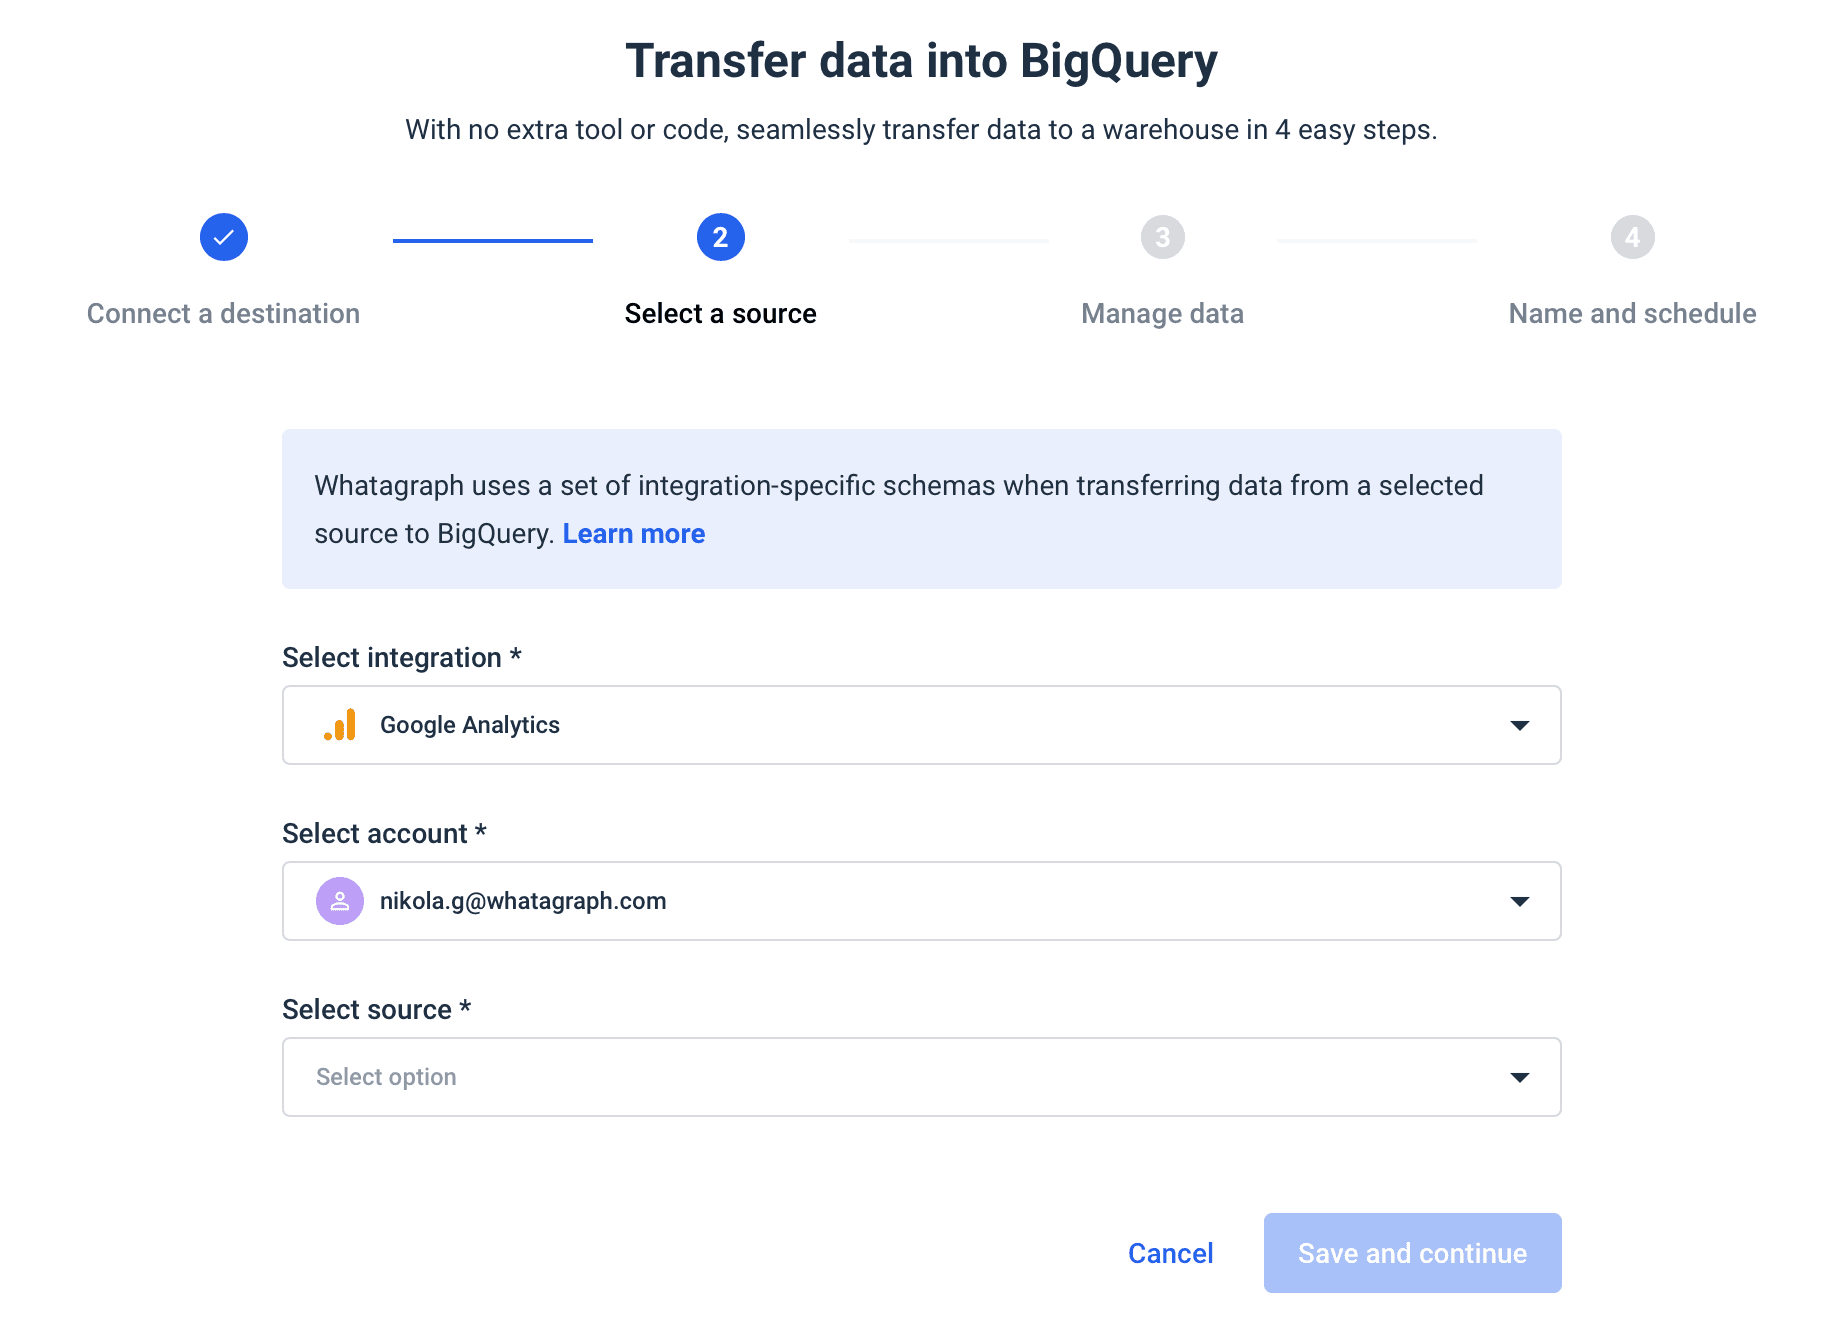
3. Select the integration from the dropdown. Click Google Ads.
4. Select an account and click Save and continue.
5. Choose the data points and dimensions you want to transfer and click Save and continue.
6. Name your transfer, select frequency, and click Create transfer.
All done! Your data from Google Ads is on its way to BigQuery.
When you click on new transfer details, you get a quick overview of the transfer you’ve just created.
How to query tables in BigQuery?
BigQuery allows you to query tables in your database using the standard SQL dialect. You can also use non-standard or legacy SQL, but, BigQuery recommends standard SQL.
If you understand Google Sheets QUERY functions, you should understand how queries work:
=query(Deals!A:EU,"select E, N, T order by T Desc")
"select E, N, T order by T Desc" — this query retrieves three columns of the entire data set and orders the results in descending order.
How to save queries in BigQuery?
Click Save => Save Query to save your queries for later use.
In the Save query window, name your query and choose its visibility:
- personal — only you can edit the query later on
- project — only project members can edit the query
- public — the query is available publicly for editing
Click on Save.
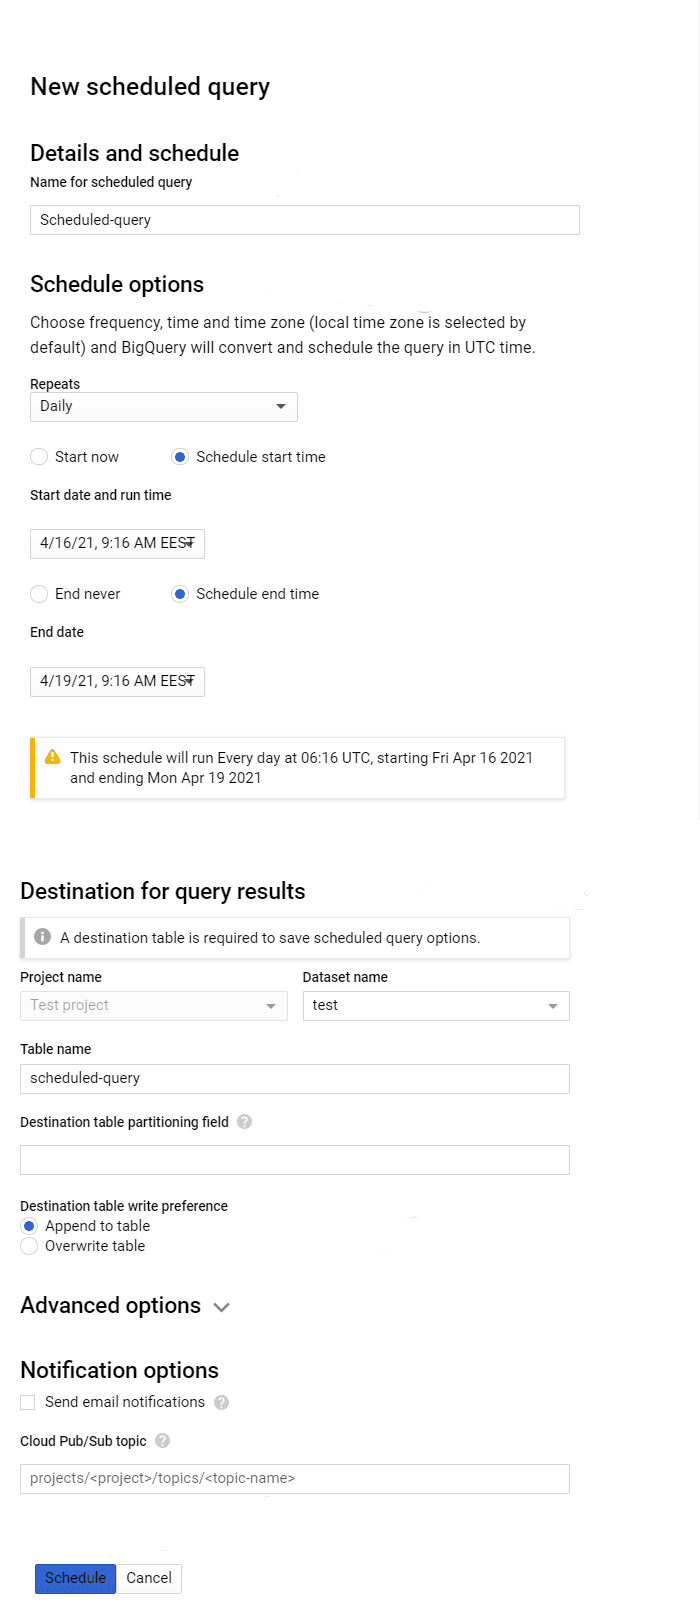
How to schedule queries in BigQuery?
Right next to the Save button, you’ll find a Schedule button you can use to schedule queries.
So why would you run SQL queries on schedule in the first place?
There are at least two reasons:
- Queries are often huge and take a lot of time to run, so you better prepare data in advance.
- Google charges money for data queries, so if you can manage to upload data daily, it's better to use already prepared views to query them ad-hoc.
When you click the Schedule button, you’ll get a message that you need to enable the BigQuery Data Transfer API first.
Click Enable API, and you’ll be able to use the Schedule button to create scheduled queries.
To proceed, click Create new scheduled query and define parameters like
- Name for scheduled query
- Schedule options
- Repeats
- Start date and run time
- End date
- Destination
- Table name
- Write preference
- Overwrite
- Append
You can also set up advanced options and notifications. When you finish setting up, click Schedule.
Now select your Google account to continue to BigQuery Data Transfer Service.
How to export queries from BigQuery?
Users often need to export the results of their queries outside BigQuery. The common destinations are spreadsheet apps like Google Sheets and Excel, visualization and dashboarding apps like Google Data Studio and Tableau, and other business intelligence tools.
To export query results, click the Save Results button and select one of the options:
- CSV file
- Download to your device (up to 16K rows)
- Download to Google Drive (up to 1GB)
- JSON file
- Download to your device (up to 16K rows)
- Download to Google Drive (up to 1GB)
- BigQuery Table
- Google Sheets (up to 16K rows)
- Copy to clipboard (up to 16K rows)
In this case, we’ll choose the BigQuery table option.
Name your table and choose the project and BigQuery dataset. Click Save and you’re all done.
How does BigQuery store data?
Traditional relational databases store analytics data in rows. BigQuery, on the other hand, stores big data column by column. This columnar system gives BigQuery very fast output, which is essential for online data analysis.
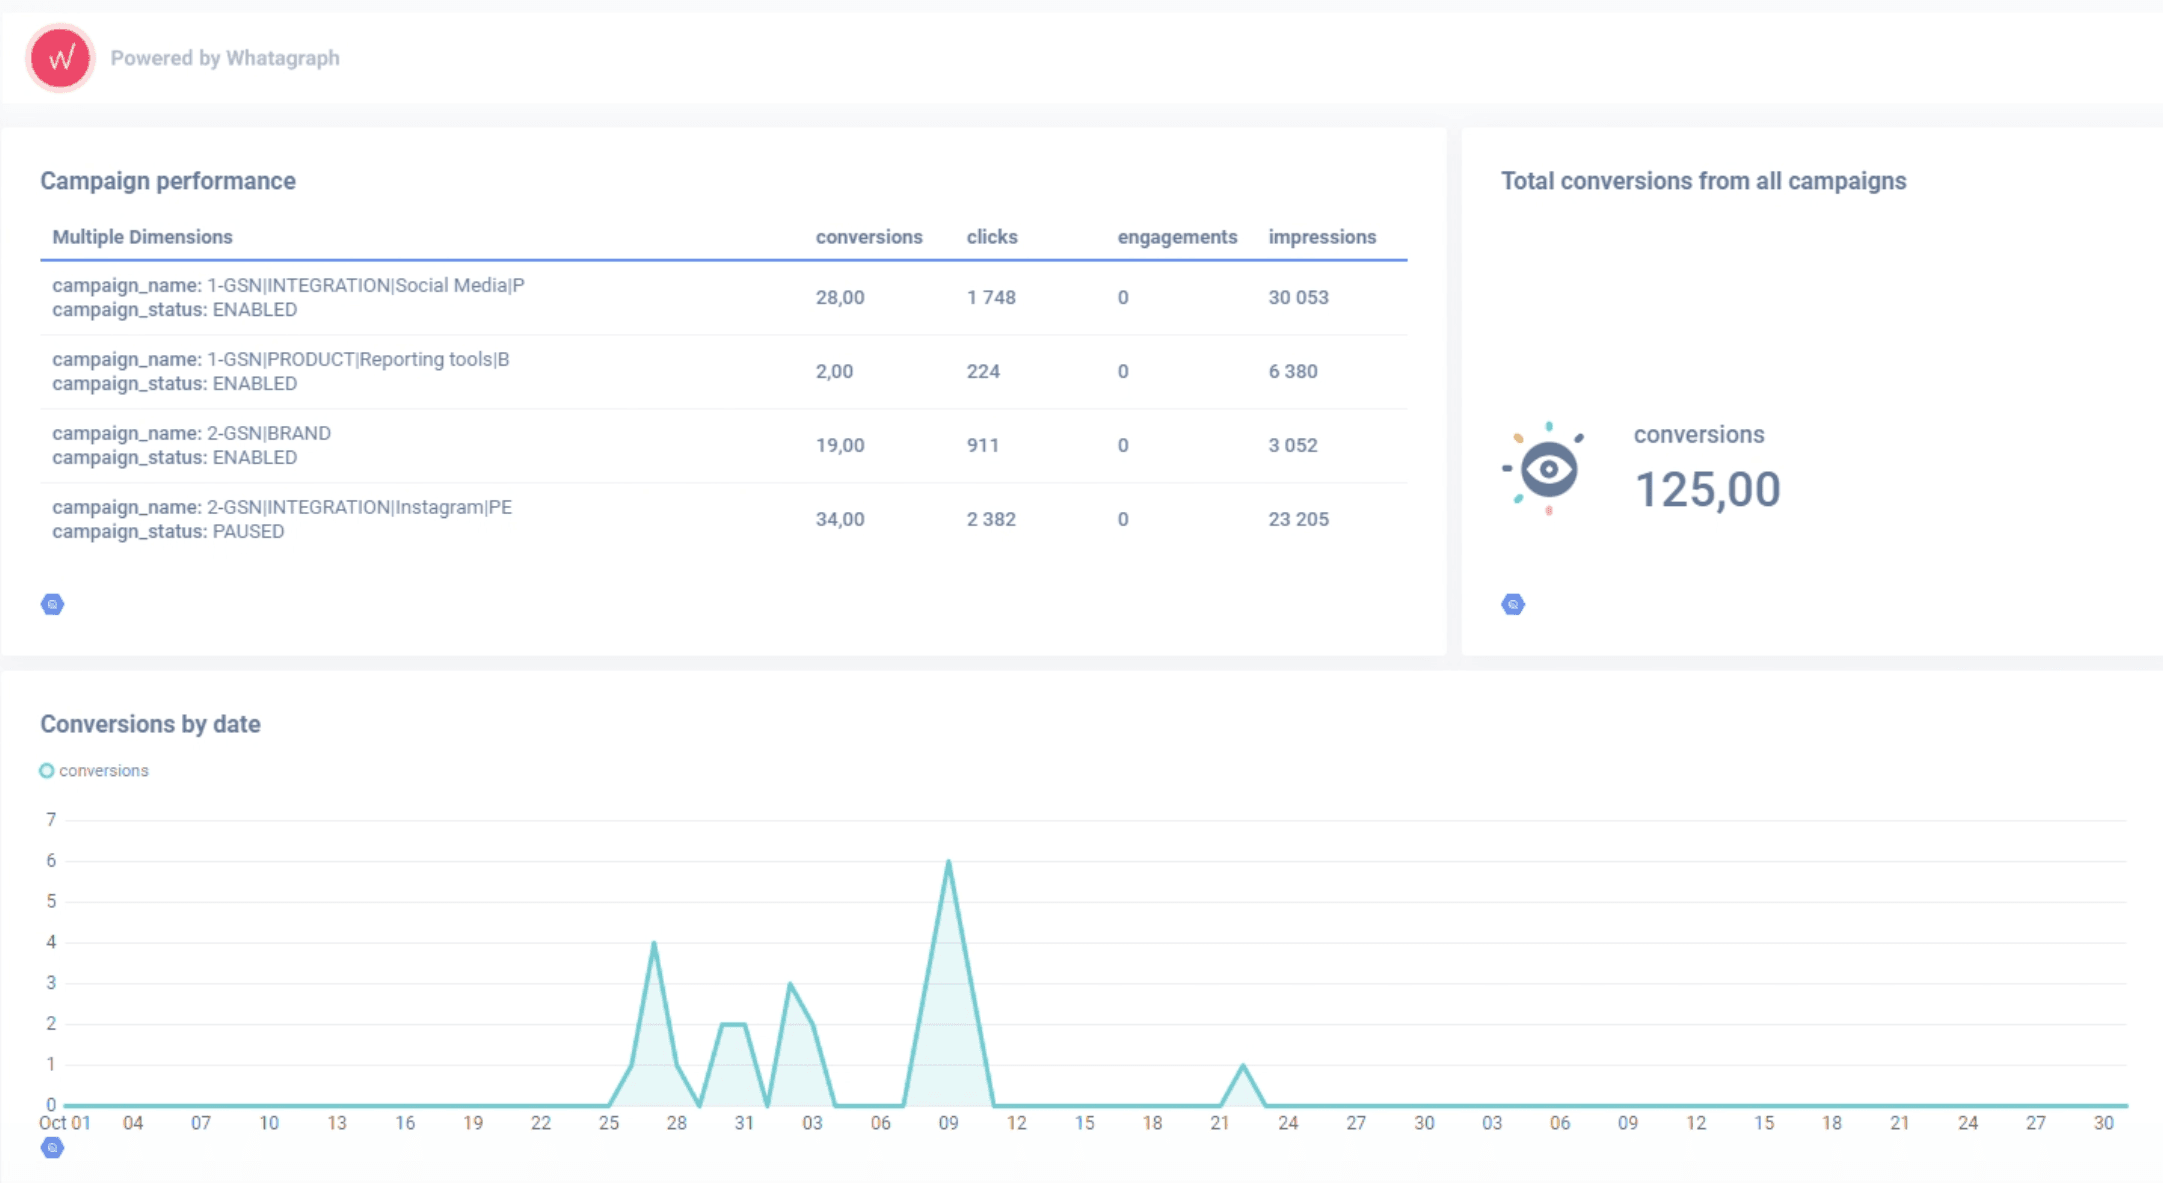
How to visualize a BigQuery dataset?
BigQuery is able to analyze large volumes of data with SQL, which is a great format for analysis but is still a bit raw. To visualize your data, you can use Whatagraph.
You can use Whatagraph to visualize any data that is available in your BigQuery account. This not only includes data created by the Whatagraph transfer function but any data source you may have.
Just select your BigQuery account, connect your sources, and create report.
Now you can drag-and-drop dimensions or metrics from your dataset to organize your data display.
You can use the filter function at the top of your dashboard to filter your dataset to show only a specific area or subset. Drag fields into the filter as you’d drag them into your metrics or dimensions.
Whatagraph allows you to create calculated fields, plant data together with other data, or use custom functions with custom metrics that you create.
Why should you use BigQuery?
No infrastructure management
BigQuery has a serverless architecture that is fully managed by Google Cloud which means you don’t have to invest in additional storage and computing power.
Analyze data from any source
With BigQuery, you don’t have to download your data for analysis. The computer engine and data source are separated so that you can analyze your data from any of your storage choices. You can store and analyze data within BigQuery or use BigQuery to analyze your data where it lives.
Familiar interface
BigQuery uses a Google Cloud console interface and command-line tool. Data scientists and developers can access client libraries with familiar programming languages, including Python and JavaScript, and BigQuery’s REST API to transform and manage data.
Public datasets
Explore large, real-world data from the Public Dataset Program. Access over 40 public datasets and integrate them into your applications as needed. Google pays for the storage of these data sets, and you, as the end user, only pay for the queries you perform.
BigQuery pricing
BigQuery offers both on-demand and flat-rate subscription models. Loading, copying, and exporting data are free, and you only pay for data storage and querying, where it charges the quantity of processed data during each query.
Wrapping up
By now, you should have the answers every beginner has when coming face to face with a new tool. If you have more questions, stay tuned. In the following articles, we’ll cover other BigQuery-related topics, such as BigQuery SQL syntax and using client libraries to start the BigQuery API in your preferred programming language.
If you’re looking for an easy-to-use solution to connect data from various marketing sources, keep your marketing data safe, or want to visualize your BigQuery data, book a demo call and find out how Whatagraph can help.
Published on Jan 17 2023
WRITTEN BY
Nikola GemesNikola is a content marketer at Whatagraph with extensive writing experience in SaaS and tech niches. With a background in content management apps and composable architectures, it's his job to educate readers about the latest developments in the world of marketing data, data warehousing, headless architectures, and federated content platforms.