Benefits of Analytical Intelligence
Intelligence is one of the most-mentioned subjects in psychology. However, it may be interesting to note that there is no standard definition in existence to qualify what exactly constitutes intelligence.

Jun 15 2020●5 min read

What is Intelligence?
Obviously, intelligence is one of the most-mentioned subjects in psychology. However, it may be interesting to note that there is no standard definition in existence to qualify what exactly constitutes intelligence.
According to some famous researchers, intelligence is considered a single and general ability. Others assumed that intelligence is that ability that encompasses a range of talents, aptitudes, and skills.
The Definition of Psychologists
Throughout the history of human psychology, you might be surprised to hear that the word “intelligence” has made its way as one of the most critical and controversial topics. Despite the vast range of interest in the subject, it’s no surprise that there are many considerable disagreements over the specific factors or components that constitute the word “intelligence.” Surprisingly, varying degrees of questions posed to psychologists on how to define intelligence remains relevant as a subject of discourse as there seems to be an eternal debate regarding the subject matter.
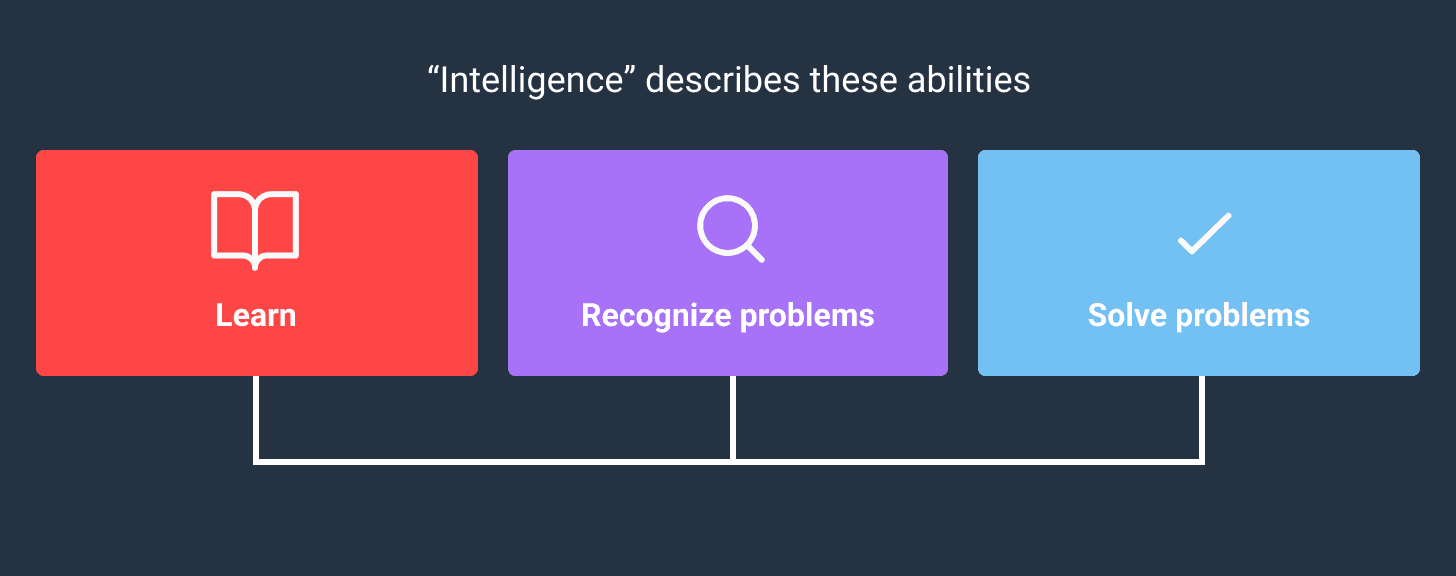
However, some researchers have deemed it fit to propose different definitions of intelligence. While these meanings can vary considerably from one researcher or theorist to another, the current concept and agreement suggest that intelligence is a word that generalizes the ability to carry out the following:
 |
- Learn: Learning simply means the acquisition, retention, and application of knowledge;
- Recognize Problems: This simply refers to the ability to put the acquired knowledge into use. Intelligent people are those believed to identify possible problems in their surroundings. Therefore, think of a possible way out to address those problems;
- Solve Problems: After learning and identifying problems, the next is to proffer solutions to those problems. Intelligent people can convert the knowledge acquired to identify those problems and then proffer useful solutions to solve those problems.
However, intelligence involves a wide range of abilities. These include reasoning, logic, planning, and problem-solving. As mentioned earlier, intelligence seems to be one of the most widely researched topics, and it is one of those subjects that generate the highest controversies in the modern world.
While you might have read that this definition often receives disagreement from psychologists, comprehensive research on this concept plays a significant role in several areas. These include the area of the percentage of the budget to be allocated to educational programs, the use of various Applicant Testing systems to screen prospective job applicants, and many more.
How Does the Concept of Intelligence Develop?
History has documented that the word “intelligent quotient” often shortened as “IQ” was coined by a German Psychologists known as William Stern in the earlier 20th century. Shortly after that time, another psychologist named Alfred Binet made a significant discovery in the history of psychology. Binet developed the first intelligence test to help the French government identify students who require additional academic assistance.
Incredibly, Binet remained the first psychologist to introduce the concept of mental abilities that children possess while they age.
From that time, the concept of intelligence testing has become a widely accepted tool that has resulted in the developments of several other skills and aptitude tests. However, it has continued to spark the interest of many since that time owing to the widespread use of such testing. While some opined that it might involve cultural bias, others also feel that it might have some influence on intelligence.
Theories of Intelligence
The varying degrees of controversies and debates have led to various theories proposed by different researchers to explain the nature of intelligence. During the last century, some of the theories that have emerged include Charles Spearman’s theory of general intelligence, Louis L.Thurstone’s theory of primary mental abilities.
Others are Howard Gardner’s theory of Multiple Intelligences and the theory of Robert Sternberg known as the Triarchic Theory of Intelligence. In this piece, we’ll only be looking at Sternberg’s theory of intelligence.
What is Sternberg’s Three Theory of Intelligence?
Robert Sternberg proposed three different forms of intelligence. These include analytical, experiential, and practical. These three different forms of intelligence measures the ability of the brain to identify and manage different types of problems and challenges.
What is Analytical Intelligence?
Analytical intelligence is one of the three types of intelligence proposed by Robert Sternberg in his triarchic theory. He defined this type of intelligence as the ability to process and apply logical reasoning. It is used for data processing.
Simply put, it involves the ability of an individual to identify patterns and accurately predict the outcomes of complex events. Compared to the three other types of intelligence, analytical intelligence shows some form of closeness with the exact thing that’s measured on the traditional intelligence quotient (IQ) test.
What Does Experiential Intelligence Connote?
The second form of intelligence proposed by Sternberg is experiential intelligence, also known as creative intelligence. According to Sternberg, intelligent people tend to exhibit a predisposition for creative thinking (thinking outside the box), which often leads to problem-solving. Upon confrontation with events that they’ve never come across in their lives, their high level of creativity functions to help them devise a quick solution to those problems.
People with experiential intelligence tend to pick up new skills and ideas faster than others. In fact, they show some form of talent in terms of concocting new ideas, insights, and approaches to novel scenarios. All these traits contribute to transforming them into an expert problem solver.
What is Practical Intelligence?
As proposed by Sternberg, practical intelligence simply denotes the intelligence of common sense thinking. Otherwise, it is known as “street smarts.”
Whenever a person is practically intelligent, he/she will exhibit the innate ability to adapt faster to unfavorable conditions. Apart from that, they tend to show confidence in navigating their surroundings.
Imagine the moment you got lost while visiting a new city for the first time. How did you react while in such an unfavorable condition? What was your plan to navigate your way back home? This is exactly a typical scenario of practical intelligence.
What are the Traits and Abilities Associated with Analytical Intelligence?
Are you analytically intelligent? What are the traits, skills, and abilities you possess?
According to Robert Sternberg, people with analytical intelligence tends to perform excellently well in academic environments. This is due to their innate ability to combine logic with deductive reasoning to arrive at concrete solutions. Apart from that, this category of people also performs excellently well in grasping abstract concepts.
Analytical intelligence is a part of the three triarchic theory that incorporates pattern recognition, spatial recognition, mathematical and statistical proficiency, and linguistic intelligence.
What is Robert Sternberg Remembered for?
Robert Sternberg is a renowned psychologist and researcher. He is a Professor of Human Development at Cornell University. While he has contributed significantly to the development of psychology, generally, his triarchic theory of intelligence remains the most famous of his discoveries and innovations.
According to Sternberg, an intelligent person is someone with the ability to discover the right balance between a wide variety of mental skills and solve problems that come their way. Similarly, he believes that there is a possibility of attaining success in more than one type of intelligence. In fact, many people utilize all three models at a high level. In his opinion, this might be a contributory factor to their all-round success in life.

WRITTEN BY
Gintaras BaltusevičiusGintaras is an experienced marketing professional who is always eager to explore the most up-to-date issues in data marketing. Having worked as an SEO manager at several companies, he's a valuable addition to the Whatagraph writers' pool.