BigQuery Analytics — A Complete Overview
Google BigQuery is the data warehouse component of Google Cloud Platform optimized to run analytic queries on large datasets. Cloud data warehouses help users analyze big data and access it in real time for faster analysis and reporting. You can export data from a Google Analytics 360 account to BigQuery and then use a SQL-like syntax to query all your Analytics data. However, to maximize your data analysis investment, you need to understand its capabilities and how it processes queries.

Jan 18 2023●5 min read


4 types of analytics workflows
BigQuery supports several data analysis workflows:
1. Ad hoc analysis
BigQuery uses GoogleStandard SQL that enables ad hoc analysis. Run queries in the Google Cloud console or through a third party that integrates with BigQuery.
With Google BigQuery, you can run ad hoc, SQL-like queries against data sets with billions of rows. This can be your own data or data someone has shared with you.
BigQuery is best used for interactive analysis of terabyte datasets to which you can add fresh data.
Ad hoc functionality is best used for:
- Reporting on hundreds of millions of sales transactions to understand changes in demand.
- Segmentation analysis of millions of customers to identify individual cohorts for targeted marketing.
- Monitoring dashboards and instant zooming into problem areas.
- Combining different business data types to discover previously invisible correlations.
By analyzing all BigQuery's qualities, we chose it as the dedicated warehouse for Whatagraph data transfers.
Our goal was to help small non-tech teams and marketing agencies that handle hundreds of clients complete data transfers from multiple sources to BigQuery with just a few clicks.
We knew right away that coding on the user side is out of the question, so we created a point-and-click interface.
For both groups of clients, Whatagraph saves the time needed to load data from multiple sources to Google BigQuery.
2. Geospatial analysis
BigQuery operates geography data types and Google Standard SQL geography functions to let users visualize and analyze geospatial data. Location information is very important in data warehouses like BigQuery.
Many critical business decisions revolve around location data. For example, you can record the latitude and longitude of its delivery vehicles or packages over time. You may also record customer transactions and join the data with another table with store location data.
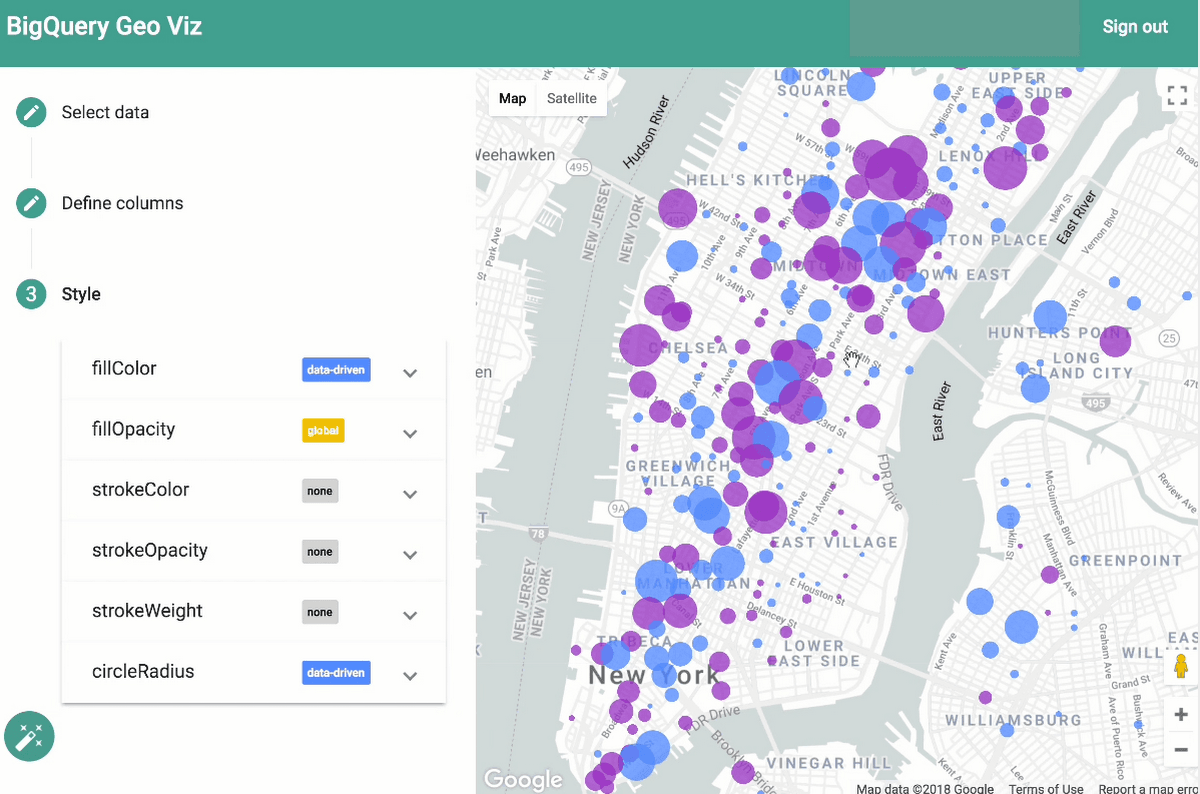
This way, the location data can help you determine when a package is likely to arrive or which customer should receive a package. With geospatial analytics, you can analyze and visualize geospatial data in BigQuery by using geography types and SQL geography functions.
Limitations
Geospatial analytics has certain limitations:
- Geography functions are available only in Google Standard SQL
- Only the BigQuery client library for Python supports the GEOGRAPHY data type. For the client libraries, you need to convert GEOGRAPHY values to strings using the ST_ASTEXT or ST_ASGEOJSON function
3. Machine learning (ML)
BigQuery has a built-in machine learning tool called BigQuery ML. It helps data scientists and data analysts create and run ML models on structured and unstructured data directly inside BigQuery, using simple SQL queries.
BigQuery ML democratizes machine learning by letting SQL users build models using existing SQL tools and skills. At the same time, BigQuery ML speeds up development by eliminating the need to move data.
You can access BigQuery ML functionality by using:
- The Google Cloud console
- The bq command-line tool
- The BigQuery REST API
- An external tool, such as a business intelligence platform
Machine learning on large datasets normally requires time-consuming programming and ML framework knowledge. As a result, solution development is limited to a small group of people within each company — excluding data analysts who understand data but have restricted machine learning and programming knowledge.
BigQuery ML allows data analysis to use machine learning along with existing SQL tools. Analysts can use BigQuery ML to build and evaluate ML models without having to export small amounts of data to spreadsheets or wait for a limited trickle from a data science team.
4. Business intelligence (BI)
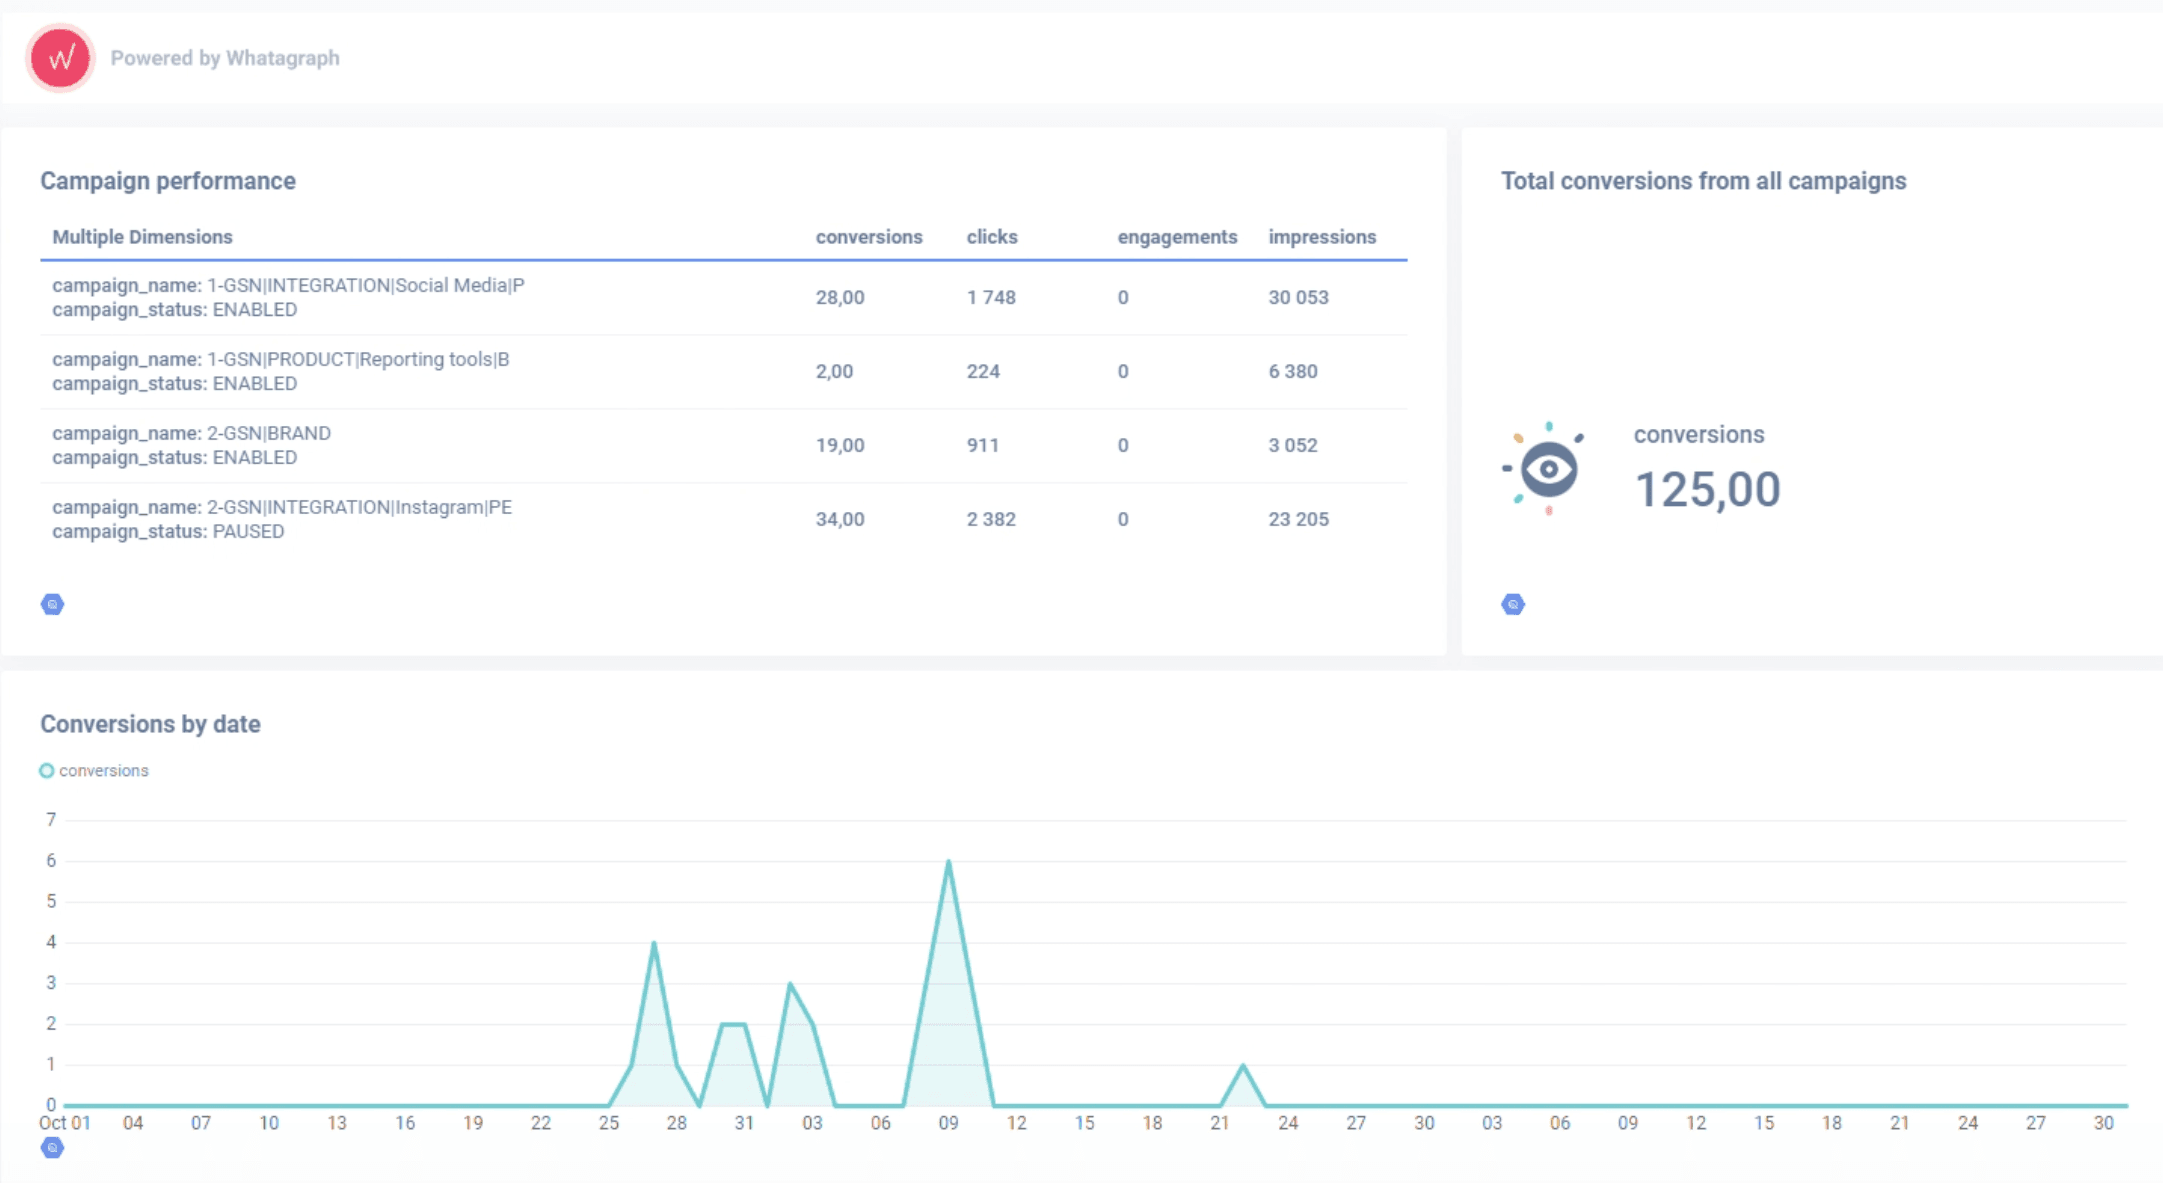
BigQuery BI Engine is a fast, in-memory analysis service that lets users create rich, interactive dashboards and reports without sacrificing performance, scalability, security, and fresh data.
With a big data platform like BigQuery, analysis and business intelligence tools are essential for discovering insights from your data.
Apart from running queries in BigQuery, you can analyze your data with various analytics and business intelligence tools that integrate with BigQuery:
- Whatagraph — Offers interactive dashboards and visualizations of your BigQuery data. Just select an account, pick the sources, and start reporting.
- Looker Studio — After running a query, you can launch Google’s Looker Studio directly from BigQuery using the Google Cloud console. There you can create visualizations and examine the data yielded from the query. Useful for creating simple graphics, reports, and dashboards.
- Connected Sheets — BigQuery also allows you to launch Connected Sheets directly from the console. You can use Connected Sheets to run queries either on your request.
- Looker — Google’s enterprise-grade BI platform for BI, data applications, and embedded analytics. Looker works with many data storage solutions, including BigQuery, and it’s useful for advanced data analysis, predictive analysis, and custom data applications. It also lets you connect to transactional databases in other public clouds.
- Data Lineage — Lets users track how data moves through their system: where it comes from, where it goes, and what transformations it passes through.
4 types of data sources
BigQuery lets its users query these data source types:
1. Data stored in BigQuery — The data you load into BigQuery for analysis. You can also generate data by writing query results into a table.
2. External data — You can query various external data sources, like other Google Cloud storage services or database services (Cloud Spanner or Cloud SQL).
3. Multi-cloud data — You can query data from other public clouds, such as Amazon Web Services (AWS) or Azure.
4. Public datasets — If you don’t have your own data, you can tap into any of the datasets available in the public dataset marketplace.
How query jobs work
Actions that BigQuery runs on your demand to load, copy, query, and export data are called jobs.
When you use the Google Cloud console or the bq tool to perform any of these jobs, BigQuery automatically creates, schedules, and runs a job resource.
Since jobs can take a long time to complete, they run asynchronously and are often polled for their status.
Shorter actions, on the other hand, such as listing resources or getting metadata, don’t trigger a job resource.
Once you load your data into BigQuery, you can query the data using:
- Interactive query jobs — Default, interactive (on-demand) query jobs that BigQuery runs as soon as possible.
- Batch query jobs — On your behalf, BigQuery queues each batch query and starts the query when idle resources are available.
How to query raw data?
The data that comes into BigQuery is raw, hit-level data. In contrast, Google Analytics has a different export schema — its data is session-based and aggregated, which is suitable for tracking simple marketing questions.
For example, in Google Analytics, you can easily count the number of sessions from a mobile device.
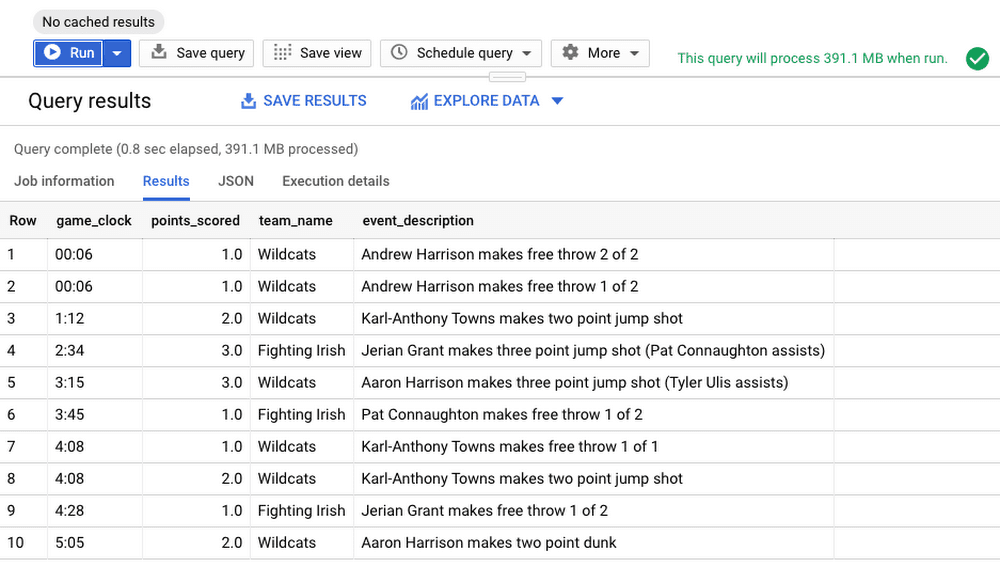
On the other hand, if you need to count the number of video play events across multiple sessions by a specific user, that would be much more challenging to answer.
That is where BigQuery comes in. Analysts can use the same underlying data as in Google Analytics but have much more customization at their disposal.
Benefits of Google BigQuery vs. Google Analytics
No sampling
Sampling is one of the most important limitations of the Google Analytics interface. You can see that when running a complicated or customized report or selecting a large data range.
In those cases, Google extrapolates the data by counting some of it and modeling the rest. In some cases, the resulting data is just an approximation.
BigQuery, on the other hand, provides a petabyte-scale database, so there’s no need to worry about sampling. Every hit is sent to BigQuery daily and available to query with results in seconds.
Focus on users, not sessions
Goals and goal funnels in Universal Analytics are session-based. This means you need multiple visits to complete a task. Google Analytics 4 and other event-based analytics tools like Firebase Data have started reducing the session concept to show different attribution views. Still, a BigQuery project could always analyze at the user level.
You can also attribute actions to any duration — from one hit before conversions to as far back as you track your historical data.
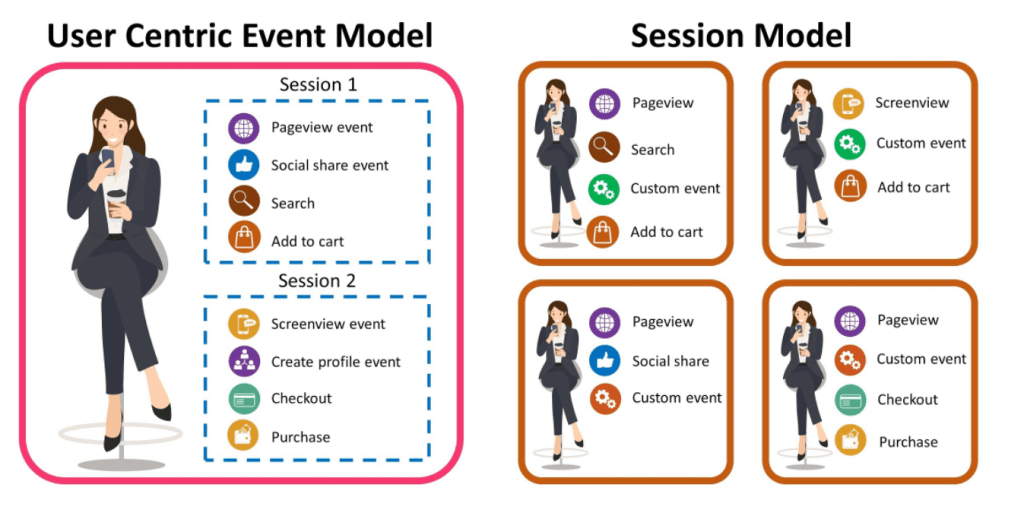
This is excellent news for eCommerce-focused companies because, in a real-world scenario, a person might add an item to their cart in one visit and want to complete the purchase in another visit.
BigQuery allows teams to see purchasing behavior from customers who take more than one session to hit the Pay button.
Combined dimensions
When analyzing database tables in BigQuery, users can query as many columns as they like. This means there’s no need to worry about interface limits. If you want 30 dimensions in the report, you can have them.
Analysts can also combine different scopes that are difficult to analyze in the Google Analytics interface. For example, you can combine eCommerce data with user-level data to see product interactions by user types.
However, if you want to mix different data streams, keep in mind that breaking down Google Analytics data and building it back up can:
- Introduce errors or miscalculations
- Cause the metrics to have different definitions than what is calculated in the standard data model.
Solve issues in hindsight
Google Analytics has a specific way of processing data and configuration settings. As it collects data from a business website or app, Google Analytics applies those settings and stores the finished, altered data for later reporting.
The problem with this is that you can’t go backward and change data in a Google Analytics account.
But with BigQuery, you can literally rewrite history. If your team has made an error in the past, you can dynamically optimize past queries in BigQuery to solve those issues.
BigQuery cost and value
Since BigQuery is a managed, serverless warehouse, you only pay for the data and features you use when you use them. The pricing generally boils down to charges for
Storage: Roughly, a website with 10 million hits per month could pay $3 to store 1 year’s worth of data.
Querying: Users pay per terabyte of data queried from the database. Since most businesses don't use more than a terabyte per month, the querying costs will remain in the single digits for most average users.
If you’re not sure if BigQuery is for you, you can try BigQuery Sandbox and explore all the use cases free of charge.
Wrapping up
BigQuery offers seamless data connectors into marketing platforms like Google Ads for a holistic view of your business. BigQuery also supports descriptive and predictive analytics. You can use the Google Cloud console to query your data directly to answer a statistical question. On the other hand, if you want to explore BigQuery data visually for trends and anomalies, you can use Whatagraph.
If you’re looking for an easy-to-use solution to connect data from various marketing sources, keep your marketing data safe, or want to visualize your BigQuery data, book a demo call and find out how Whatagraph can help.
Published on Jan 18 2023
WRITTEN BY
Nikola GemesNikola is a content marketer at Whatagraph with extensive writing experience in SaaS and tech niches. With a background in content management apps and composable architectures, it's his job to educate readers about the latest developments in the world of marketing data, data warehousing, headless architectures, and federated content platforms.