


















What is marketing reporting software?
Marketing reporting software is a platform that pulls performance data from your marketing channels, like Google Ads, Meta Ads, GA4, SEO tools and your CRM, into one place and turns it into reports and dashboards you can share with clients or leadership.
Instead of exporting numbers from each platform into spreadsheets and rebuilding the same report every month, the software keeps the data up to date and sends reports on a schedule.
Most marketing reporting tools cover four steps:
- Connect. Pull data from each marketing platform through native integrations.
- Organize. Blend sources and standardize metric and campaign names so the numbers match across channels.
- Visualize. Build reports and dashboards with charts, tables and written performance summaries.
- Share. Send reports by email on a schedule, or share live links clients can open anytime.
Many tools now add AI on top, from written summaries to agents that build and update reports. How deep that AI goes is one of the main differences between tools, which we cover below.
How to choose marketing reporting software?
Based on our 10 years of experience being in the marketing reporting and analytics space, here are the features of effective marketing reporting software:
#1. Integrations breadth and stability
If your cross-channel reporting tool doesn’t integrate with the channels you use daily, it’s useless. And if those integrations are fragile, you’ll spend more time baby-sitting connectors than analyzing results.
Many online marketing reporting tools rely on third-party connectors, which are notorious for breaking frequently. And when they break, your reports show inaccurate data, which isn’t ideal for client reporting.
In fact, Tanja Keglić, Performance Marketing Manager at Achtzehn Grad, knew this pain all too well. The team was using a combination of Looker Studio and Supermetrics, a third-party connector.
But Supermetrics connectors frequently broke, sources failed to load properly, and Tanja had to either waste time fixing them herself or contact Support for help.
Tanja told us:
It’s such a pain to reconnect a lot of sources and accounts—and it takes so much time, which you don’t have when you want a quick report.
This is why having stable, native integrations matter. And that’s what Whatagraph offers. You’ll get:
- 60+ native integrations: Connect to ads, social, SEO, email, ecommerce, and more—no third-party tools needed. Some examples include:
- Paid-per-click (PPC): Google Ads, Facebook Ads, TikTok Ads
- Social media platforms: Facebook, YouTube, LinkedIn
- SEO: Ahrefs, Google Search Console, Semrush
- Email marketing: Activecampaign, Constant Contact, Klaviyo
- CRM: HubSpot, Salesforce, GoHighLevel
- Analytics: Google Analytics 4, AppsFlyer, Adobe Analytics
- Built and maintained in-house: Our engineers manage every integration directly, so you don’t deal with fragile connectors.
- Custom data available: Have a unique source? You can build custom API integrations with agents to any platform you want in minutes.
- IQ-powered data blending: Unify and compare metrics across platforms without coding so “clicks” mean the same thing everywhere.
Whatagraph’s integrations are also built and maintained in-house by our engineers, making them seamless and stable. This also means you don’t need to babysit them, we do it for you.
Whatagraph platform as a whole has a 99.95% uptime and system-wide outages are very rare. If something does happen, there’s an 24/7 emergency alert that notifies our engineers (no matter what time it is) so they can quickly get on it.
When Tanja switched to Whatagraph from Looker Studio and Supermetrics, the biggest win she saw was stability and speed.
We don’t have any connection issues on Whatagraph at all. We just connected the platforms once, and that was it. Whatagraph is very, very quick when loading the data.
#2. Semantic data layer
Marketers make decisions based on numbers, but if those numbers aren’t accurate, every decision is built on shaky ground.
Many digital marketing reporting tools pass data through multiple connectors, spreadsheets, and dashboards, leaving plenty of room for errors and inconsistencies.
Kim Strickland experienced this first-hand while relying on Looker Studio and Supermetrics. Reports were confusing, data tracking flaws slipped through, and clients were left questioning the numbers. As she explained:
Looker Studio was slow and always breaking. The data wouldn’t pull through, or it would pull through incorrectly. It was just time consuming, frustrating, and a constant guessing game.
If clients can’t trust your numbers—or if you spend hours defending them—you lose credibility, momentum, and growth opportunities.
A semantic data layer, or a governed data foundation, is the difference between accurate numbers on reports and AI tools and hallucinated ones.
Metrics like blended ROAS or CPL should be defined once and calculated the same way in every report, dashboard, and AI answer, so two people on your team never pull two different numbers for the same client.
In Whatagraph, you can:
- Define metrics like what a conversion means to you
- Create custom metrics based on your business like how ROAS is calculated
- Blend data from different channels like GA4 and Google Ads
- Consolidate data from similar channels into one source like Google Ads and Meta Ads
- Standardize dimensions like dates, campaign names, campaign IDs, and more
You can either build this with agents using natural language prompts or build your own.
#3. Depth of AI capabilities
Every marketing reporting software in 2026 has AI, but they’re not all equal.
Some tools only write a summary on top of a finished report, while others can build reports, answer client questions, and flag problems using the same data your reports run on.
A summary on its own doesn’t save much time. The hours go into everything around the report: pulling the data, checking accounts before the client does, and answering follow-up questions after the report goes out.
It also matters what data the AI works from. An AI tool that reads raw numbers straight from each platform’s API doesn’t know your metric definitions, so it can tell a client one ROAS while their report shows another.
Whatagraph IQ Agents work from the same governed data layer as your reports, so the numbers an agent gives you match the numbers your clients see. With agents, you can:
- Answer ad hoc questions. Ask an agent about any client’s performance and get the first pass of the analysis in minutes.
- Draft report commentary. Agents write the first draft of wins, watchouts, and recommendations in your brand’s tone, and your team reviews it before it goes out.
- Monitor accounts and budgets. Agents check campaigns, tracking, and ad spend against budget on a schedule you set, then send digests to Slack or email.
- Analyze ad creatives. Agents audit creative performance across every client account on a schedule.
- Work inside your other tools. Through MCP, you can run the same agents from Claude and ChatGPT, and agents can act in tools like Slack, HubSpot, and Asana.
- Keep humans in the loop. You decide what each agent can do on its own and what it has to ask you first. Agents belong to the team, so anyone can run one when its creator is away.
GKV’s analytics team uses agents for the ad hoc analysis that used to take hours. When Google Ads changed how it optimizes target CPA campaigns, Anna Alexiadi Smyrniotaki asked her client agent which clients were affected. A few minutes later, she had the answer and sent it to the client team.
Anna told us:
It’s one of those tasks that would have taken me a couple of hours, but because I have the agents, I can just ask the question and see what comes up.
#4. Report ease of creation, accuracy, stability, and automation
Most online marketing reporting tools aren’t built for marketers, they’re built for data teams. Even with “easy” reporting tools, you still need to:
❌ Wrangle with data connectors
❌ Know basic coding or SQL to clean data
❌ Spend hours building reporting dashboards using complicated controls
❌ Figure out settings to style reports
❌ Fix broken dashboards and connectors
Marketing agencies like Peak Seven struggled with this complexity. The team was using Looker Studio previously and even with templates, it took hours for Kim Strickland, Digital Marketing Specialist, to manually customize tables, widgets, and layouts. Kim said:
The first report I created on Looker Studio took me 40 hours. It’s just not a very user-friendly system.
If a platform requires coding, complex setup, or a steep learning curve, it won’t get adopted across your team, and your reporting will remain a bottleneck.
That’s why ease of use matters when choosing reporting software.
With Whatagraph IQ Agents, reporting is genuinely easy for every marketer:
- Build reports with a single prompt. Ask agents to generate complete reports with widgets, charts, and graphs and write the first draft of commentary based on your connected data, past reports, and brand style.
- Bulk edit reports. Add new metrics, swap out deprecated ones, change dates, apply new branding style across all your reports, whether you have 10 or 100, in seconds.
- Style automatically. Upload a logo or brandbook, and agents apply matching fonts, colors, and layouts to your reports immediately.
All of this means marketers don’t have to act like data analysts anymore. Reports are created, explained, styled, and shared in seconds—so you can spend your time on strategy, not setup.
André Cardoso, Project and Performance Marketing Manager at Wise Pirates, raved:
Whatagraph is really simple to use, intuitive, and perfect for marketing teams with limited technical knowledge.
Whatagraph also supports automated report scheduling. You can do it in three ways:
- Schedule with agents. Get agents to create reports on a schedule (e.g. monthly), send it to you for review, and then once you’ve tweaked and confirmed, send the report to clients via email or Slack.
- Schedule it yourself. For each report, you can also set custom schedules within Whatagraph platform with white-labeled email domains, custom subject lines and text.
- Send live links or HTML artifacts. You can also send live links of Whatagraph reports to clients directly, or create HTML artifacts and share them. Both report and artifact links can be password-protected for that extra security.
#5. Data security
When you’re handling client or company data, security isn’t optional.
Marketing data includes budgets, performance metrics, and customer insights, and even a small leak can damage trust permanently. Too many reporting platforms overlook this, leaving gaps in access controls, uptime monitoring, or compliance.
Agencies and in-house teams alike know how sensitive this issue is. Clients demand not only accurate reporting, but also confidence that their data is safe, compliant, and available whenever they need it. If your reporting tool can’t guarantee that, the risk outweighs any convenience.
Whatagraph takes security seriously at every level:
- Single Sign-On (SSO). Available on advanced plans, SSO keeps user access centralized and secure, reducing the risks of shared logins or weak passwords.
- GDPR compliant, All data is processed under strict GDPR regulations, so you and your clients stay compliant automatically.
- Data hosting & encryption. Marketing data is encrypted in transit and at rest, and securely hosted in EU-based servers with strict access controls.
- ISO 27001 certified. Whatagraph follows international best practices for information security management, with strict policies for data protection, risk management, and compliance.
- For agents, no data is uploaded to external AI tools like ChatGPT or Claude, and it’s never used to train AI models.
For agencies, this means peace of mind when handling multiple client accounts. For in-house teams, it means you can connect, store, and report on sensitive marketing data without exposing it to unnecessary risk.
#6. Scalability
Reporting for one brand is tough enough. But as soon as you’re managing multiple clients, markets, or thousands of data sources, the complexity multiplies.
Most digital marketing reporting platforms don’t scale gracefully. Reports are capped at a certain number of sources, connectors break, dashboards get messy, and keeping everything consistent across clients becomes a full-time job.
This was the exact problem the Rentable team faced with a reporting solution they were previously using.
They had a total of 5,000+ Google My Business data sources, and they needed to visualize 700+ sources in one report – but the tool was capped at 100 per report.
This meant their team had to create 7 different reports, which was time-consuming and frustrating.
Danielle Roberts, Director of Implementation & Support at Rentable, told us:
As we scaled, our reporting needs became more complex. We needed a tool that could grow with us and make reporting more efficient.
That’s why scalability matters when choosing your marketing agency reporting tool. If your platform can’t handle hundreds—or even thousands—of clients, brands, or data sources, it will hold your team back.
Rentable found a solution in Whatagraph, which doesn’t cap them on the amount of data sources they can add to a single report. Danielle said:
Whatagraph lets us pull in all the data we need, fit hundreds of locations in one report, and break it down exactly how our customers want.
To speed up report creation, the team has built out a library of report templates, usually a full portfolio view or a location-specific version.
When they onboard a new customer, they choose an appropriate report template and switch out the data sources. That means no more rebuilding reports from scratch, and no more unnecessary manual steps.
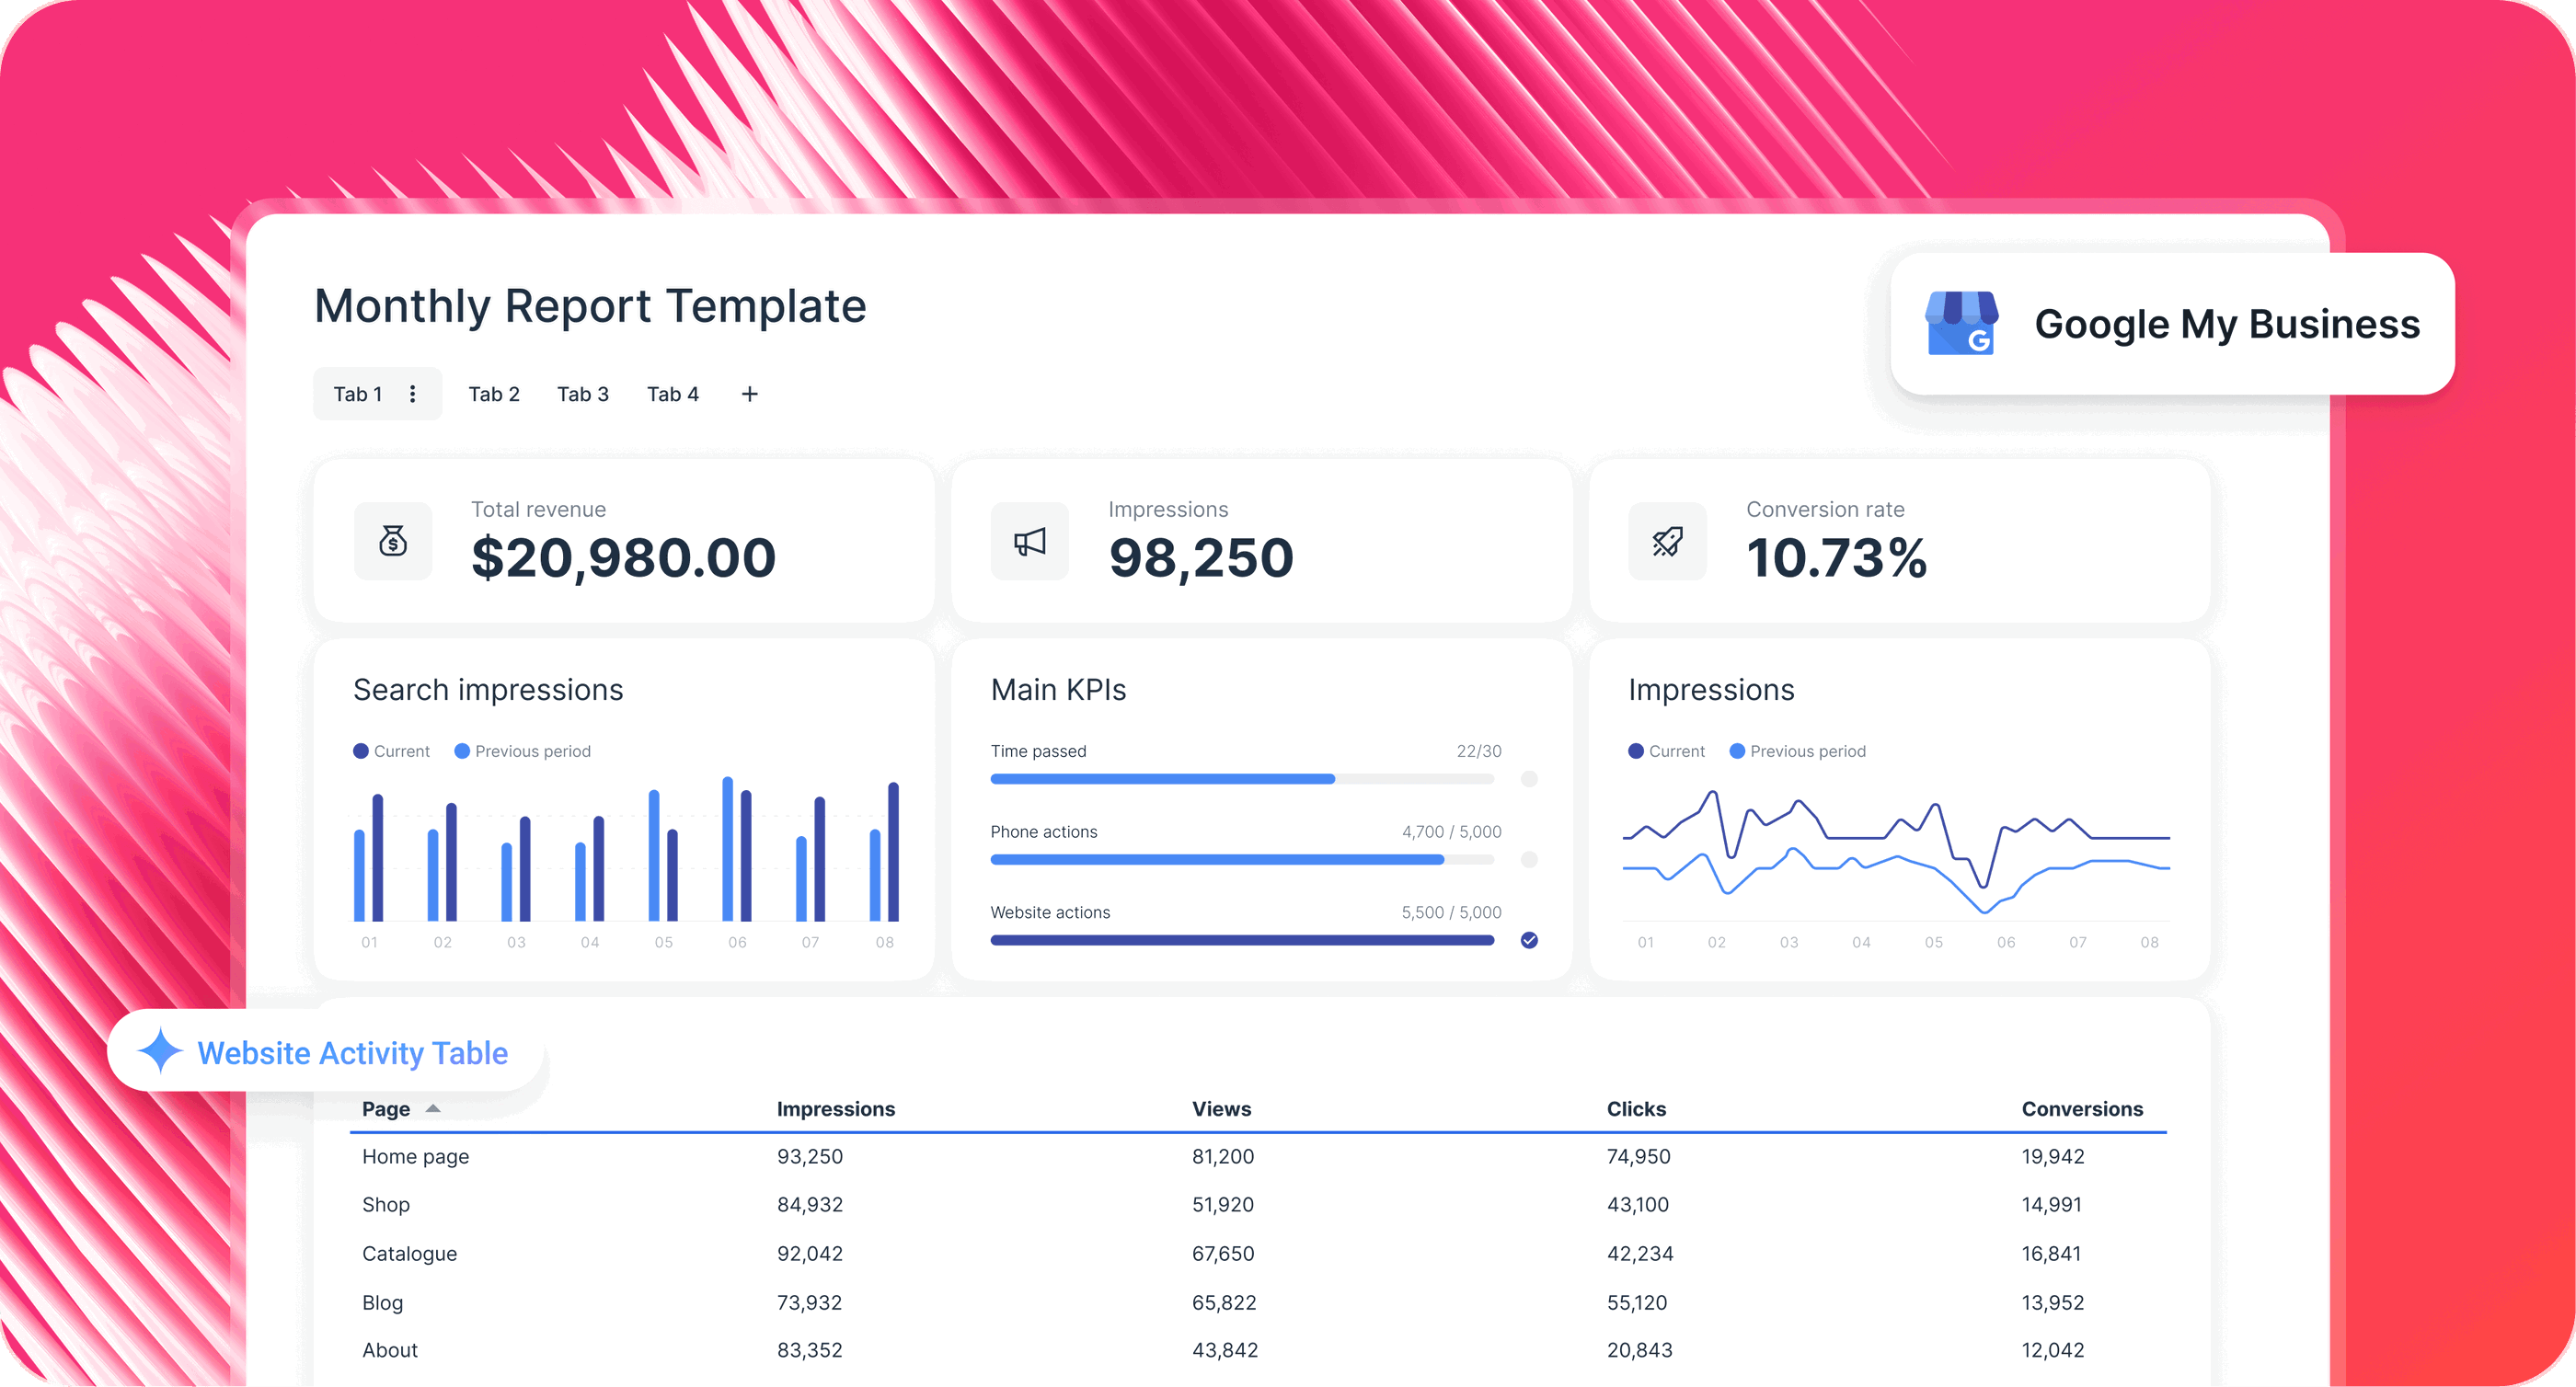
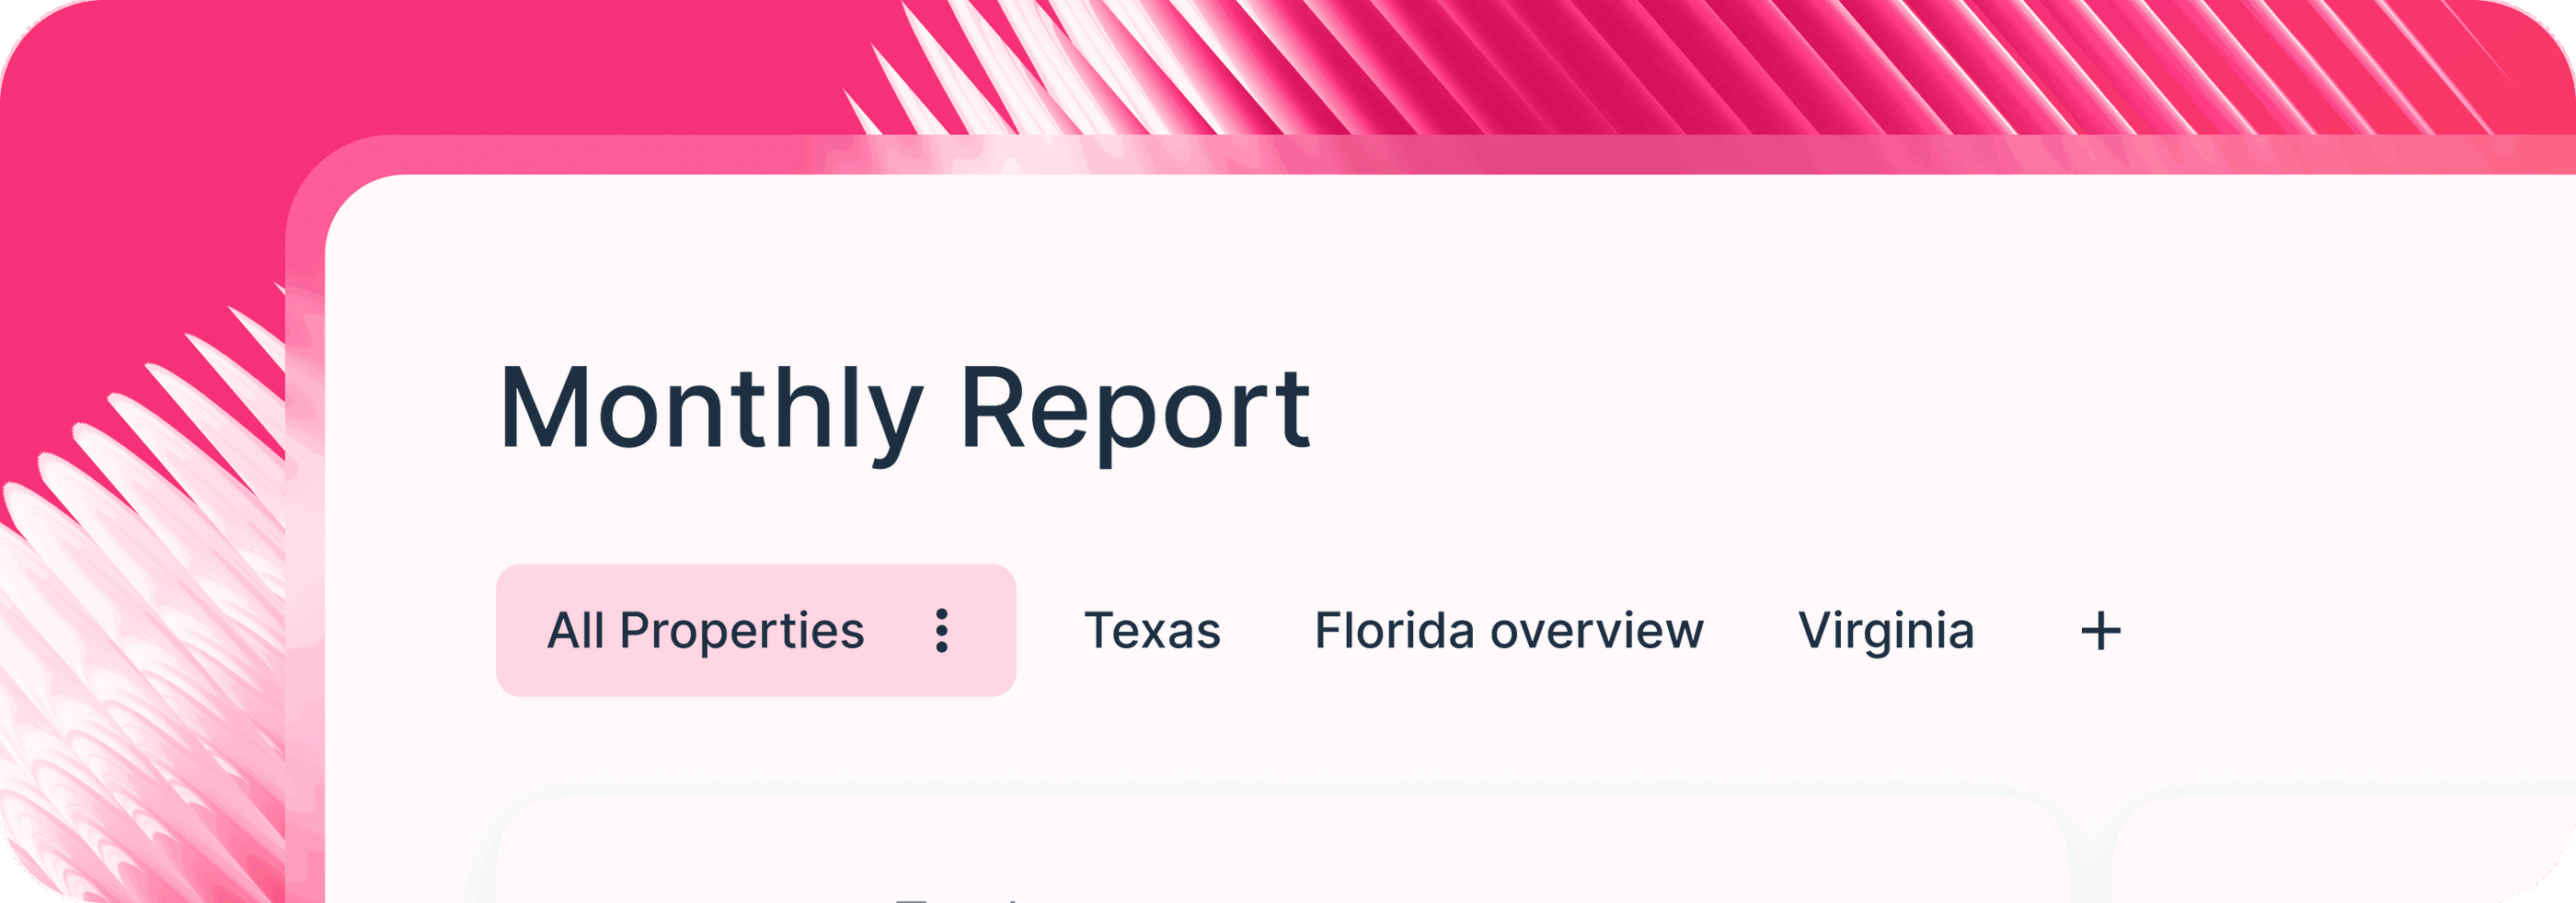
Within each report, Danielle’s team uses tabs to break down performance by property, state, city, or onboarding date according to the customer's needs.
These tabs make it easy to tailor the experience without duplicating work. For example, if a customer wants to see only properties in Texas or New York City, the team creates tabs that filter by location, while still keeping a full overview in an “All Properties” tab.
On top of templates and tabs, Whatagraph also comes with:
- Spaces for organization: Group reports, dashboards, and integrations into folders your team can easily access.
- Linked templates: Update once and roll changes out across every client report.
- Custom tags: Organize sources by industry, region, account manager, or client name, and filter performance at any level without messy workarounds.
- Source groups: Combine multiple data sources into a single group to report on them together and aggregate metrics seamlessly.
- Global themes: Apply branding at scale so every report is white-labeled in seconds.
Plus, with Whatagraph IQ Agents, you can onboard new clients in seconds, not hours.
A UK PPC agency does this by just prompting details like client URL, Google Ads ID, account manager, and assigned folder name.
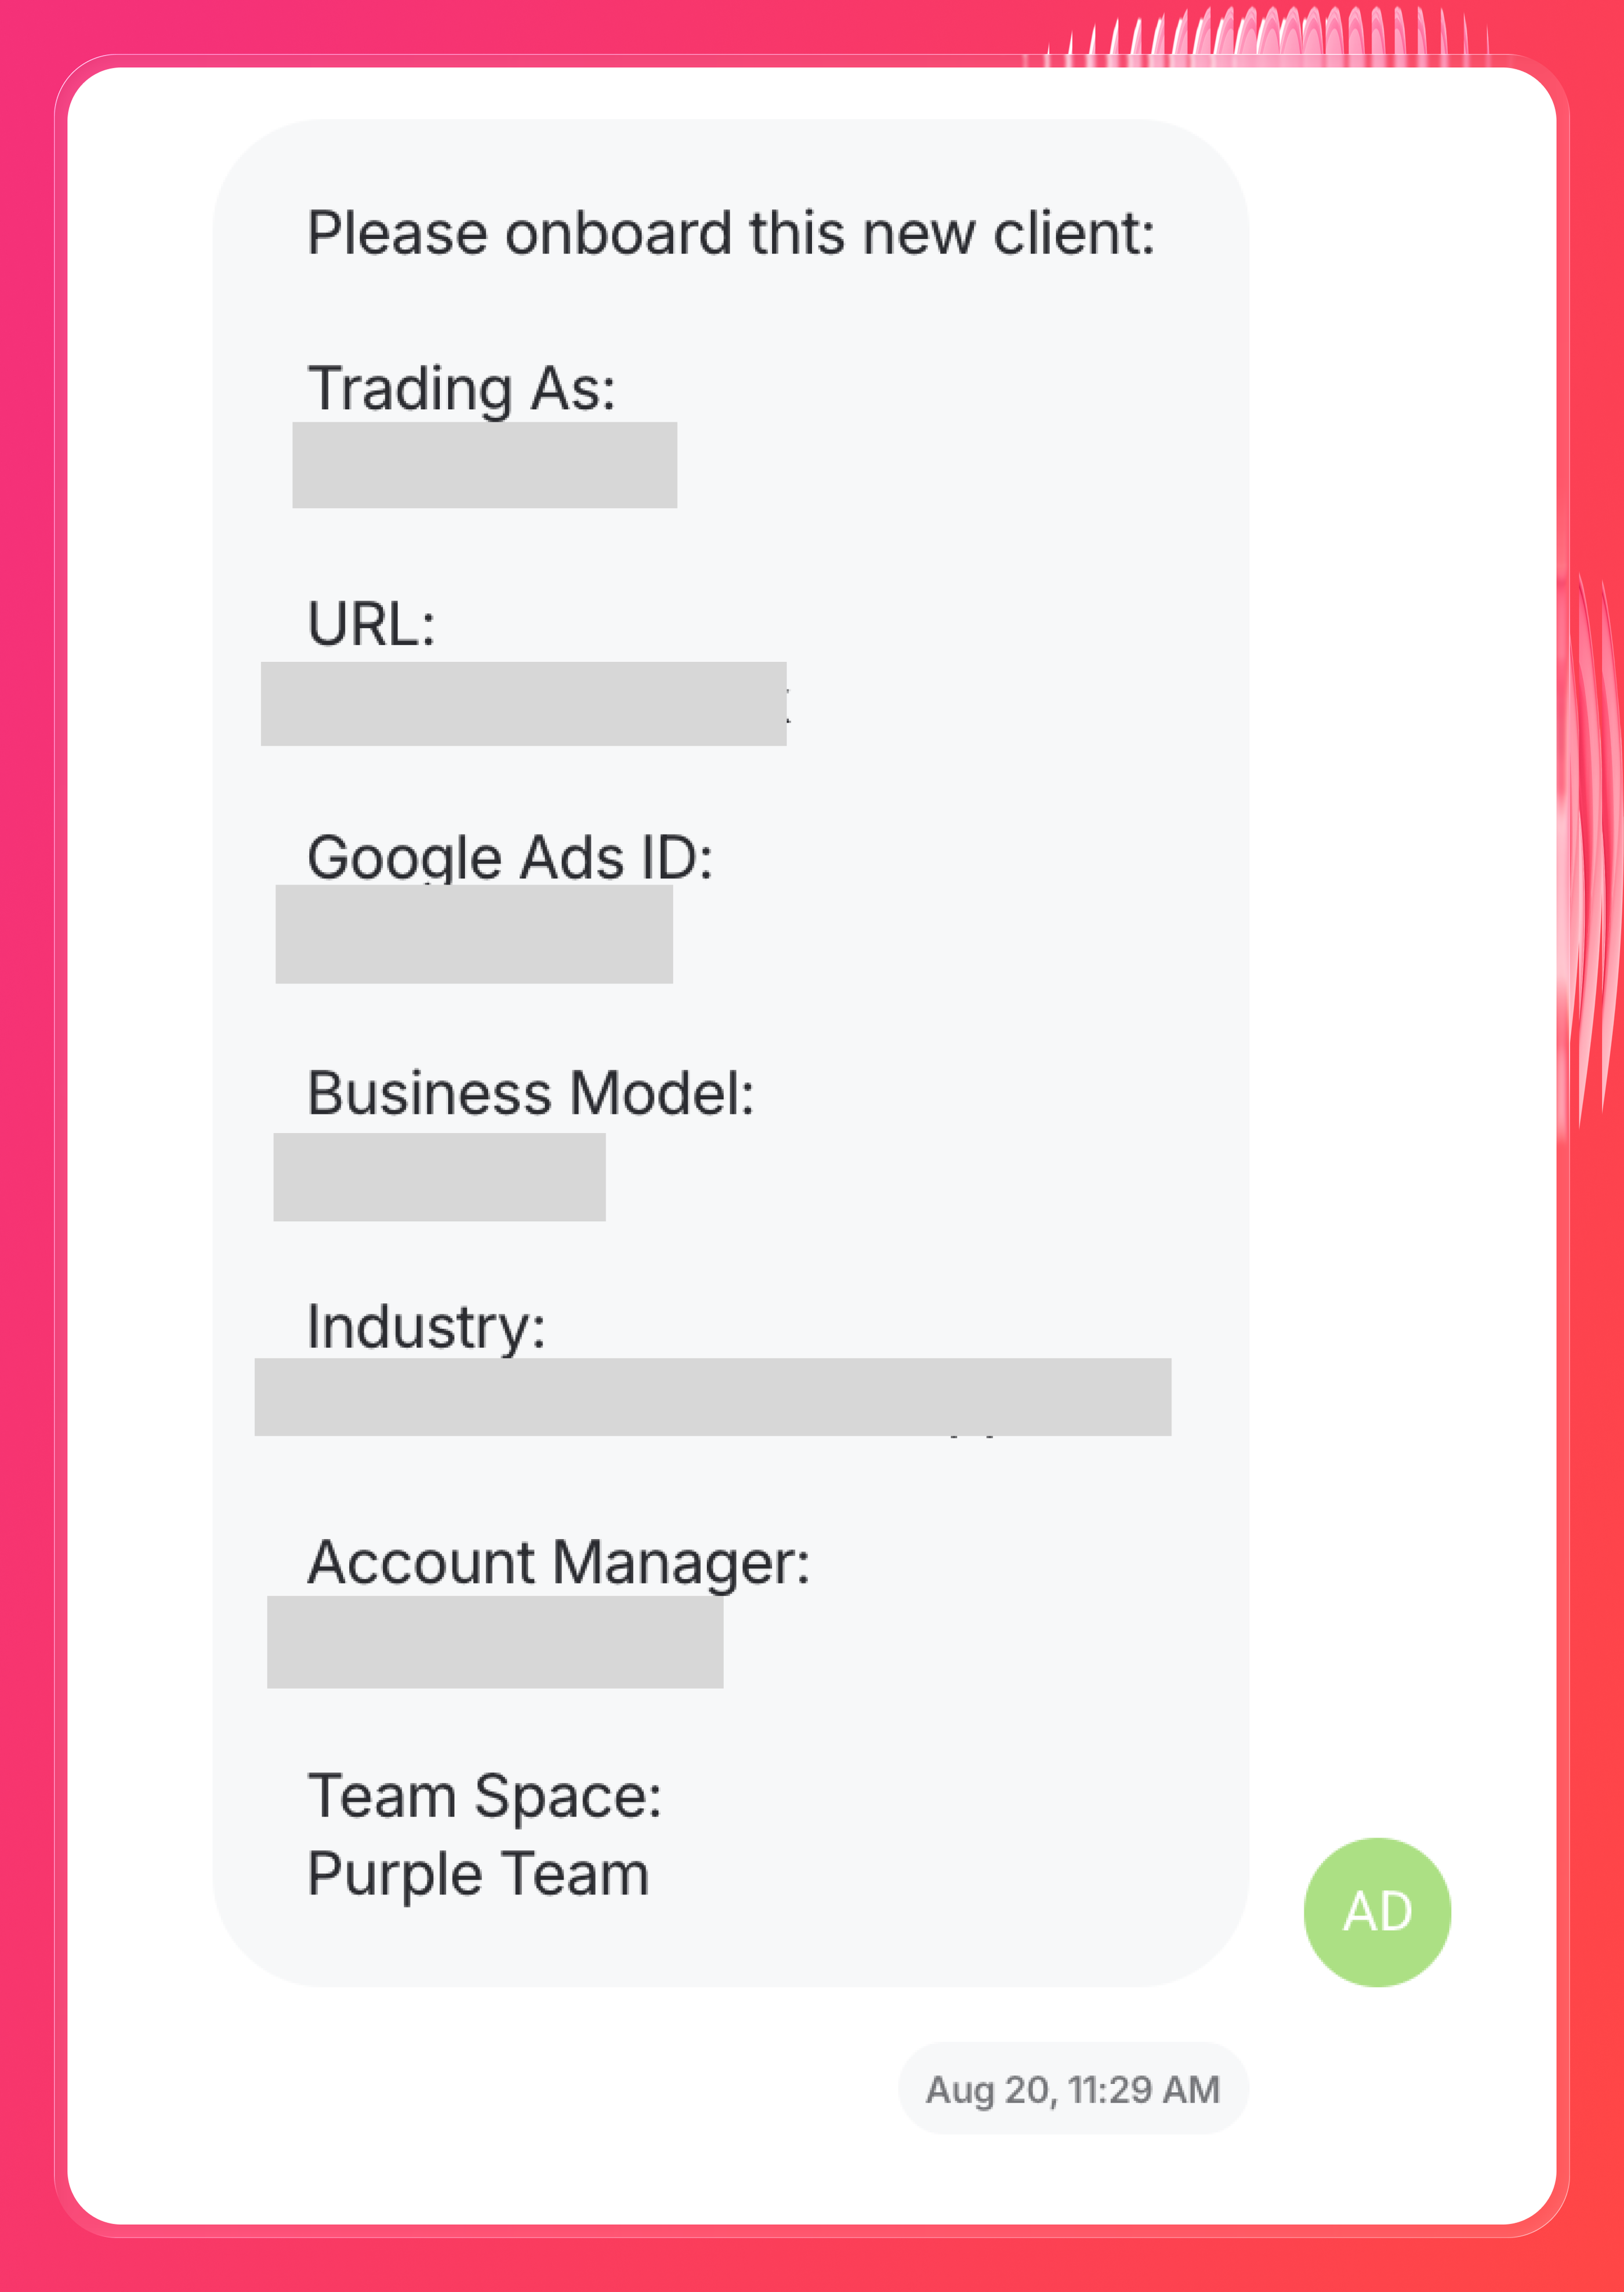
In about two minutes, the agent connected the client’s source from their ad account manager, applied the tags including the industry tag, built the report from the agency’s own template, and put it in the right folder.
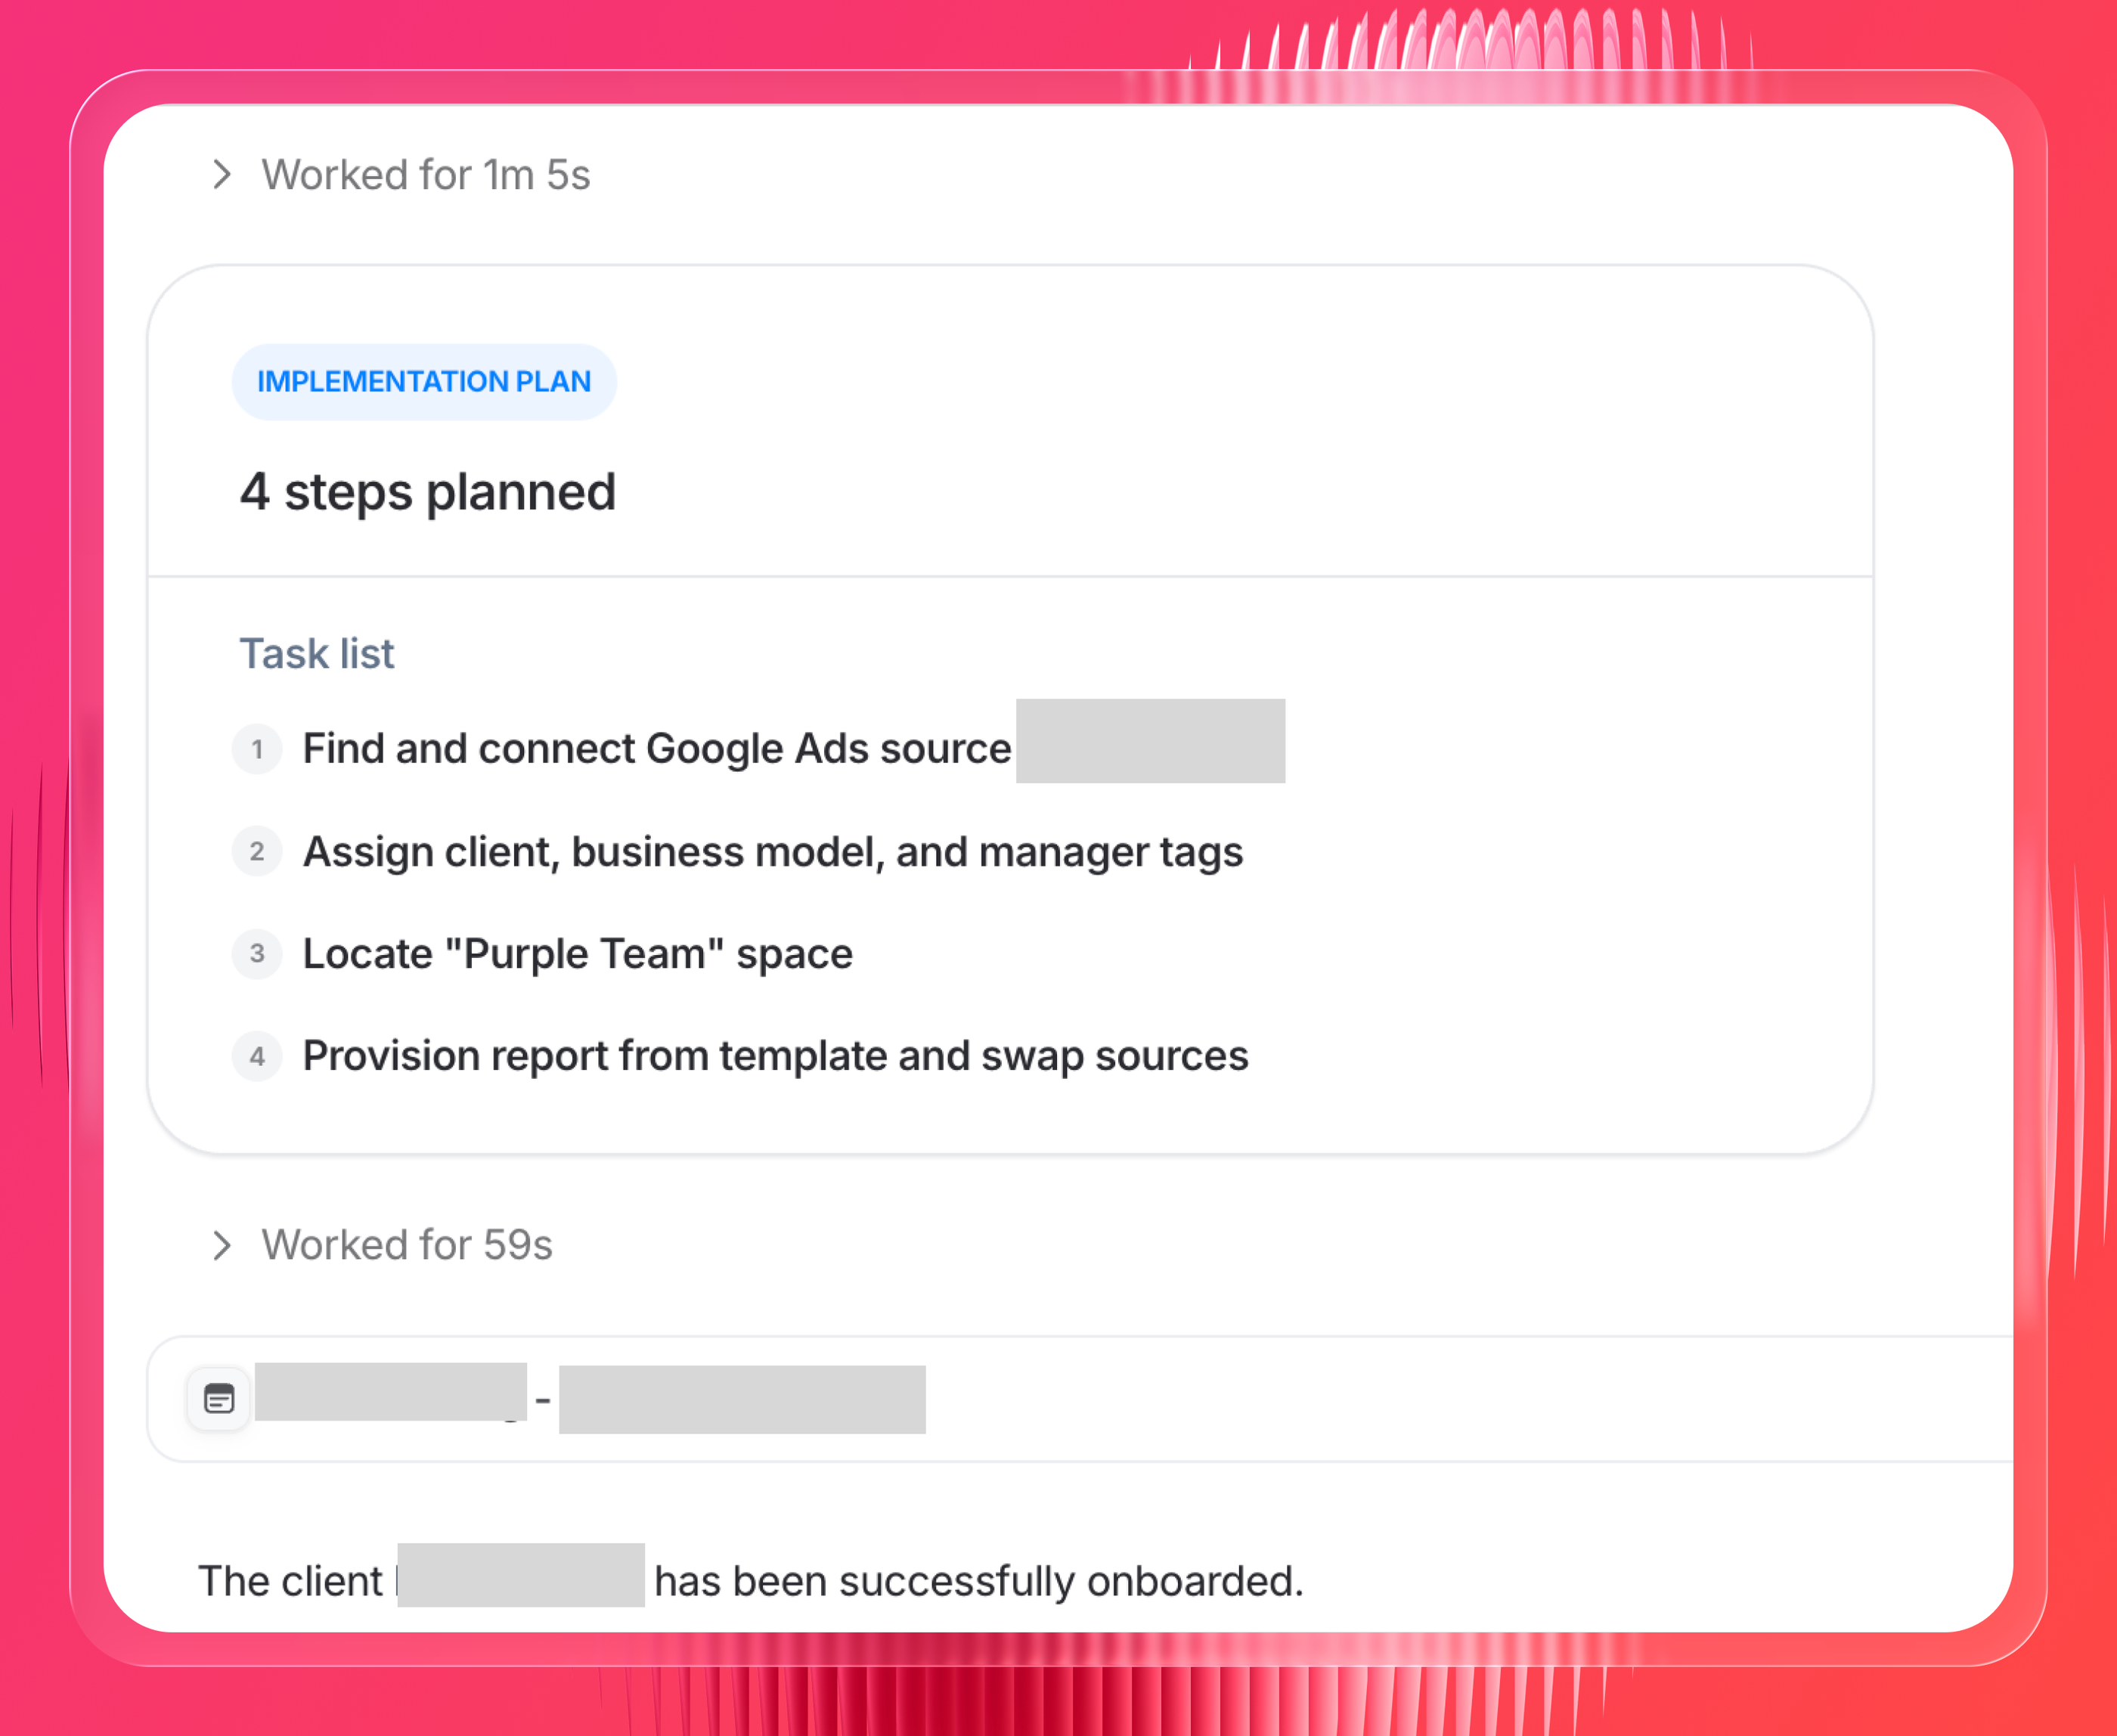
With Whatagraph, agencies and in-house teams can scale reporting from one brand to hundreds of clients or thousands of data sources, without breaking a sweat.
Case studies of successful marketing reporting implementations
We’ll share three case studies of marketing agencies and brands successfully implementing marketing reporting:
GKV
GKV is a communications agency working with paid media based in Baltimore, US.
Challenges: GKV’s two-person analytics team produces monthly reports for 12 clients, and each one took 10 to 15 hours. Reporting took up three weeks of every month, which left one week for analysis and recommendations.
Solution: Anna Alexiadi Smyrniotaki built an IQ Agent for each client that drafts the monthly report and commentary on a schedule, using the data GKV already had in Whatagraph. Her team reviews every draft, asks the agent to dig deeper, and signs it off before it goes to the client.
Results: 70+ hours back every month, 50% to 75% less time on standard monthly reporting, and reports for all 12 clients out in 1 to 2 weeks instead of 3 to 4.
IQ agents enable us to get started on monthly reporting from a rough draft of performance takeaways, so we can focus on curating deeper insights and more actionable recommendations.
Maatwerk Online
Maatwerk Online is a full-service digital agency in Rotterdam, Netherlands, with 28 specialists serving 100+ clients.
Challenges: The team reported with Supermetrics and Looker Studio. Dashboards were slow, connections broke, and reports were packed with metrics clients never used.
Solution: Maatwerk Online moved to Whatagraph and built four reusable templates that work for 90% of clients with minimal tweaks. Specialists use Whatagraph IQ to build widgets from a prompt and IQ Chat to answer client questions during meetings.
Results: 100+ hours saved on reporting every month, up to €4,000 a year saved after dropping Supermetrics, and reporting costs fully covered by licensing fees charged to clients.
Whatagraph’s AI saves time and energy for our marketing specialists. And the hours we’re saving is just pure profit.
Read the full Maatwerk Online case study
Rentable
Rentable is a real estate technology company in Madison, Wisconsin, that runs a nationwide rental marketplace and builds marketing tools for property managers.
Challenges: Rentable’s implementation and support teams manage 215 customer reports across 5,000+ Google Business data sources. As the customer base grew, they needed a tool that could handle large data sets in one report.
Solution: Whatagraph fits hundreds of locations in one report. The team built a library of report templates, uses tabs to break each report down by property, state or city, and gives customers a live link where they can ask IQ Chat questions.
Results: Reports with 200+ locations now take 20 to 30 minutes instead of 2 hours, saving 1.5 hours per report.
Whatagraph lets us pull in all the data we need, fit hundreds of locations in one report, and break it down exactly how our customers want.
Read the full Rentable case study
7 best marketing reporting tools
Here’s a short summary of seven popular marketing reporting tools. One of them is ours, so we used the same format for every tool.
Whatagraph
Whatagraph is a marketing intelligence platform with a governed cross-channel data layer, IQ Agents that draft reports and monitor accounts, and native exports to BigQuery and Looker Studio. Its entry price makes it a poor fit for solo consultants and agencies with fewer than 10 to 15 clients.
Best for: mid-to-large agencies and multi-location brands managing hundreds of data sources that need the same metric definitions in every report.
G2 rating: 4.5/5 (286 reviews)
“The initial setup was easier than expected, with a flexible onboarding schedule and instant connections to data, allowing us to quickly produce reports and create reusable templates across clients.” (G2 review)
AgencyAnalytics
AgencyAnalytics is a client reporting tool with 80+ marketing integrations, built-in SEO rank tracking and site audits, and a client portal. It lacks advanced cross-channel data modeling and data warehouse pipelines.
Best for: small to mid-sized SEO and local marketing agencies that want a simple setup without technical overhead.
G2 rating: 4.7/5 (454 reviews)
“Agency Analytics is the most straightforward reporting platform that I've ever used, which is perfect if you don't have a FTE that can support managing connectors, custom datasets, metrics, and creating templates.” (G2 review)
Databox
Databox is a KPI dashboard tool with a semantic layer, the Genie AI analyst for plain-language questions, and an MCP server for Claude and ChatGPT. Every plan caps the number of data sources you can connect.
Best for: performance agencies focused on KPI tracking, goal pacing and scorecards.
G2 rating: 4.4/5 (194 reviews)
“All data sources in one place makes it easy to access critical business metrics. No more searching for data in different platforms like your CRM, Google Analytics, or shopping cart.” (G2 review)
Looker Studio (or Data Studio)
Google’s free dashboard builder connects natively to GA4, Google Ads, Search Console and BigQuery. Non-Google sources like Meta Ads or LinkedIn Ads need a paid third-party connector, and large reports run into API quota errors.
Best for: solo marketers and small businesses that report mostly on Google channels and can manage connectors themselves.
G2 rating: 4.4/5 (476 reviews)
“Looker Studio helps create customized dashboards that enable cross-functional teams to extract meaningful insights and identify actionable opportunities.” (G2 review)
DashThis
DashThis is a dashboard tool with plug-and-play widgets, white-labeling and AI Insights that summarize performance in plain language. It has no granular team permissions and no data warehouse or SQL connections.
Best for: boutique agencies with 5 to 25 clients that want fast setup.
G2 rating: 4.7/5 (94 reviews)
“DashThis has made it incredibly easy to gather all of our analytics without having to do it individually by platform. The dashboards are beautiful and so easy to refine!” (G2 review)
Klipfolio
Klipfolio combines Klips, a formula-based dashboard builder, with PowerMetrics, a metric catalog with AI features and an MCP server. It has a steep learning curve, and entry plans refresh data every 1 to 4 hours.
Best for: technical analytics teams comfortable writing spreadsheet-style formulas.
G2 rating: 4.5/5 (257 reviews)
“It's very intuitive and the UI is clean. The integrations capabilities are nice.” (G2 review)
TapClicks
TapClicks is an enterprise marketing operations platform with 250+ connectors, data warehousing, AI insights agents and automated slide reports. It runs on sales-gated annual contracts and takes time to learn.
Best for: large media agencies and franchise brands managing high data volumes across many clients or locations.
G2 rating: 4.3/5 (336 reviews)
“The dashboards are really great for our clients and there's a lot of flexibility in the metrics we see.” (G2 review)
Here’s a more in-depth comparison of top marketing reporting platforms.
Which client reporting tool fits your agency or brand?
The right tool depends on your team size, the channels you report on, and how much setup you want to handle yourself.
- If you’re a mid-to-large agency or multi-location brand managing hundreds of data sources, and you need the same metric definitions in every report and AI answer, choose Whatagraph.
- If you’re a small to mid-sized SEO or local marketing agency that wants a simple setup with built-in rank tracking and site audits, choose AgencyAnalytics.
- If you’re a performance team focused on KPI tracking, goal pacing and scorecards, choose Databox.
- If you’re a solo marketer or small business reporting mostly on Google channels, and you can manage connectors yourself, choose Google Data Studio.
- If you’re a boutique agency with 5 to 25 clients that wants fast setup and white-labeled dashboards, choose DashThis.
- If you’re a technical analytics team comfortable writing spreadsheet-style formulas, choose Klipfolio.
- If you’re a large media agency or franchise brand managing high data volumes, and an annual enterprise contract works for you, choose TapClicks.
How to report on performance in digital marketing with Whatagraph
In Whatagraph, you can start tracking and reporting performance in four simple steps:
Step 1. Connect your data sources.
Start by connecting the digital marketing channels from which you want to pull data. You can do this in a few clicks.
If you want to connect data from a custom source or niche platform, you can build a custom integration easily using agents.
Step 2. Organize your data.
Once your data sources are connected, you can organize the data so it’s easy for your team and clients to digest.
Whatagraph’s no-code Organize workflow helps you:
- Create data blends from different sources
- Unify metric and dimension names
- Standardize campaign names
- Segment data by specific demographics or geographics
As a result, you get standardized, unified marketing dashboards that both your teammates and clients can easily understand. The benefits are:
- More comprehensive performance view
- Fewer data discrepancies
- Fewer questions from clients or your team about the data on reports
Step 3. Visualize the data.
Turning raw numbers into clear, actionable insights is often the hardest part of reporting. Most tools force you to drag widgets, manually style layouts, or spend hours formatting charts just to make data client-ready.
Get Whatagraph agents to create a white-labeled report from you based on your connected data sources and a report template or a previous report.
Instead of wrestling with widgets or formatting, you get ready-to-share reports that are accurate, professional, and customized for your audience, created in minutes, not hours.
Step 4. Share the reports.
The last step is to share your reports with your clients or team.
You can do this in Whatagraph in four main ways.
- Share report live links or HTML artifacts with anyone you’d like.
- Get agents to send white-labeled, automated emails at a regular interval (e.g. every week or month).
- Export as Excel, CSV, or PDFs.
- Turn reports into marketing decks so stakeholders can easily follow along and understand numbers.
You can also transfer data to BigQuery or push it to Looker Studio.
Get a demo of Whatagraph today.