Meet the Future of Marketing Intelligence: Whatagraph 3.0
Everyone expects marketers to be data scientists. We don’t.
And we’re proving that with Whatagraph 3.0—the easiest marketing intelligence platform powered by AI that connects your data, cleans it, and delivers instant, accurate insights.

Sep 09 2025●5 min read


Over the past 10 years of leading Whatagraph, I’ve talked to thousands of performance marketers, and one thing keeps coming up:
Marketers are expected to do the job of a data scientist, even when they’re not.
You’re expected to know how to:
❌ set up connectors
❌ troubleshoot ETL pipelines
❌ clean data
❌ build dashboards
…all on top of actually running campaigns and delivering results.
Even with all the “automated” reporting tools out there, this process is still manual and time-consuming, because you’re juggling a stack of disconnected tools:
- Third-party connectors like Supermetrics or Funnel to pull the data
- Spreadsheets or Looker Studio to build the visuals
- Data warehouses like BigQuery to store the data
And when one of these tools breaks—which it often does—you’re stuck fixing the issue yourself, or waiting around for different customer support teams.
Even when everything technically works, there’s still a bigger issue: can you actually trust the numbers?
When data passes through five different tools before it hits a dashboard, it’s hard to feel confident in what you’re looking at.
And if a client pushes back on a result, you’re left defending a system you didn’t build and can’t always validate.
All this sounds…overwhelming.
It’s about time this changes. And it is changing—with Whatagraph 3.0.
A journey back in time: the eras of marketing reporting
I’ve been leading Whatagraph since 2015, and within this decade I’ve noticed four distinct eras of how marketing reporting has evolved.
2010s: The Excel era
If you were running reports in the early 2010s, you probably remember the chaos. Data was pulled manually from ad platforms, copied into spreadsheets, and then stitched together column by column. It was slow, fragile, and full of errors.
2015: The connector era
Then came ETL tools like Supermetrics and Funnel.
Finally, data could move automatically from platforms into warehouses or dashboards. It was progress, but it still wasn’t simple.
Marketers had to learn schemas, tagging rules, and data transformations. Connectors broke, and setting things up required more technical skill than most teams had in-house.
2019: The drag-and-drop era
Next came self-serve BI dashboards.
Tools like Looker Studio promised that marketers could “just drag and drop” their way to insights.
And it was more user-friendly than coding or building dashboards yourself, but for complicated reports, you still needed a data scientist or analyst to step in.
Today: The instant intelligence era
With the rise of AI, marketers don’t need to wrangle with connectors, build reports, or unify campaign names manually anymore.
AI does all this for you and all you need to do is ask the questions you want to know about your data and get back actionable insights instantly.
This is what I call the era of “instant intelligence”.
And this is exactly the era Whatagraph 3.0 is built for.
Meet Whatagraph 3.0: the future of marketing intelligence
We built Whatagraph 3.0 with one main goal in mind—to let marketers be marketers, instead of data scientists.
Unlike legacy BI tools, third-party connectors, or data analyst-heavy workflows, Whatagraph takes care of all the heavy-lifting with AI so you can focus on what you do best.
I recorded a walkthrough of what Whatagraph 3.0 is all about here:
With Whatagraph 3.0, you get:
1. The easiest marketing intelligence platform built for marketers
Unlike complex business intelligence tools made for data teams, Whatagraph is designed specifically for performance marketers.
Every feature matches how marketers think, work, and report—so you can focus on running campaigns, not building dashboards.
You won’t need to know SQL, understand database structures, or even use report templates to visualize your data anymore.
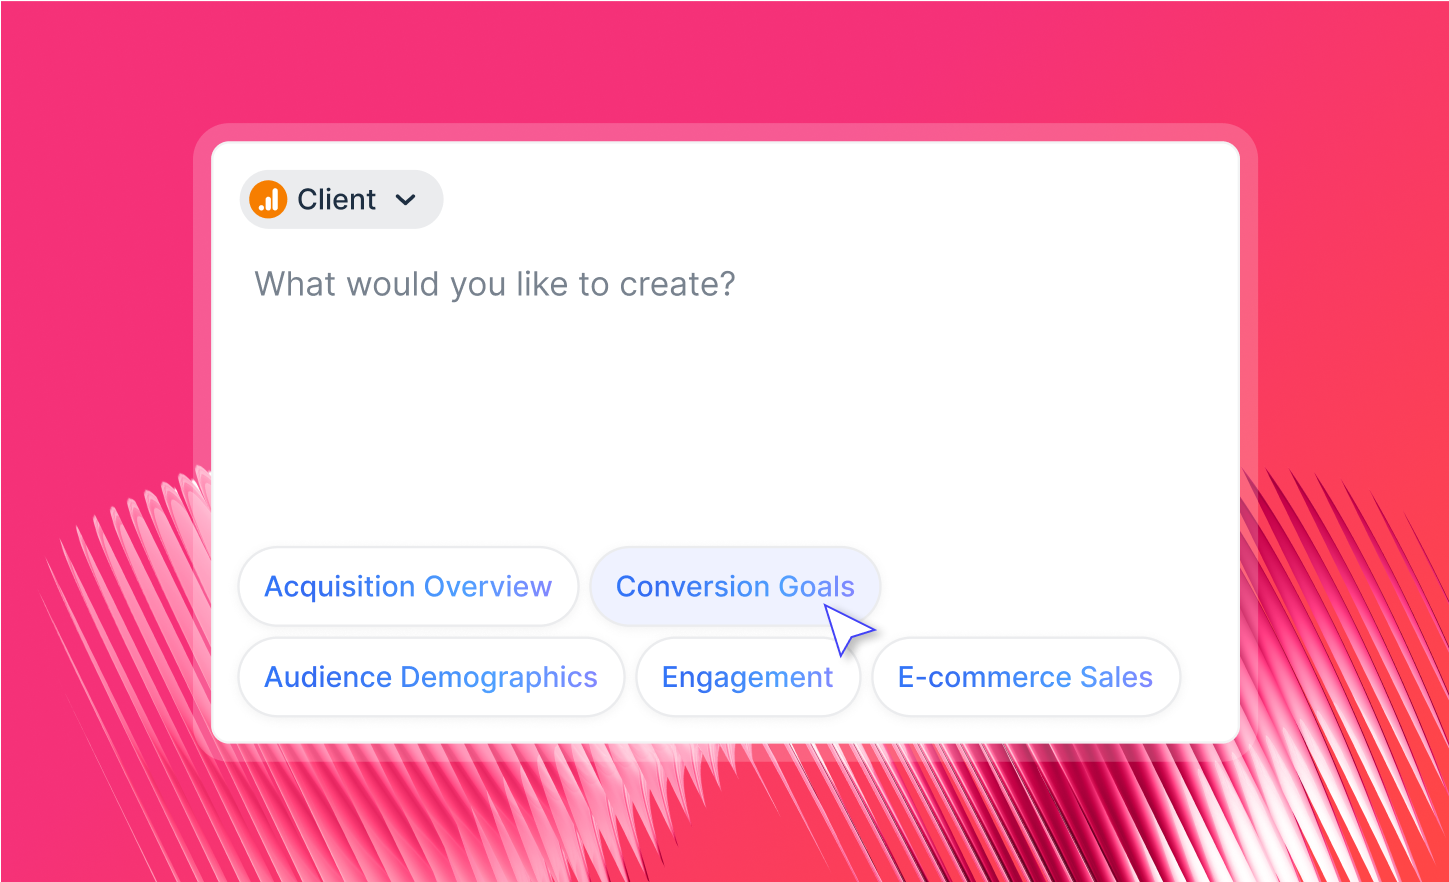
With Whatagraph IQ, the lifeblood of Whatagraph 3.0, all you need to do is connect your data sources, and tell us what kind of report you want to build, and we’ll build it for you—in seconds.
There are also example prompts available if you want something to get started with.
Want to edit or add more widgets? The same concept applies—just type in a prompt within a specific report, and we’ll handle it for you.
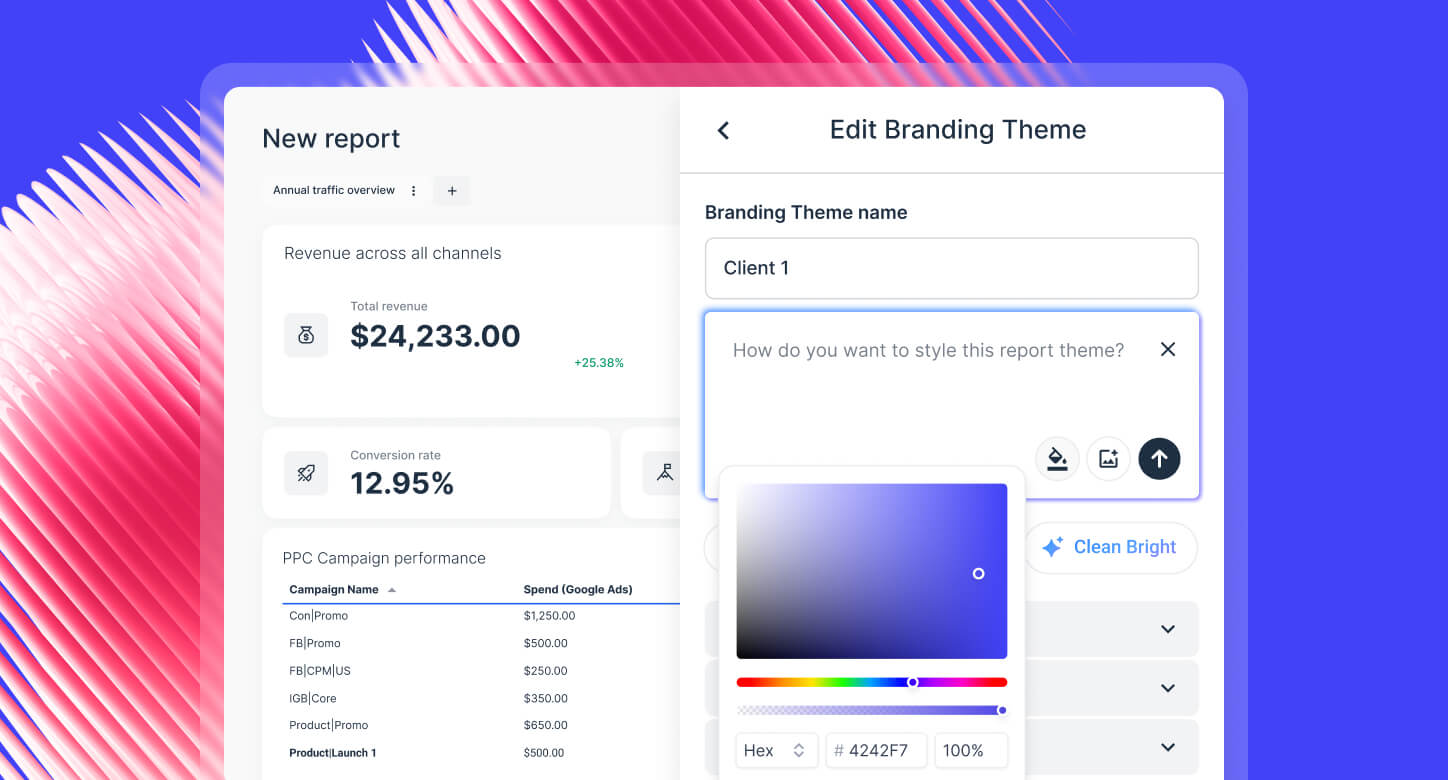
 When it comes to styling your reports, previously you’d have to manually adjust the settings. But now, you can simply:
- Upload a screenshot of your brandbook OR
- Type in a prompt (e.g. “Use the colors of the Batman movie”)
And Whatagraph will automatically detect the font and colors and apply them to your report.
With Whatagraph IQ+ (included in more advanced pricing plans), you can even get AI to create custom dimensions, blends, and metrics, again just by typing in prompts.
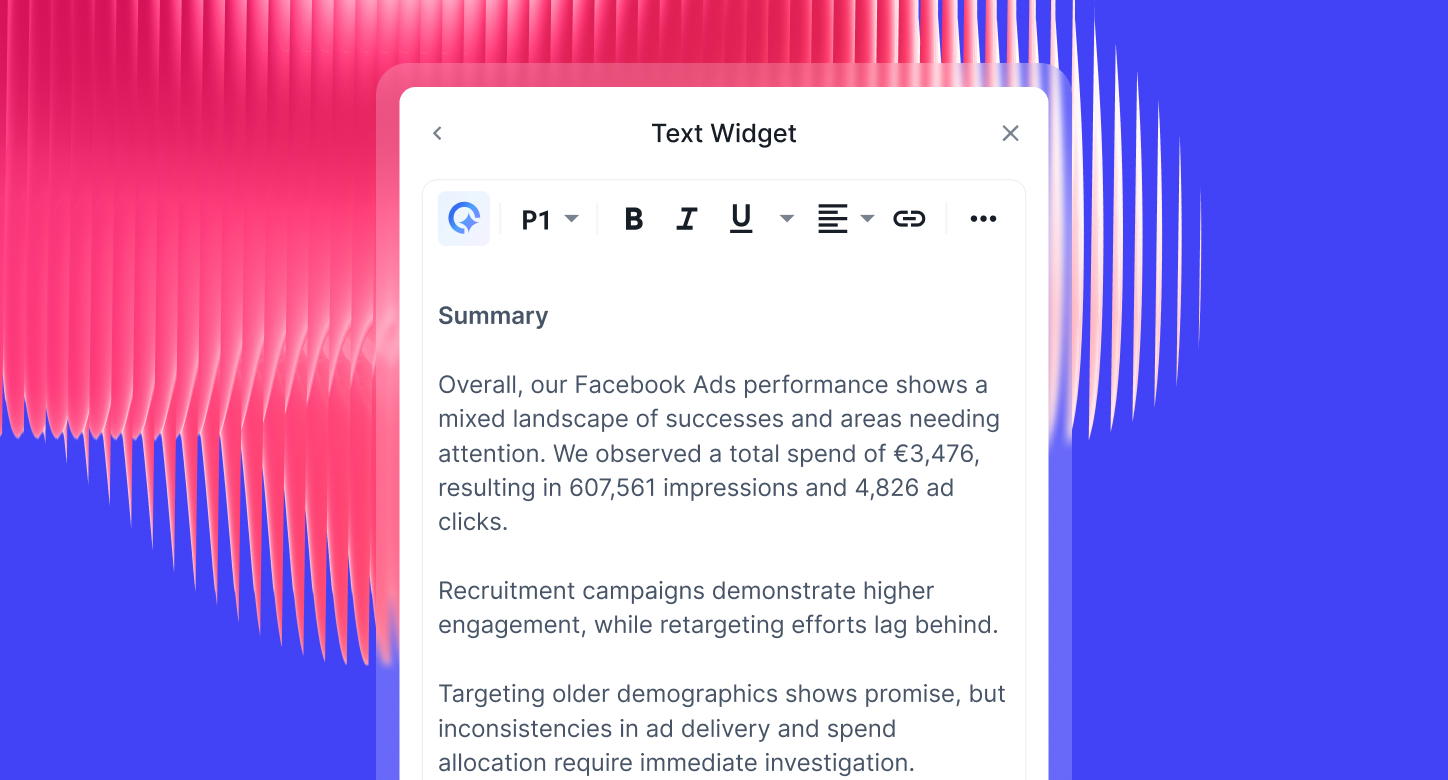
And when writing out performance summaries manually takes a lot of time for marketers, on Whatagraph, you can just ask AI to write it out in the format you want—Summary, Wins, Issues, Recommendations, or Custom—and in 18 different languages.
These summaries go directly in your report and are based on your data so there are no hallucinations.
All of this means:
✅ You can spend your time running campaigns and delivering results instead of babysitting data pipelines.
✅ You don’t have to rely on analysts or IT to set up, maintain, or “fix” your reports.
✅ You get a platform that’s intuitive enough for your whole team to use, without training sessions or steep learning curves.
Lars Maat, Co-founder of Maatwerk Online is already reaping the benefits. The agency automates reporting for their 100+ client base using Whatagraph and AI and they’re saving 100 hours a month.
He told us in this case study:
Whatagraph’s AI saves time and energy for our marketing specialists. And the hours we’re saving is just pure profit. We now have the time to focus on more strategic things that help both our agency and our clients grow.
2. The fastest path from data to insights
Our mission at Whatagraph has always been to enable digital marketers to make decisions—fast.
We’ve achieved this by automating the process of creating reports, but we’re elevating it even more with Whatagraph 3.0.
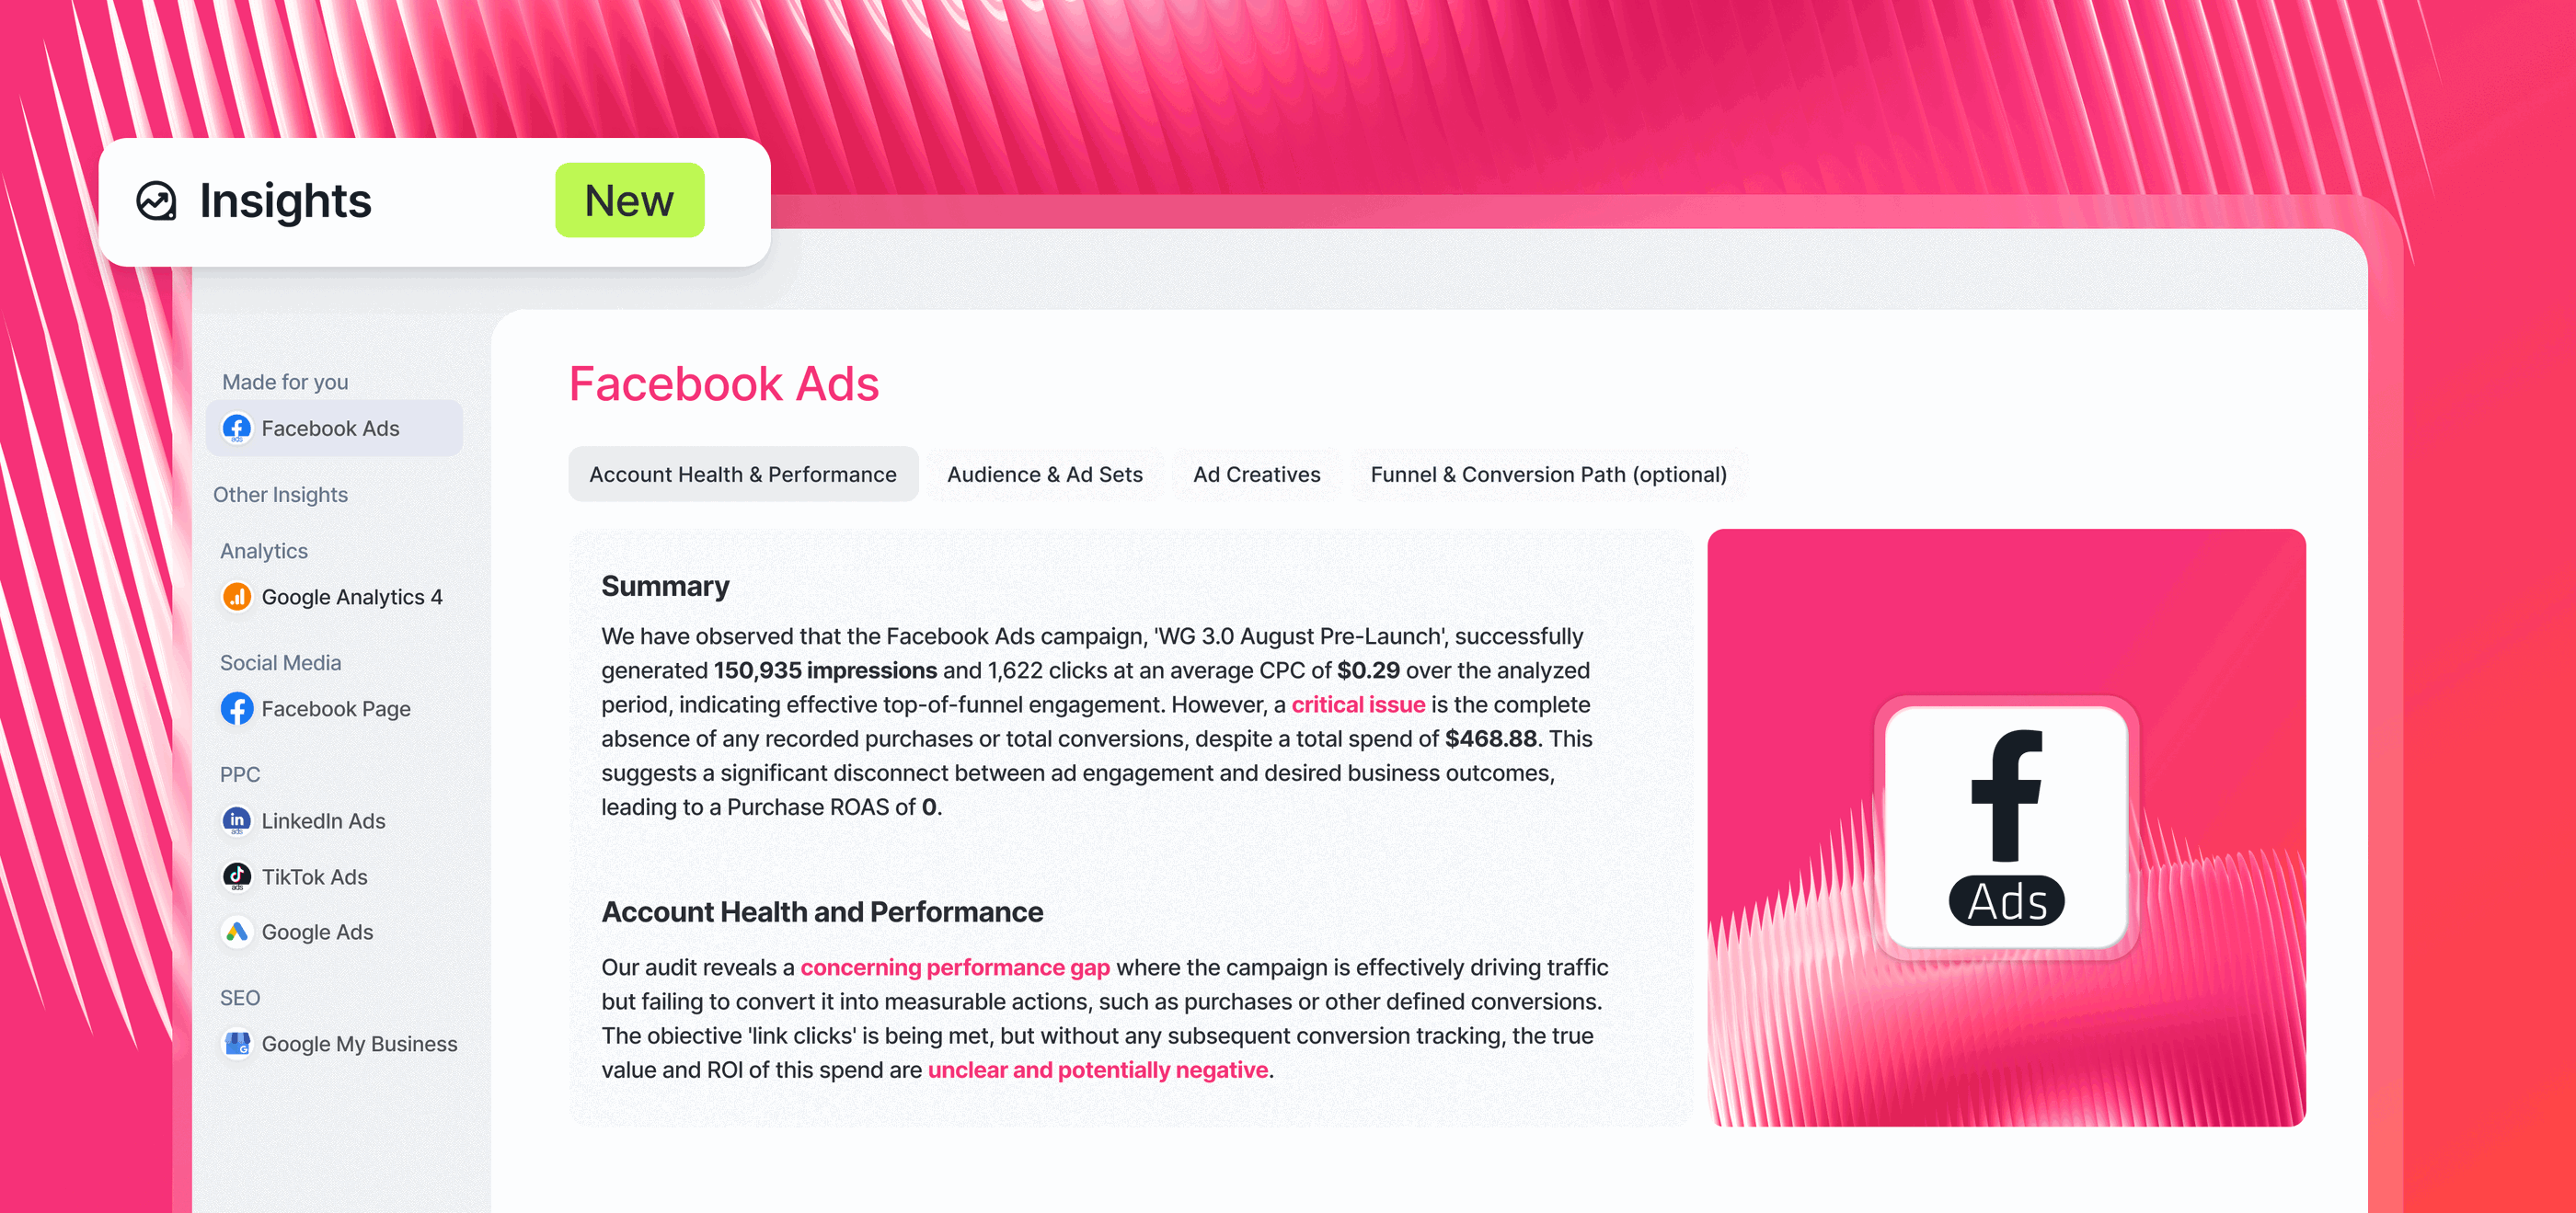
Now, when you log into Whatagraph, you’ll be able to access the “Insights” space, which is an “out-of-the-box” report that shows you the key insights from specific channels (e.g. Facebook Ads) right away. This includes:
- Account health and performance
- Audience and ad sets
- Ad creatives
- Funnel and conversion path
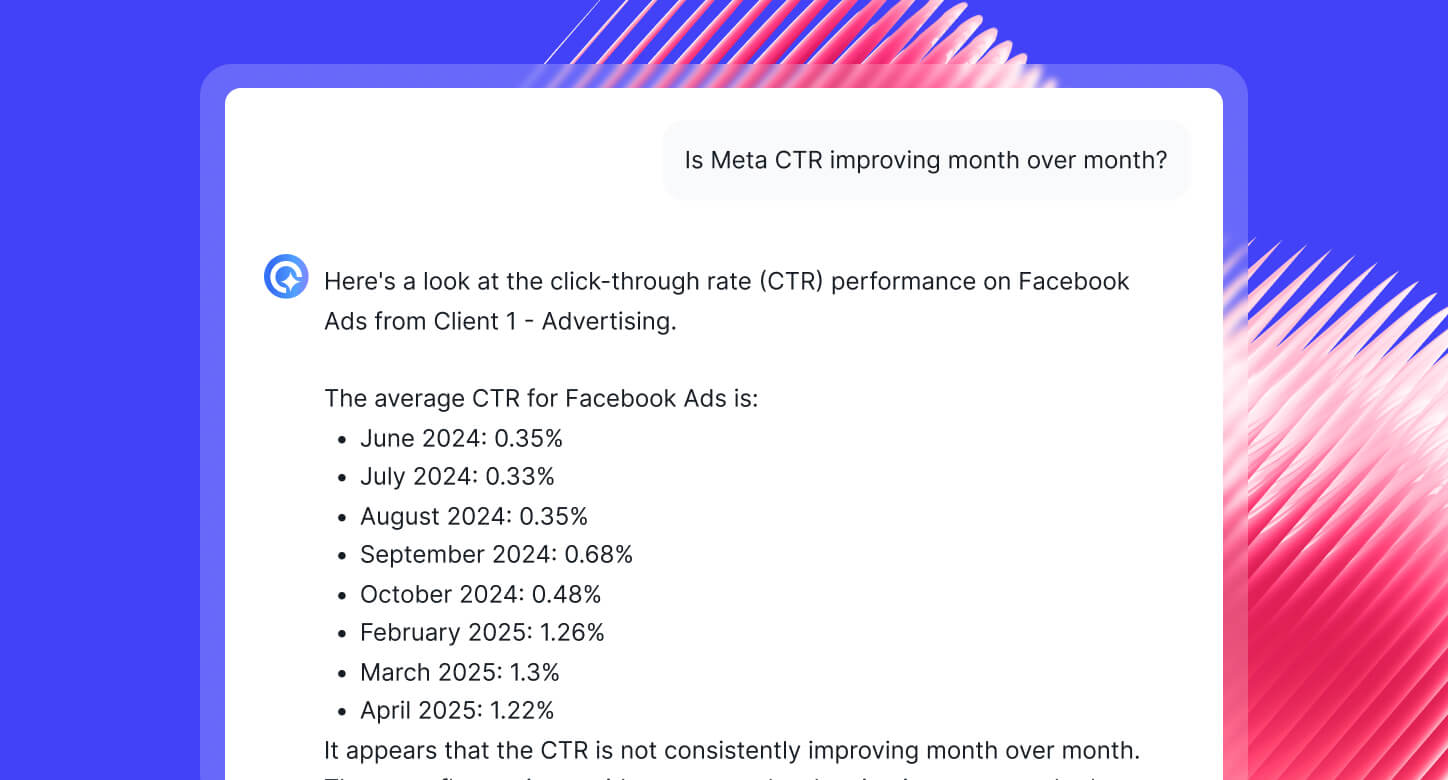
 Plus, with Whatagraph IQ Chat, you can just ask a question in plain language about your data and it’ll give you accurate, succinct answers.
For example:
- “What are the highest-performing [campaigns / ads / products] in these [categories / cities / countries] during this [time range]?”
- “Show me spend vs. conversions across all paid channels this quarter.”
- “How is my ROAS trending across all paid channels this month compared to last month?”
You also have the option to toggle this feature on for your clients so they can get quick answers about how the campaigns are going.
 All of this means:
✅ You make smart, data-driven decisions faster.
✅ You’re well prepared to answer clients’ or your team’s ad-hoc questions.
✅ Your data is safe and secure on one platform. You don’t need to upload your data to ChatGPT to get insights back.
✅ You can fully trust the insights Whatagraph gives—no hallucinations—because they’re based on the data we’re pulling from source platforms.
3. The entire reporting stack in one place
One of the biggest frustrations I hear from marketers is how fragmented their reporting stack is.
Data comes in from a dozen different platforms, gets pushed through connectors, exported into spreadsheets, cleaned manually, and then stitched together in dashboards.
Every step adds room for errors, delays, and endless second-guessing.
Whatagraph eliminates all these layers. Instead, you’ll get an all-in-one marketing intelligence platform where you can connect, clean, visualize, and analyze your data in one place.
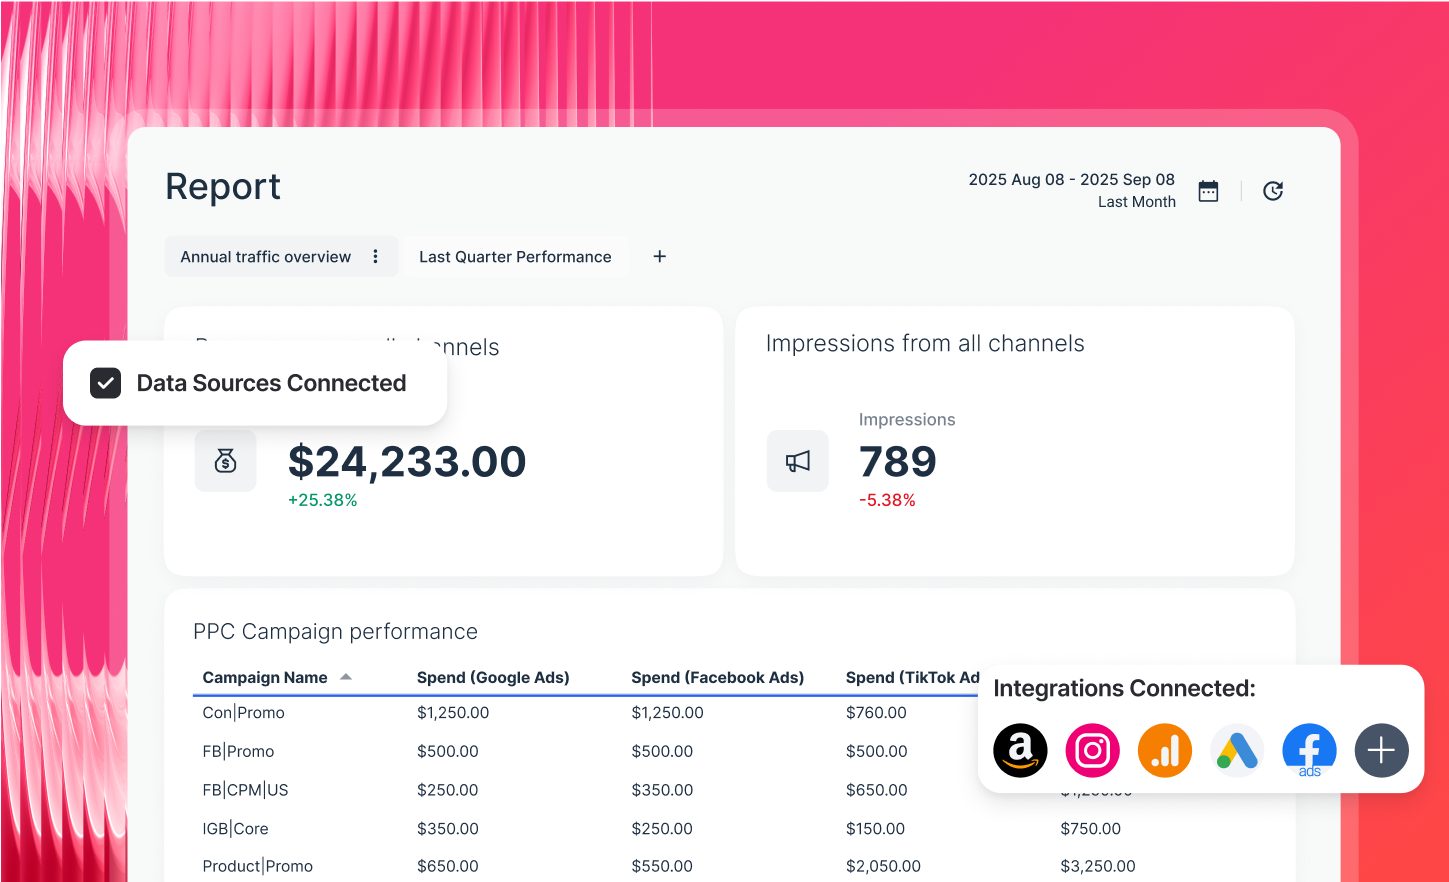
Here’s what that looks like:
- Bring data from 55+ marketing platforms automatically via native, stable connectors.
- Easily organize your data—create custom blends, metrics, and dimensions using no-code workflows or AI.
- Ask AI to create reports by just telling it what you want it to build. Or use drag-and-drop widgets or ready-made templates to build one from scratch.
- Customize reports in seconds by just uploading a screenshot of your (or your client’s) brandbook or putting in a prompt. Host and share reports on your own domain.
- Analyze your data with granular filters and tags. Spot trends, compare performance, and get actionable insights from your data in seconds.
- Share reports as live links, PDFs, Excel spreadsheets, or automated emails. You can also transfer your data to BigQuery data warehouse or Looker Studio.
This means:
✅ You always work from one reliable source of truth instead of juggling disconnected tools.
✅ You save hours every week by cutting out manual checks, fixes, and reconciliations.
✅ You can fully trust the numbers you present to your team or clients—they’re pulled directly from source platforms and auto-updates every 30 minutes.
In fact, Kim Strickland, Digital Marketing Specialist at Peak Seven agency, saved 63 hours a month and $9K+ for clients after she switched from a fragmented stack of Supermetrics and Looker Studio.
She said in this case study:
With Looker Studio, everything was muddled, but Whatagraph has opened up transparency and communication. It allowed us to see clearly how our campaigns are performing and even pointed out the flaws in our data tracking systems. Whatagraph is now our Bible—both for our clients and team!
The good news doesn't end here.
A forever free tier for every marketer
For the first time, we’re introducing something new with Whatagraph 3.0: a forever free plan.
That means you can get started with Whatagraph, connect your data, and build reports for free without a time limit, and without worrying about a trial expiring.
Why? Because we believe every performance marketer deserves a way out of the old, broken reporting cycle.
You shouldn’t have to act like a data scientist just to pull numbers together. You shouldn’t need five different tools just to tell a client what’s working.
The forever free plan makes sure that anyone—whether you’re running reports for yourself or a hundred clients—can start using us, and stick with us for life.
And when you’re ready to scale, Whatagraph 3.0 grows with you. From free all the way to enterprise, the goal stays the same: take the heavy lifting off your plate, so you can focus on the work that actually moves the needle.
Sign up to Whatagraph 3.0 for free and start using it right away.
Published on Sep 09 2025
WRITTEN BY
Justas MalinauskasJustas is the CEO and Co-Founder of Whatagraph. Frustrated with inefficient reporting and data management processes when he was leading a digital marketing agency, he founded Whatagraph in 2015. His main mission? Empower marketers to make data-driven decisions, fast. Now, he leads a team of 60+ employees worldwide.