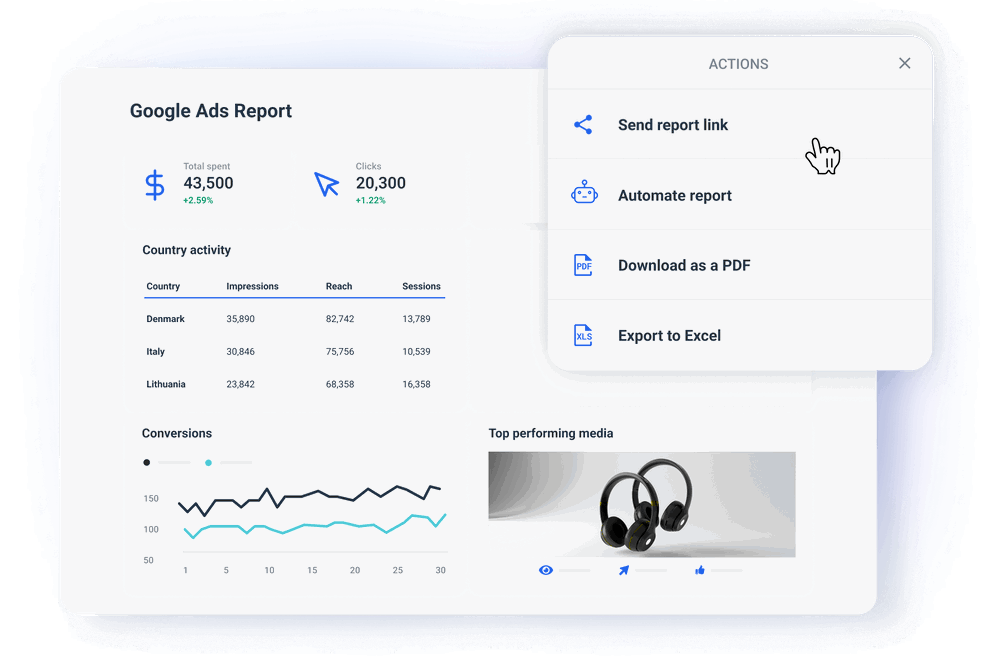
What is a Google Ads reporting tool?
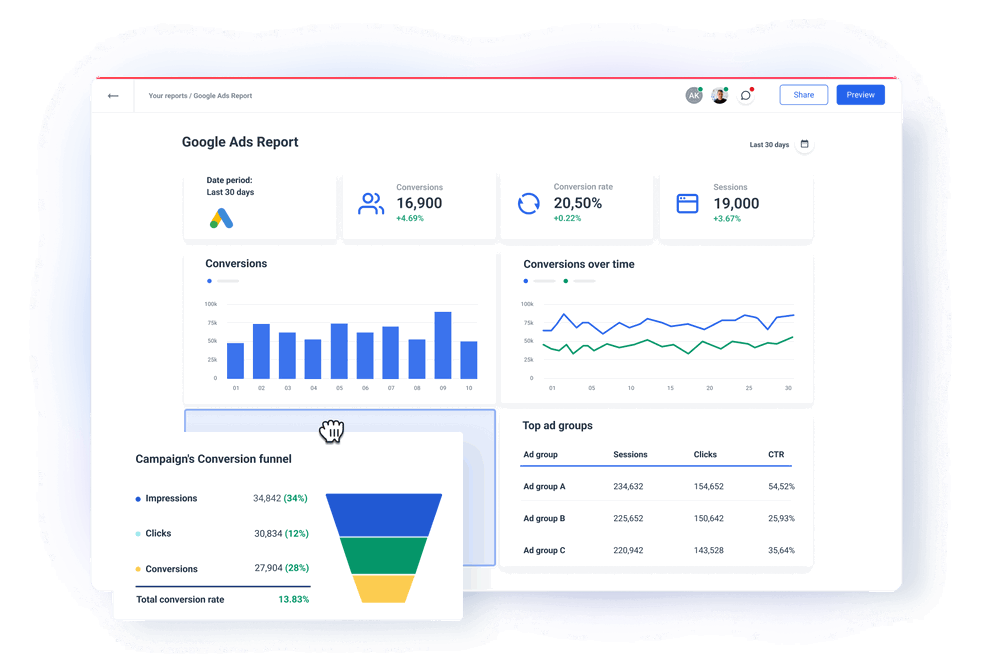
A Google Ads reporting tool automatically pulls your campaign data from Google Ads and presents it in a visual, client-friendly format.
Instead of hopping between tabs, exporting CSVs, or fiddling with Looker Studio connections, you get a single Google Ads reporting platform that shows all your key metrics—ad spend, CTR, conversions, ROAS, and more.
For agencies, this means:
✅ No more manual data wrangling
✅ Fewer errors and delays
✅ More time to actually optimize campaigns
It’s the difference between making reports and actually using them to drive results.
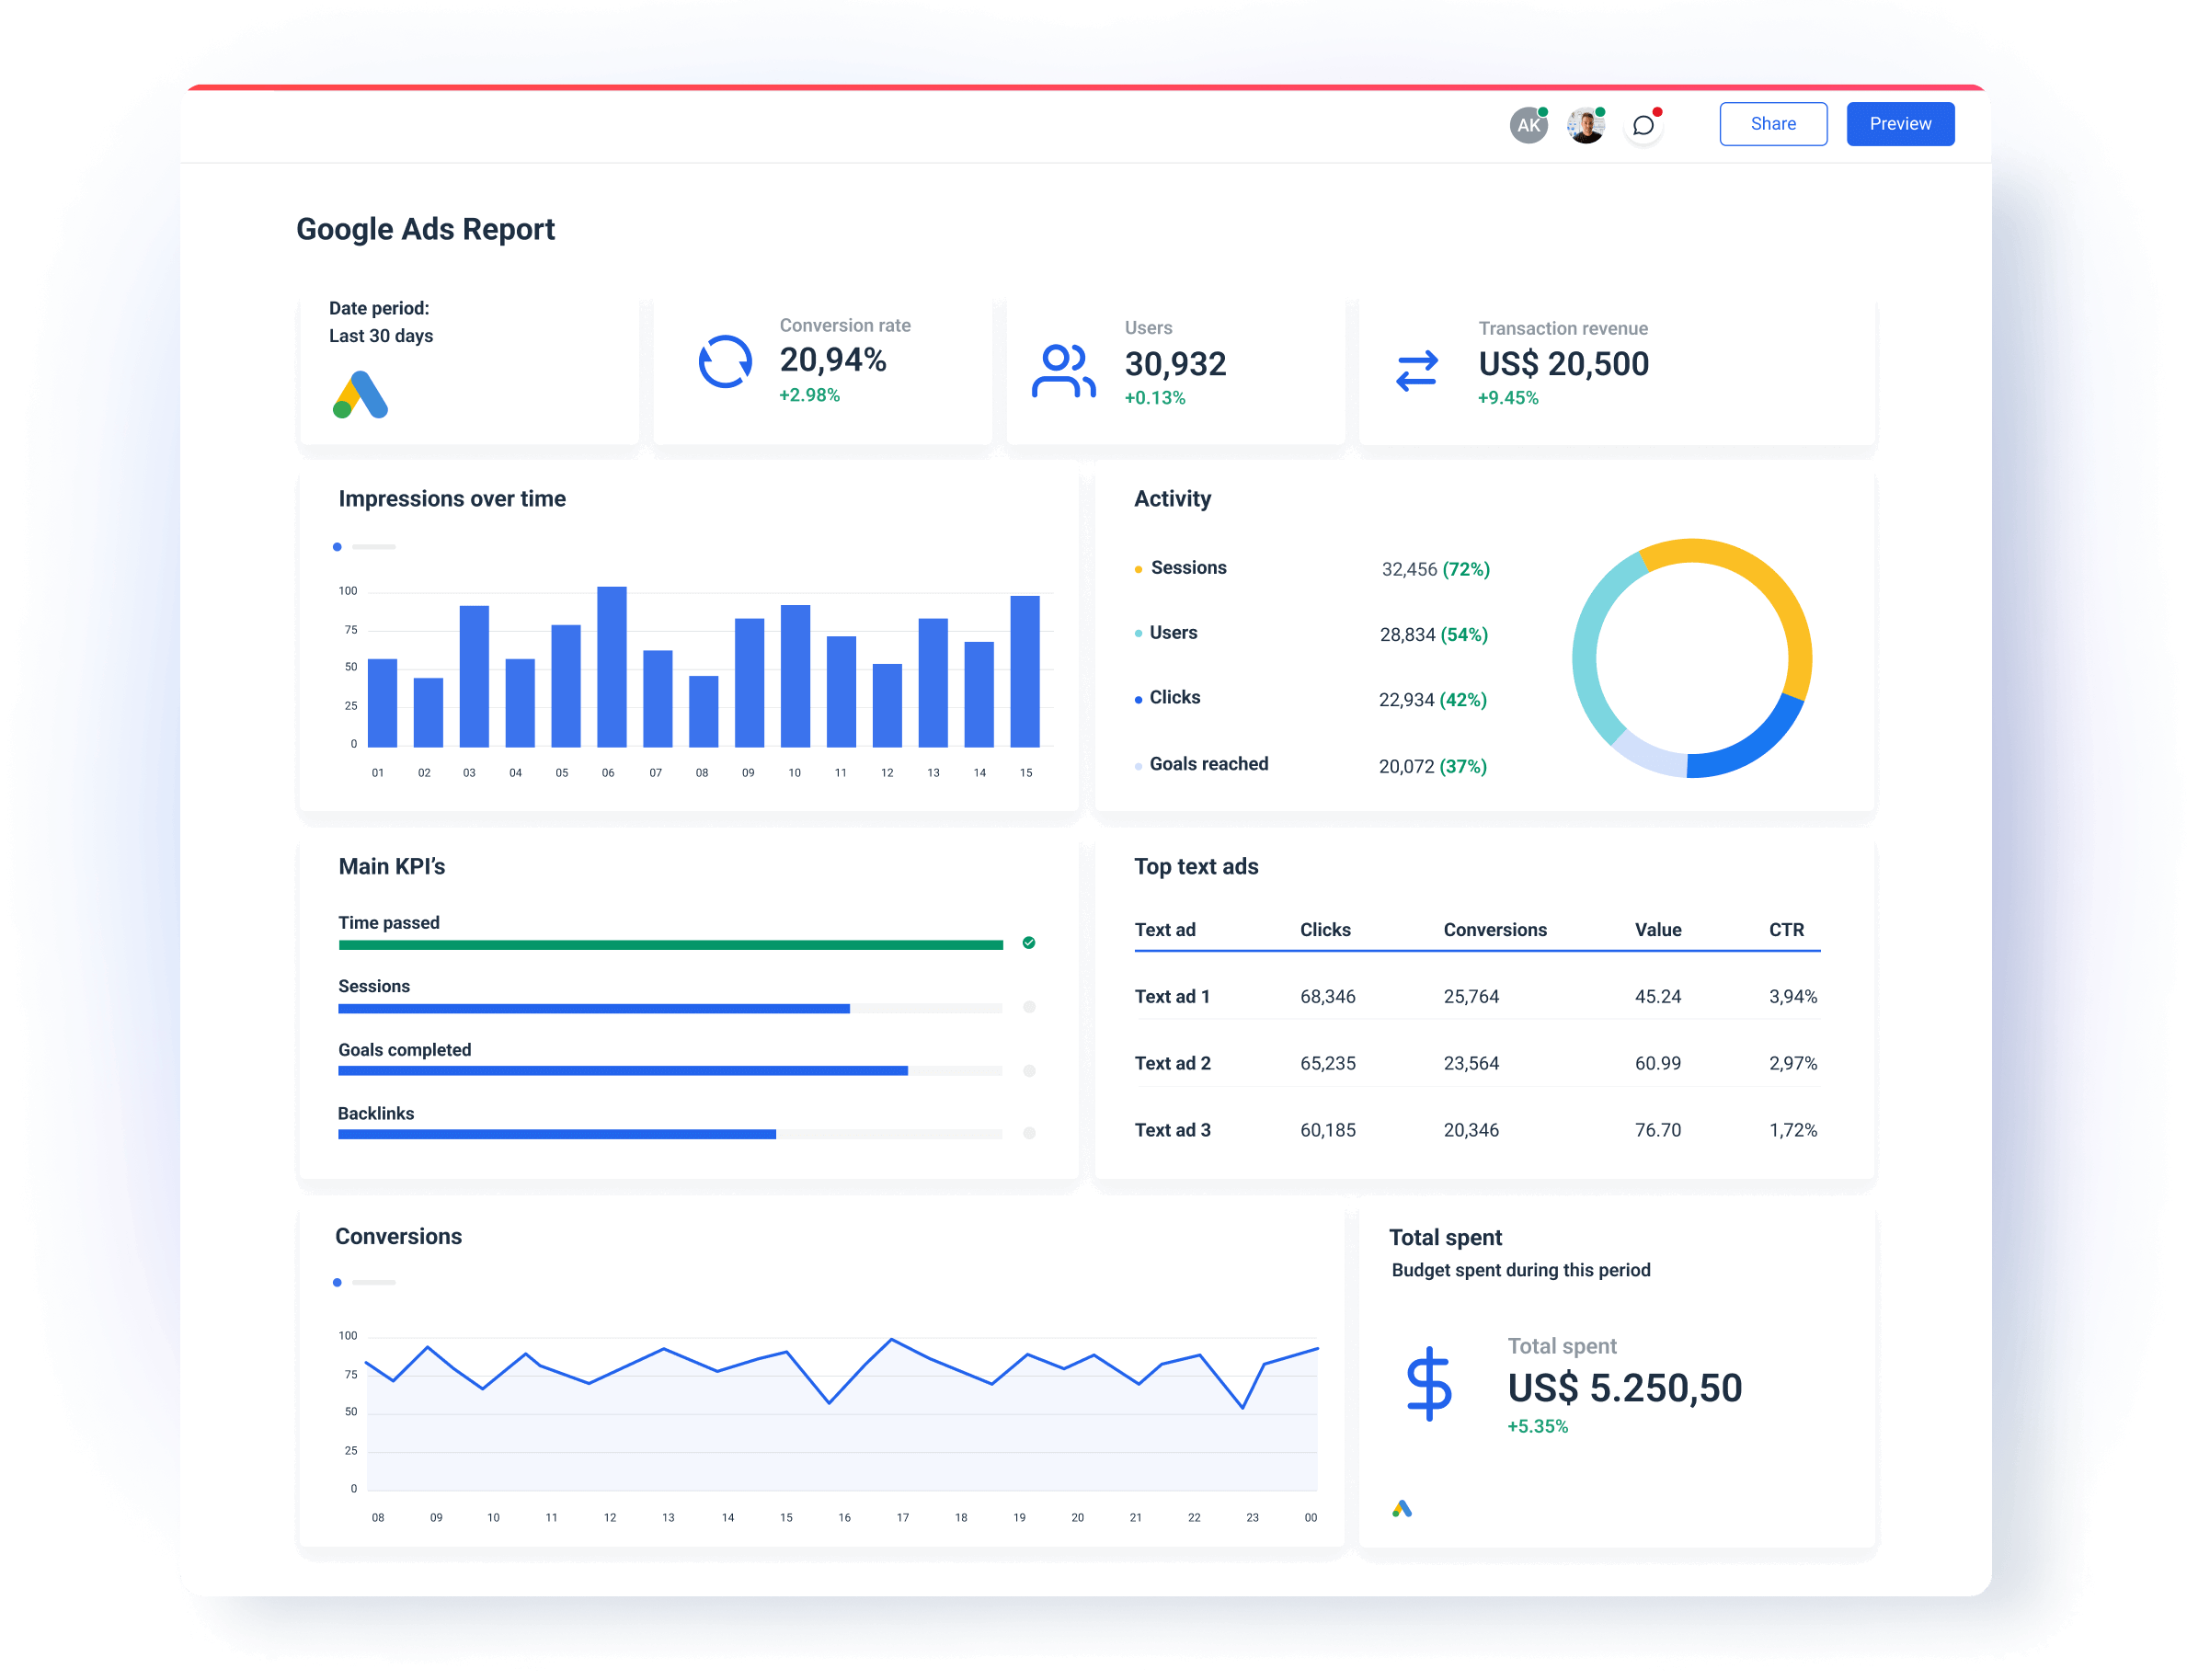
How do I track Google Ads performance?
The easiest way to track performance is to use a dedicated Google Ads reporting solution like Whatagraph. Here’s how you do it in four steps:
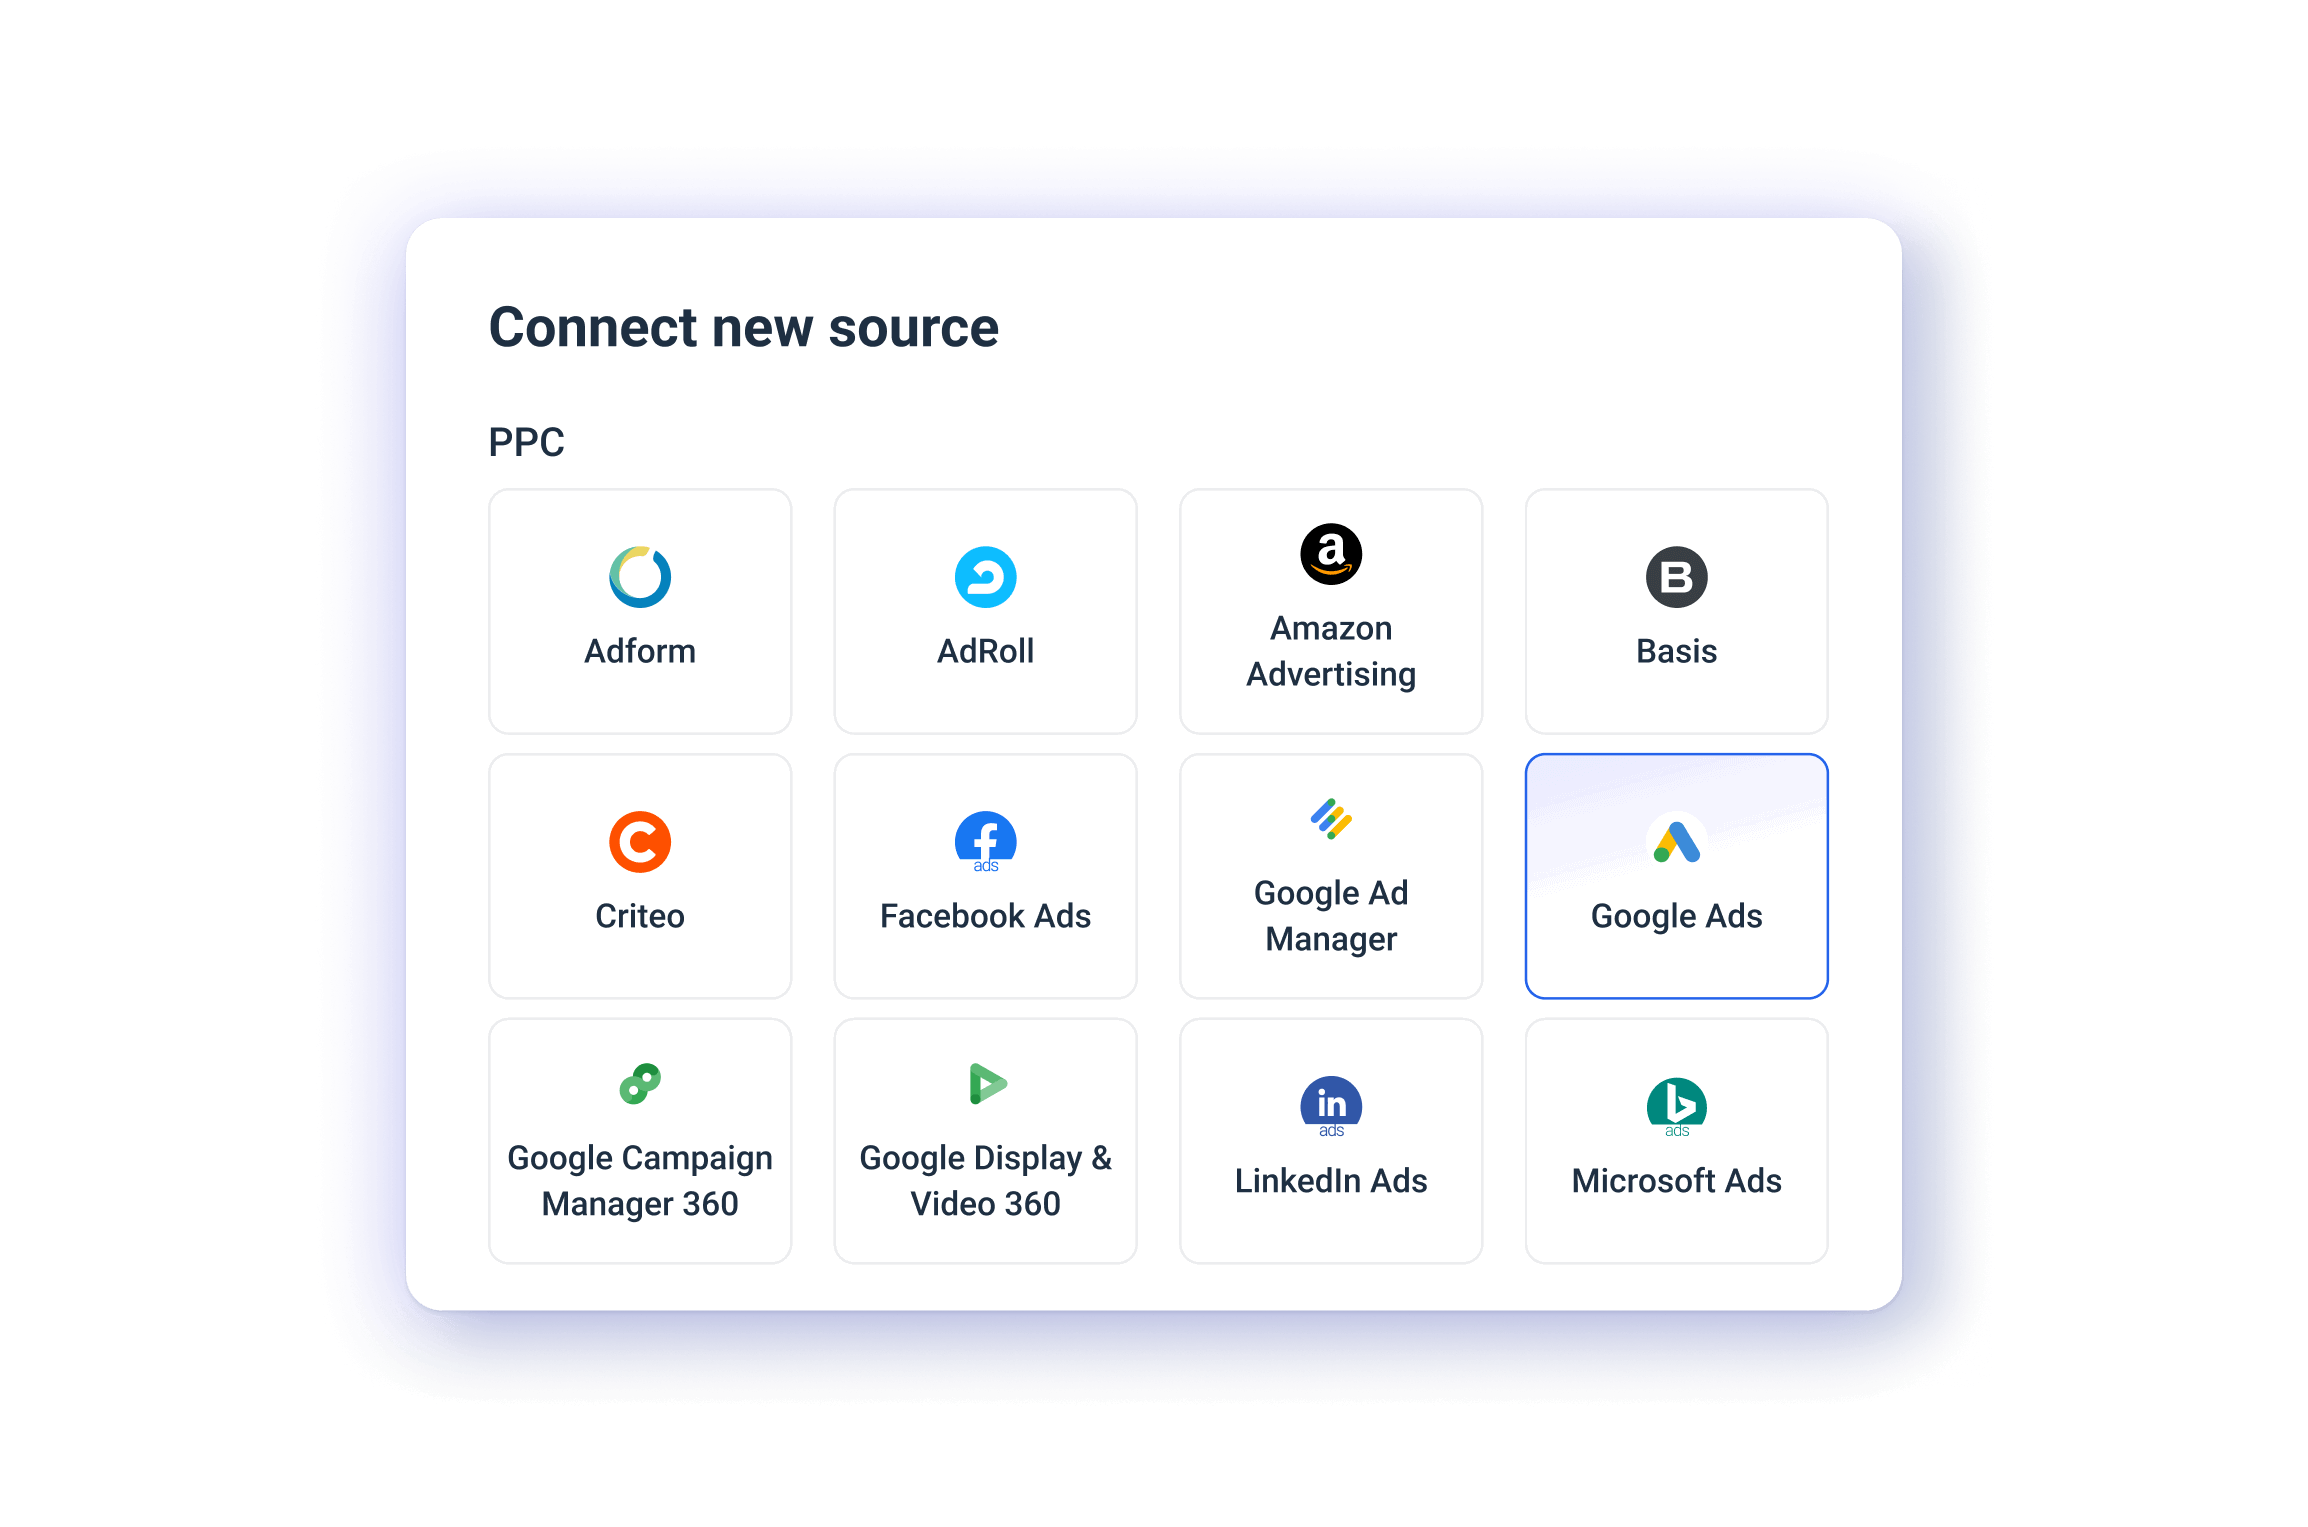
Step 1: Connect Google Ads
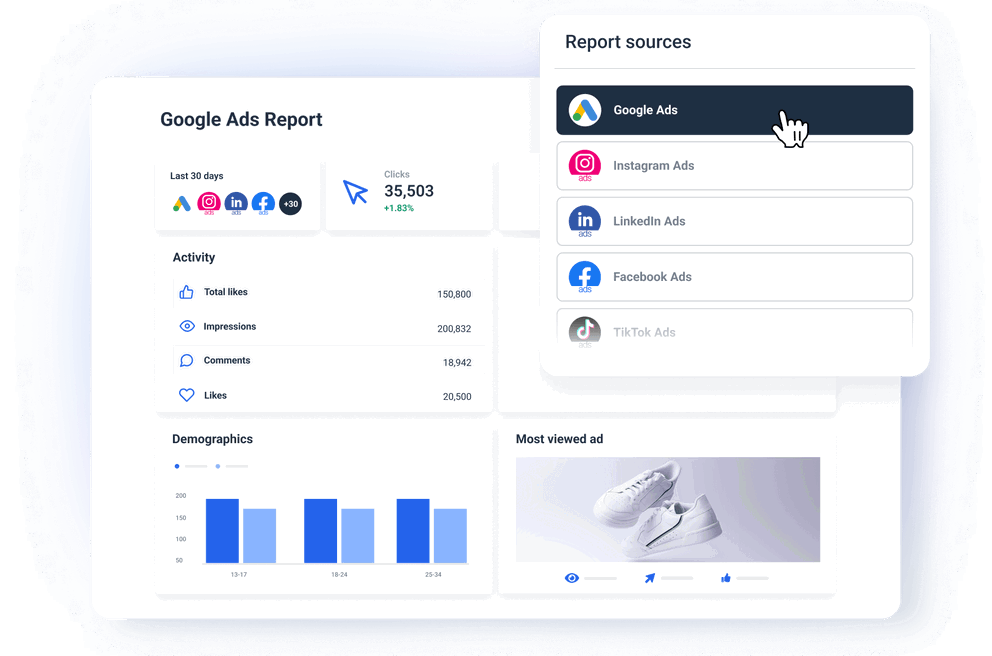
Log into Whatagraph and choose Google Ads as your source. The native integration means you’re connected in seconds—no extra tools or unstable third-party connectors.
Once you're connected, your campaign data flows in automatically.
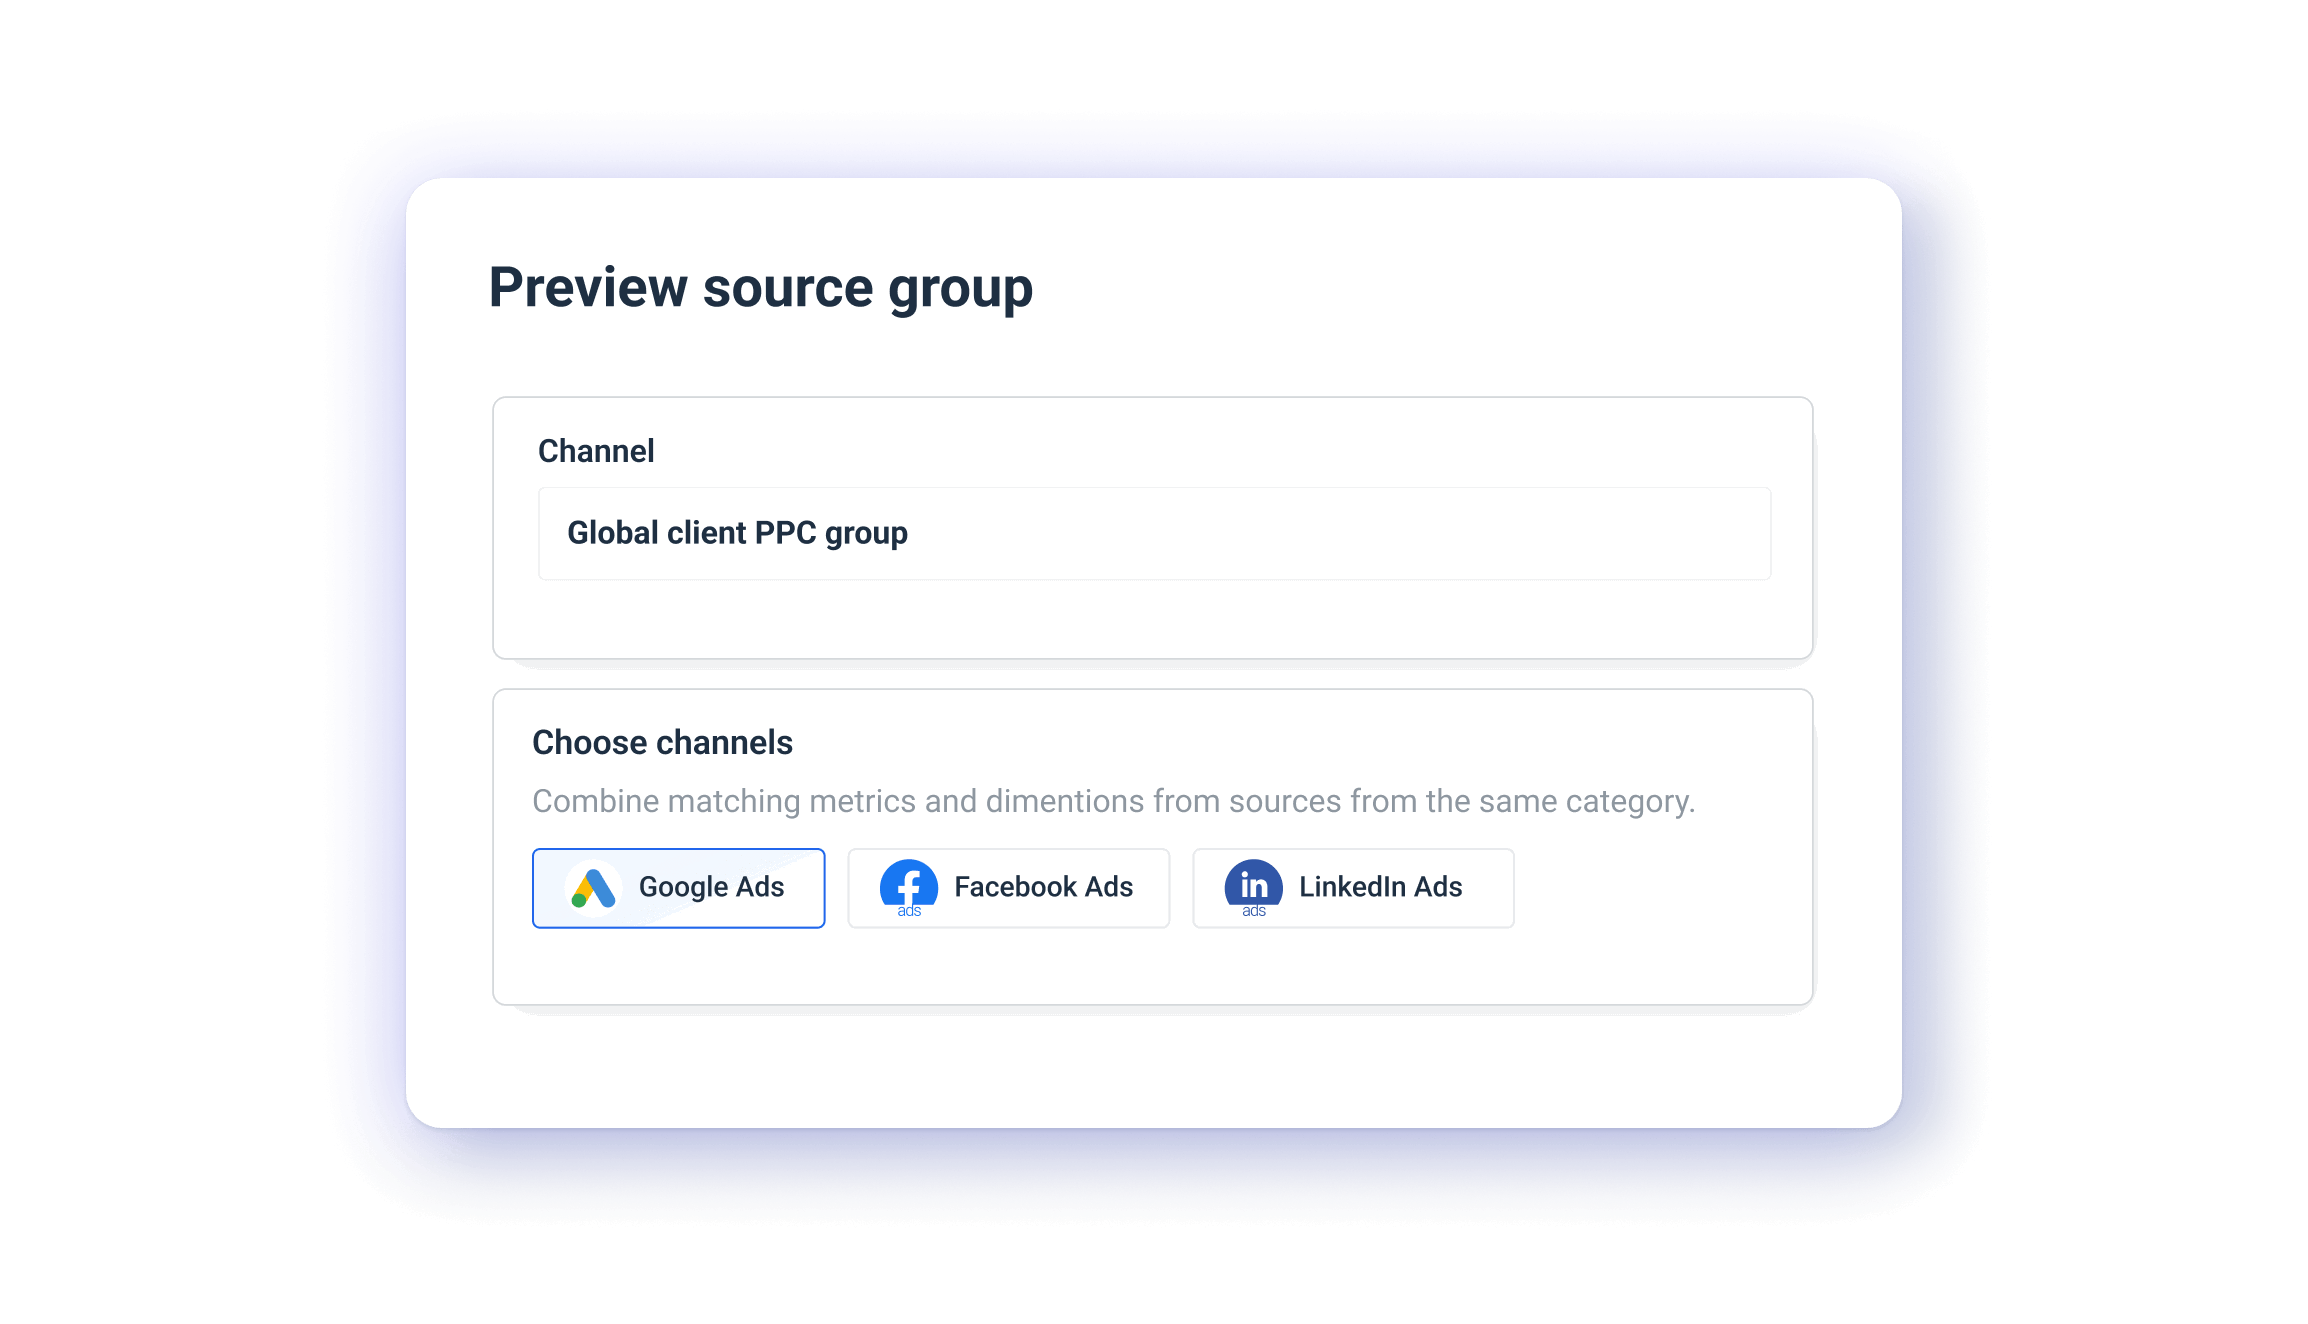
Step 2: Organize your data
Once your data is on Whatagraph, the next step is to clean it. This means:
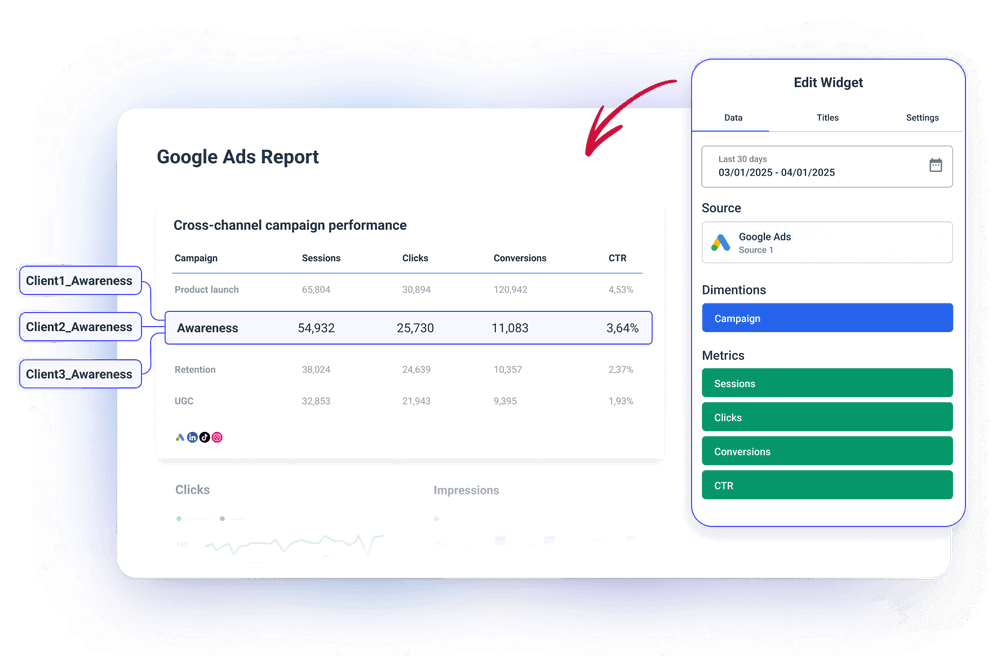
- Standardizing campaign names
- Matching metric names
- Blending Google Ads data with other platforms (e.g. Facebook Ads, LinkedIn Ads) for a holistic view of PPC performance
This keeps your reports clean and consistent.
Step 3: Build and customize your reports
Most Google Ads reporting software offer limited customization or force you into rigid templates that don’t reflect your agency’s brand. Not Whatagraph.
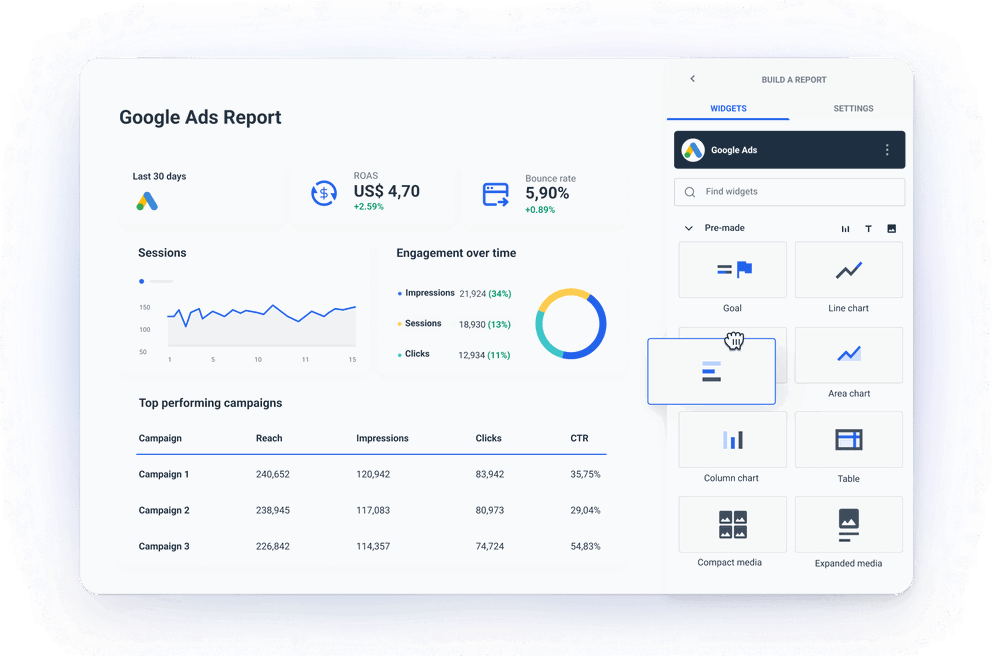
With Whatagraph, every Google Ads report you build doubles as a live, shareable dashboard. And the entire interface is drag-and-drop, no coding or spreadsheets required.
To build a report, you have three options:
- Choose a pre-built template from 100+ templates available
- Start from a blank page and drag-and-drop widgets onto the canvas
- Use an automatic smart builder for popular channels like Google Ads
In terms of widgets, we offer four options:
- Drag-and-drop pre-made widgets (great for new users)
- Build-your-own widgets for custom metrics
- Widget templates you can reuse
- Offline data widgets for manual inputs
For each of these widgets, you can:
- Rename the widget
- Change icons or remove them entirely
- Customize the color scheme to match your or your client’s branding
- Apply custom formulas (e.g. blend Google Ads data with other platforms)
- Set specific date ranges or currencies
- Add or hide footers
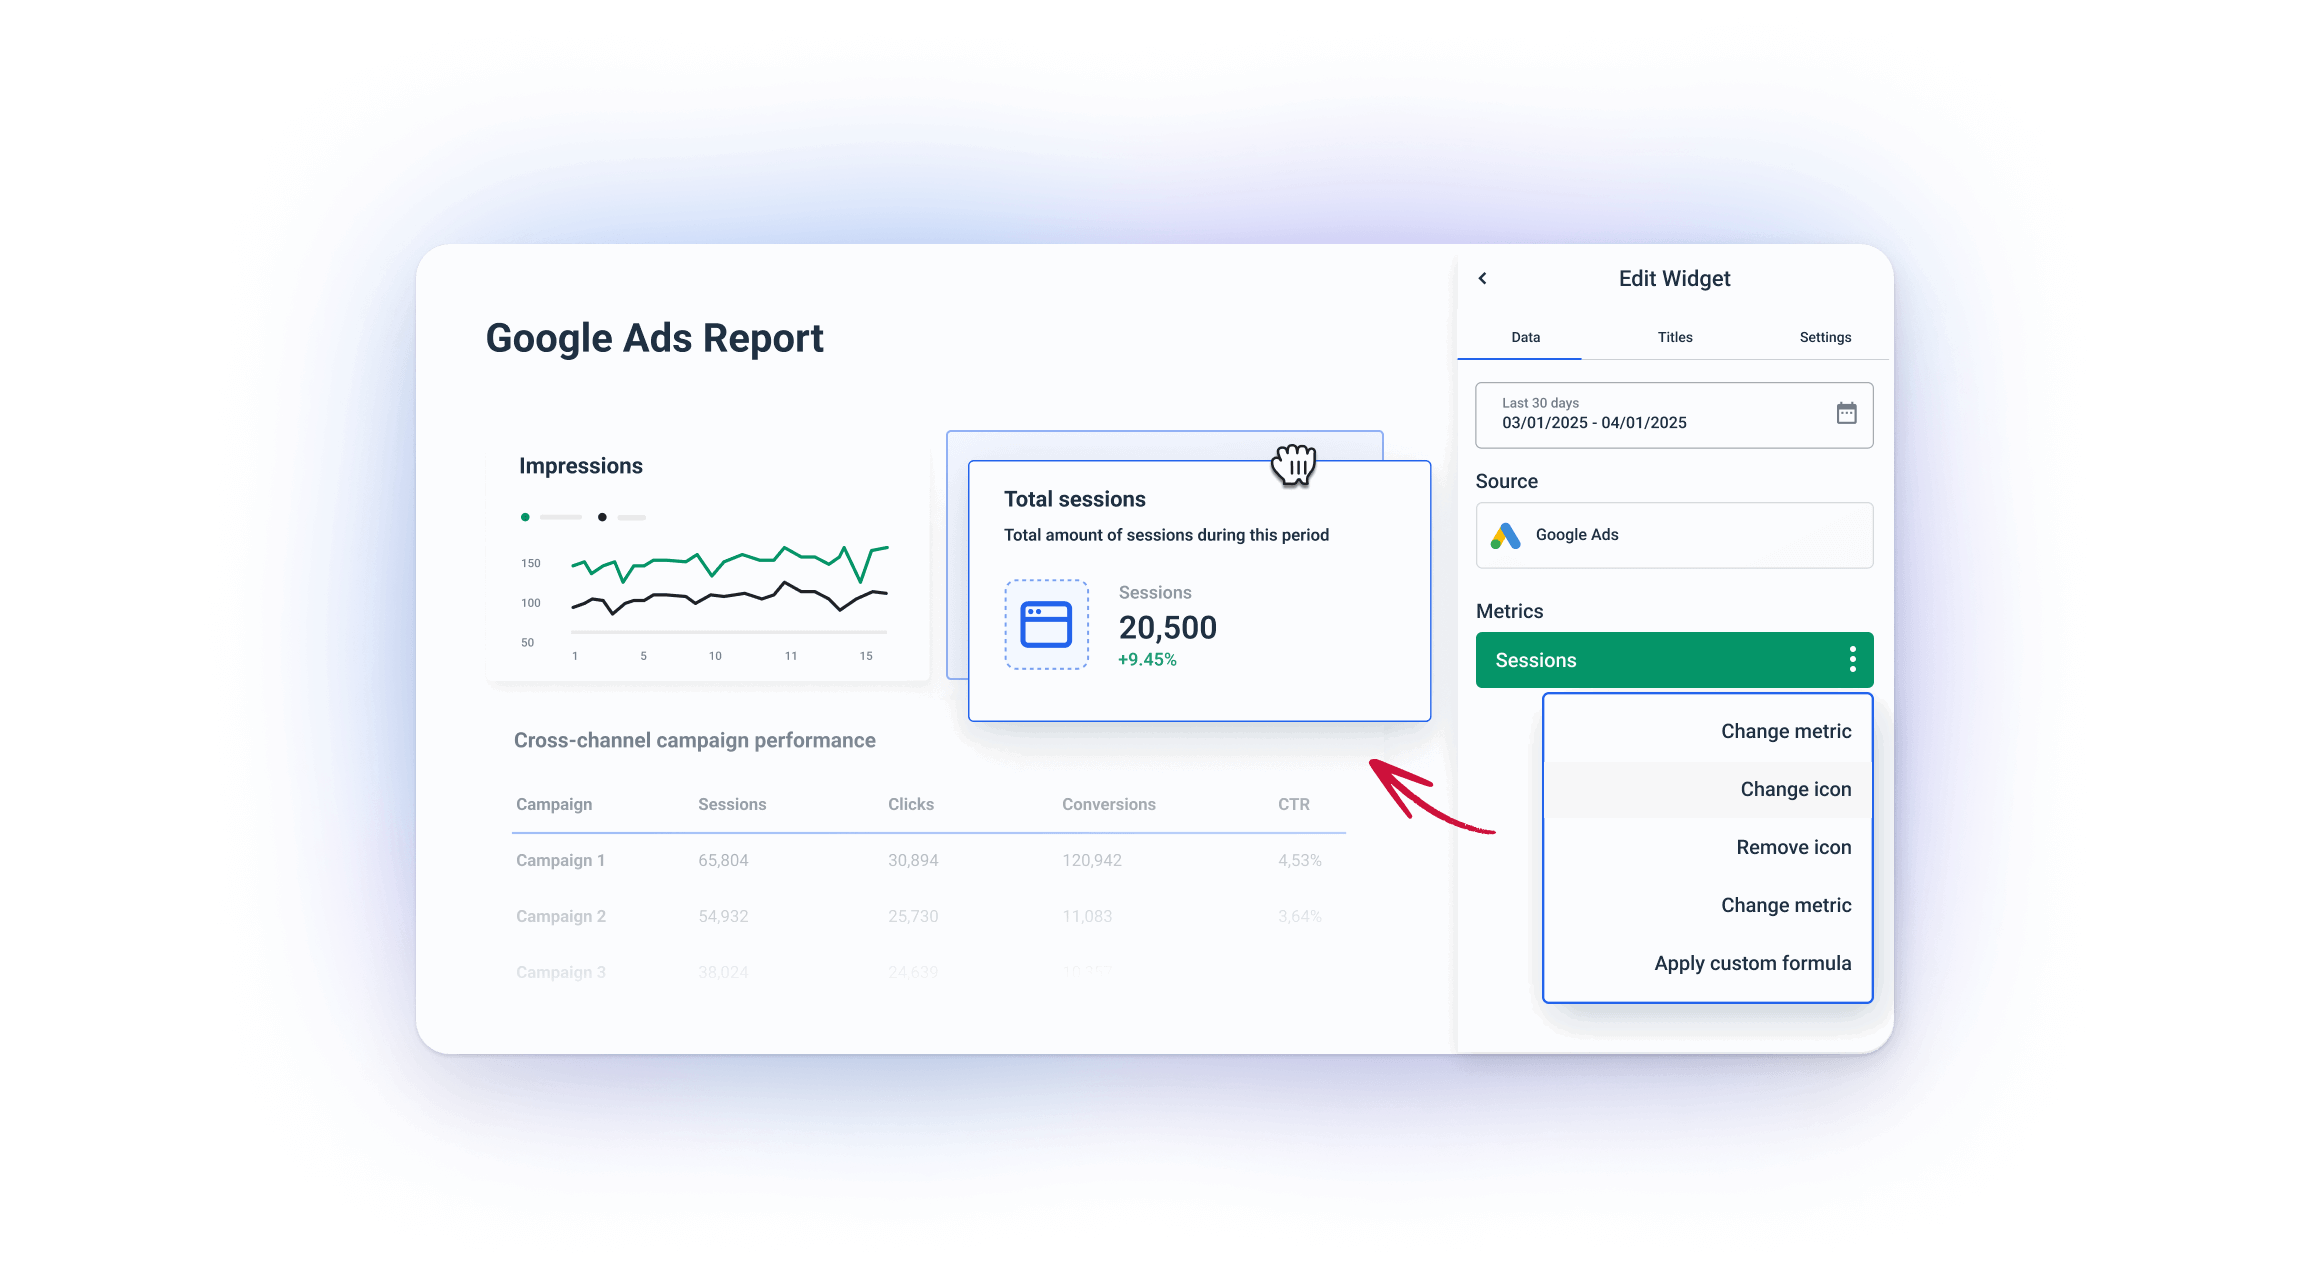 You can also resize every widget horizontally or vertically to fit your layout.
That’s not all.
Whatagraph also comes with more customization features that makes your user experience as smooth as butter:
- Insert or delete rows anywhere in your report
- Create folders for each client or Account Manager
- Change the orientation of your reports
- Save your favorite reports as “team templates” and re-use them the next time
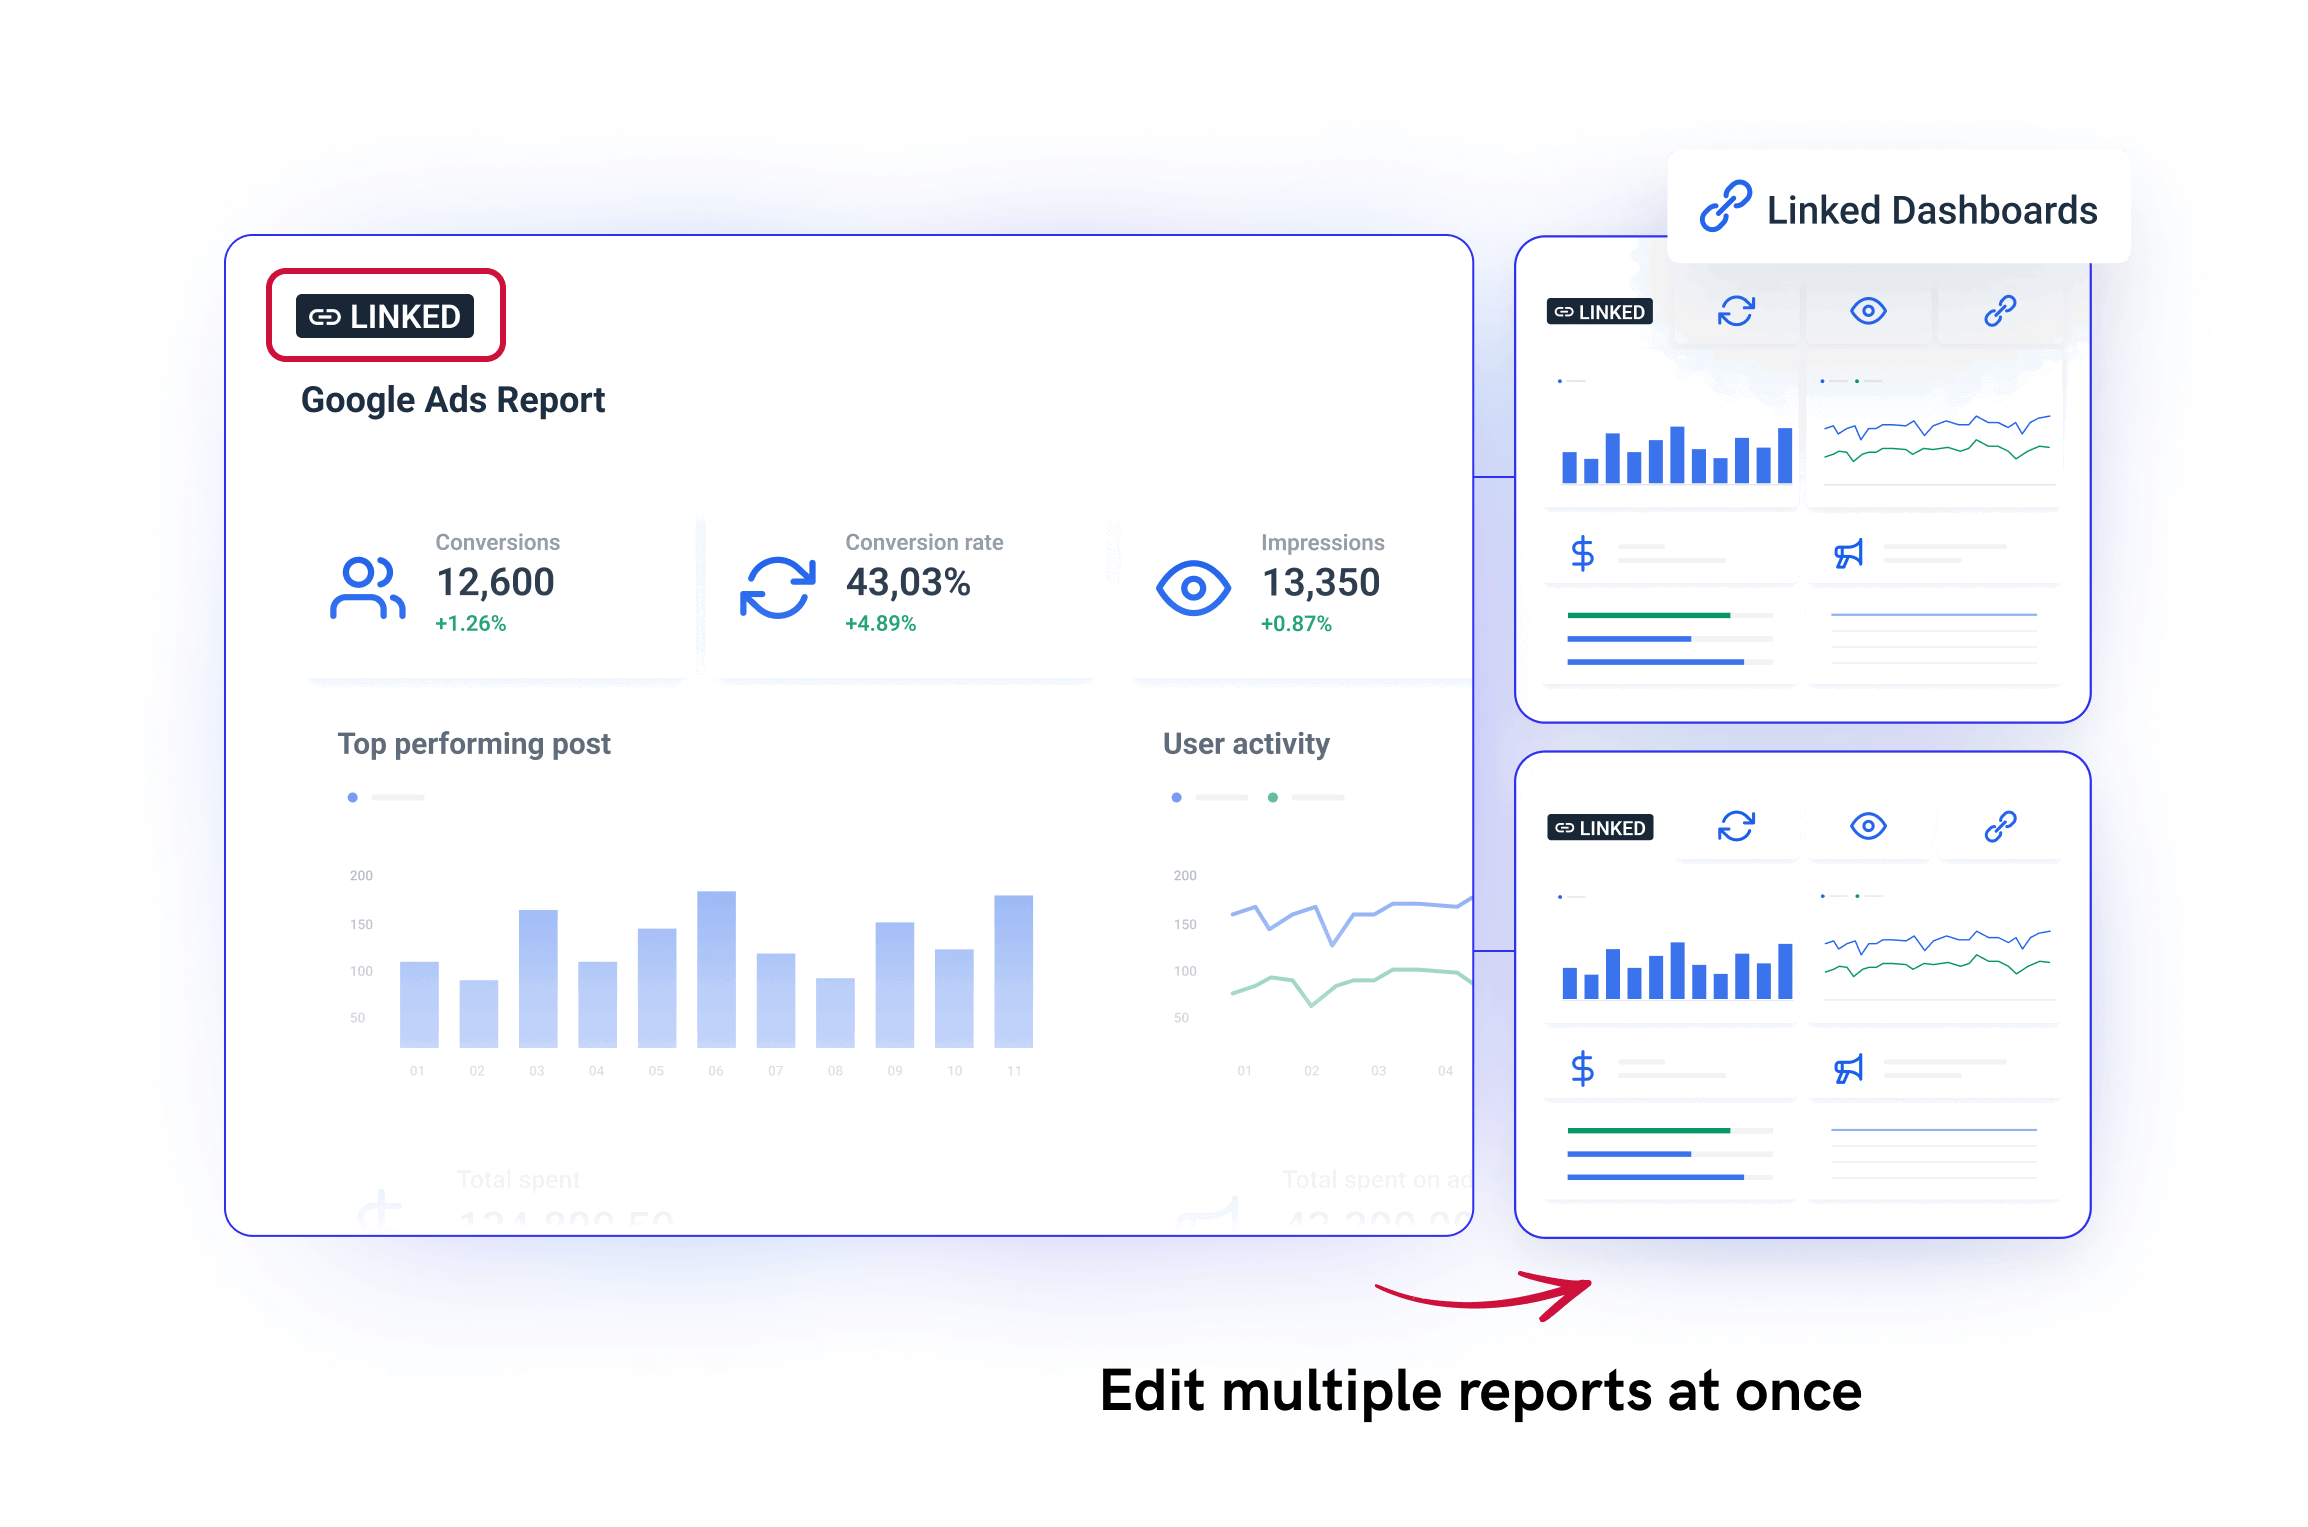
- Link similar reports together and edit them in bulk rather than one by one
- …and so much more
 When it comes to white-labeling, you can:
- Upload your agency or client logo
- Set custom color palettes
- Add branded headers and footers
- Use your own email domain and custom subdomain to host reports
Step 4: Ask AI for performance summaries
Clients don’t always read every chart. What they really want is the story behind the numbers—and now, you don’t have to write that story from scratch.
With Whatagraph’s Google Ads reporting platform, you get two powerful AI tools built to save time and surface insights faster:
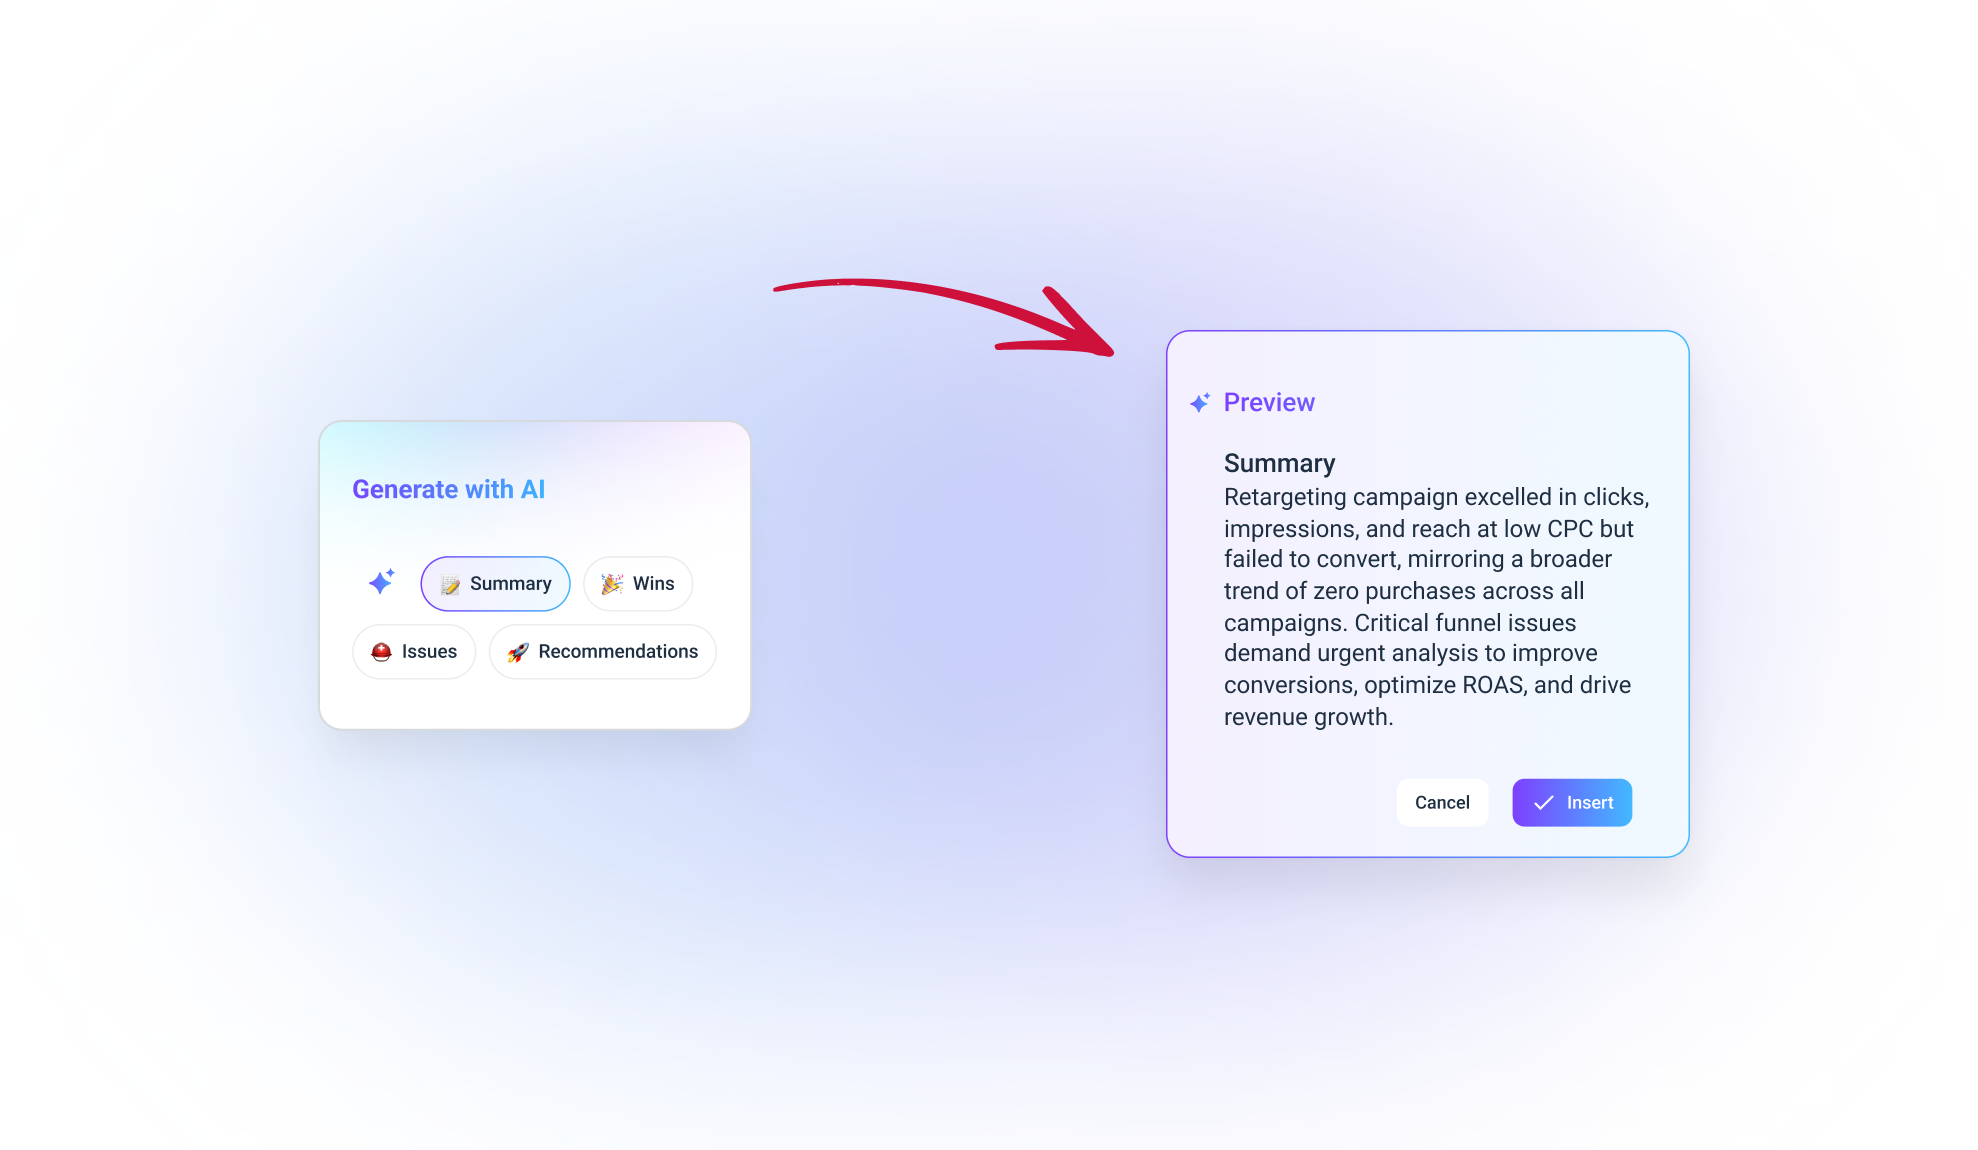
1. Auto-generated AI summaries for your reports
Instead of writing your own performance summaries at the end of each report, you can now ask AI to do it for you.
Just add a text widget to any Whatagraph report, select whether you want a short or long summary, and let the AI write it for you. You’ll get a ready-to-edit paragraph that’s:
- Accurate
- Succinct
- On-brand (you can tweak tone or phrasing before sharing)
2. AI Chatbot for performance questions
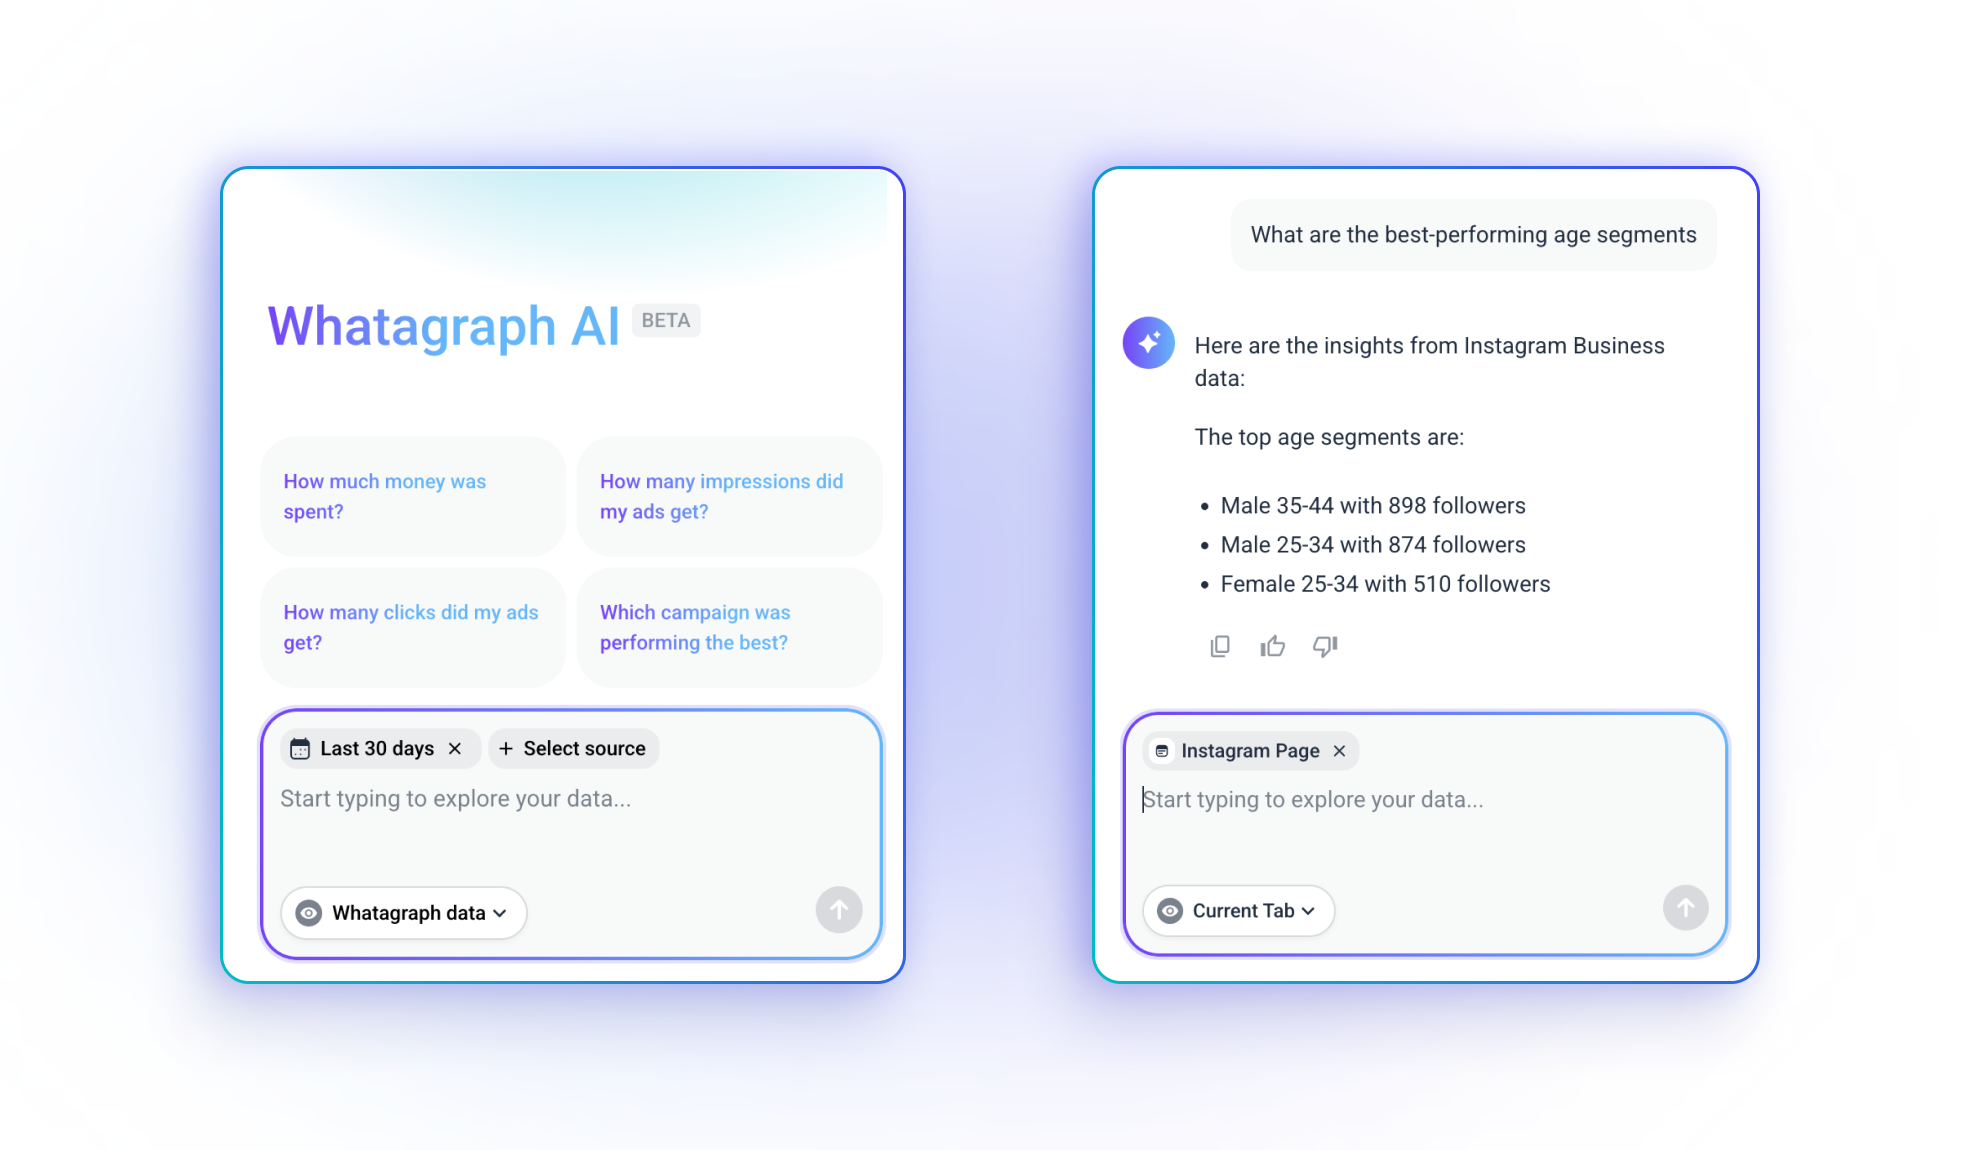
This is like having a personal ChatGPT—but trained specifically on your marketing data.
Here’s how it works:
- Pick a pre-written question like: “How much did we spend last month?” or “Which campaign had the highest ROAS?”
- Select your data source (Google Ads, Facebook Ads, etc.)
- Choose your time range
The AI instantly pulls the numbers and gives you a clear, human-friendly answer.
What performance metrics to include in a Google Ads campaign report?
When you're using a Google Ads dashboard, it’s not enough to just show raw numbers—you need to show the metrics that matter. Here are the core metrics you should always include in your reports:
- Impressions: Shows how often your ads were displayed. Helps measure visibility and reach.
- Clicks: Tracks how many users interacted with your ad. A key indicator of ad engagement.
- Click-Through Rate (CTR): Ratio of clicks to impressions. High CTR means your ads are relevant and engaging.
- Conversions: Counts how many users completed a desired action (purchase, signup, etc.). Core performance metric.
- Conversion Rate: Percentage of clicks that resulted in a conversion. Reflects how effective your landing page and offer are.
- Cost: Total ad spend during the reporting period. Essential for budget tracking.
- Cost Per Conversion (CPA): How much you spend to generate one conversion. Helps assess efficiency and ROI.
- Average Cost Per Click (CPC): Shows the average amount paid per click. Useful for monitoring bid strategy and cost trends.
- Return on Ad Spend (ROAS): Measures revenue earned for every dollar spent. A key profitability indicator.
- Top-performing locations: Identifies which countries or regions are driving the most impressions, clicks, and conversions.
- Keyword performance: Tracks clicks, CTR, CPC, and conversions for each keyword. Helps optimize targeting and reduce wasted spend.
- Landing page performance: Measures how landing pages perform after a click. Critical for spotting UX issues and improving conversion rates.
How do you know if your Google Ads are doing well?
To help you understand your Google Ads performance, we published two calculators:
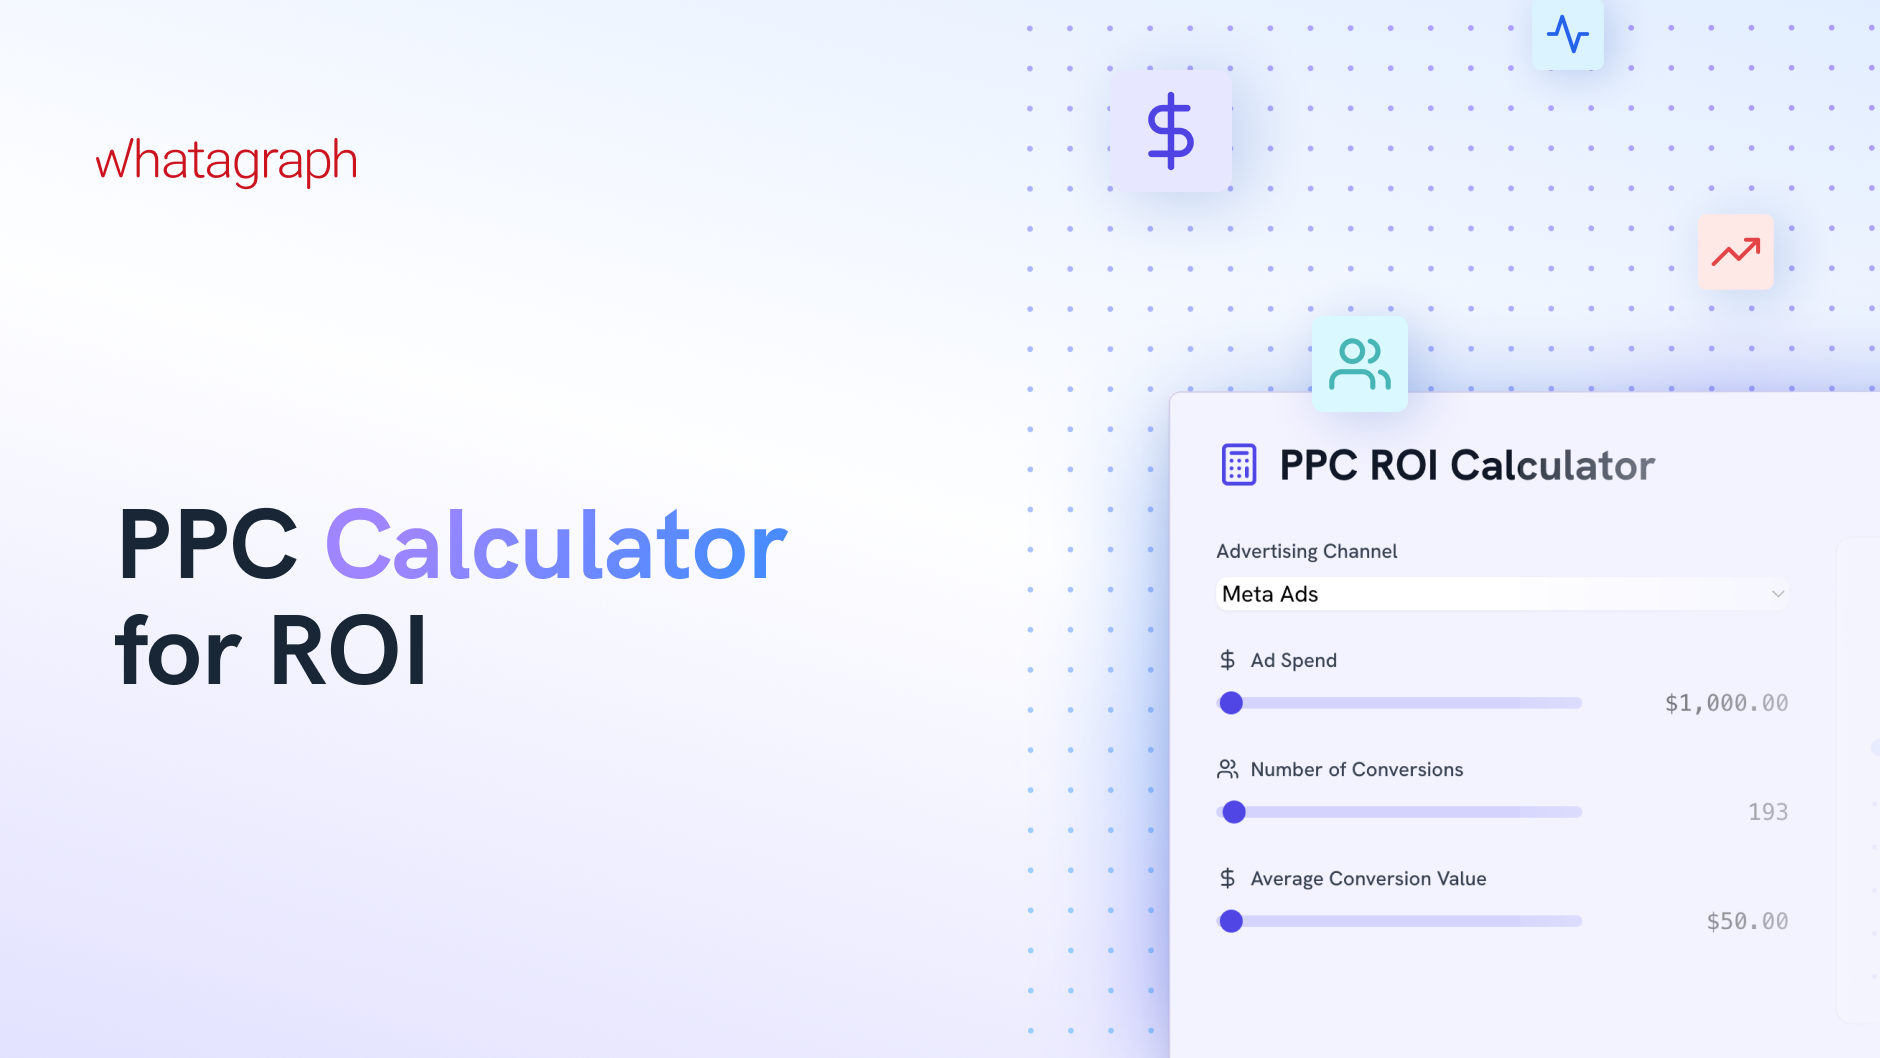
- PPC ROI Calculator: Find out if your campaigns are actually profitable. Just plug in your spend and revenue numbers.
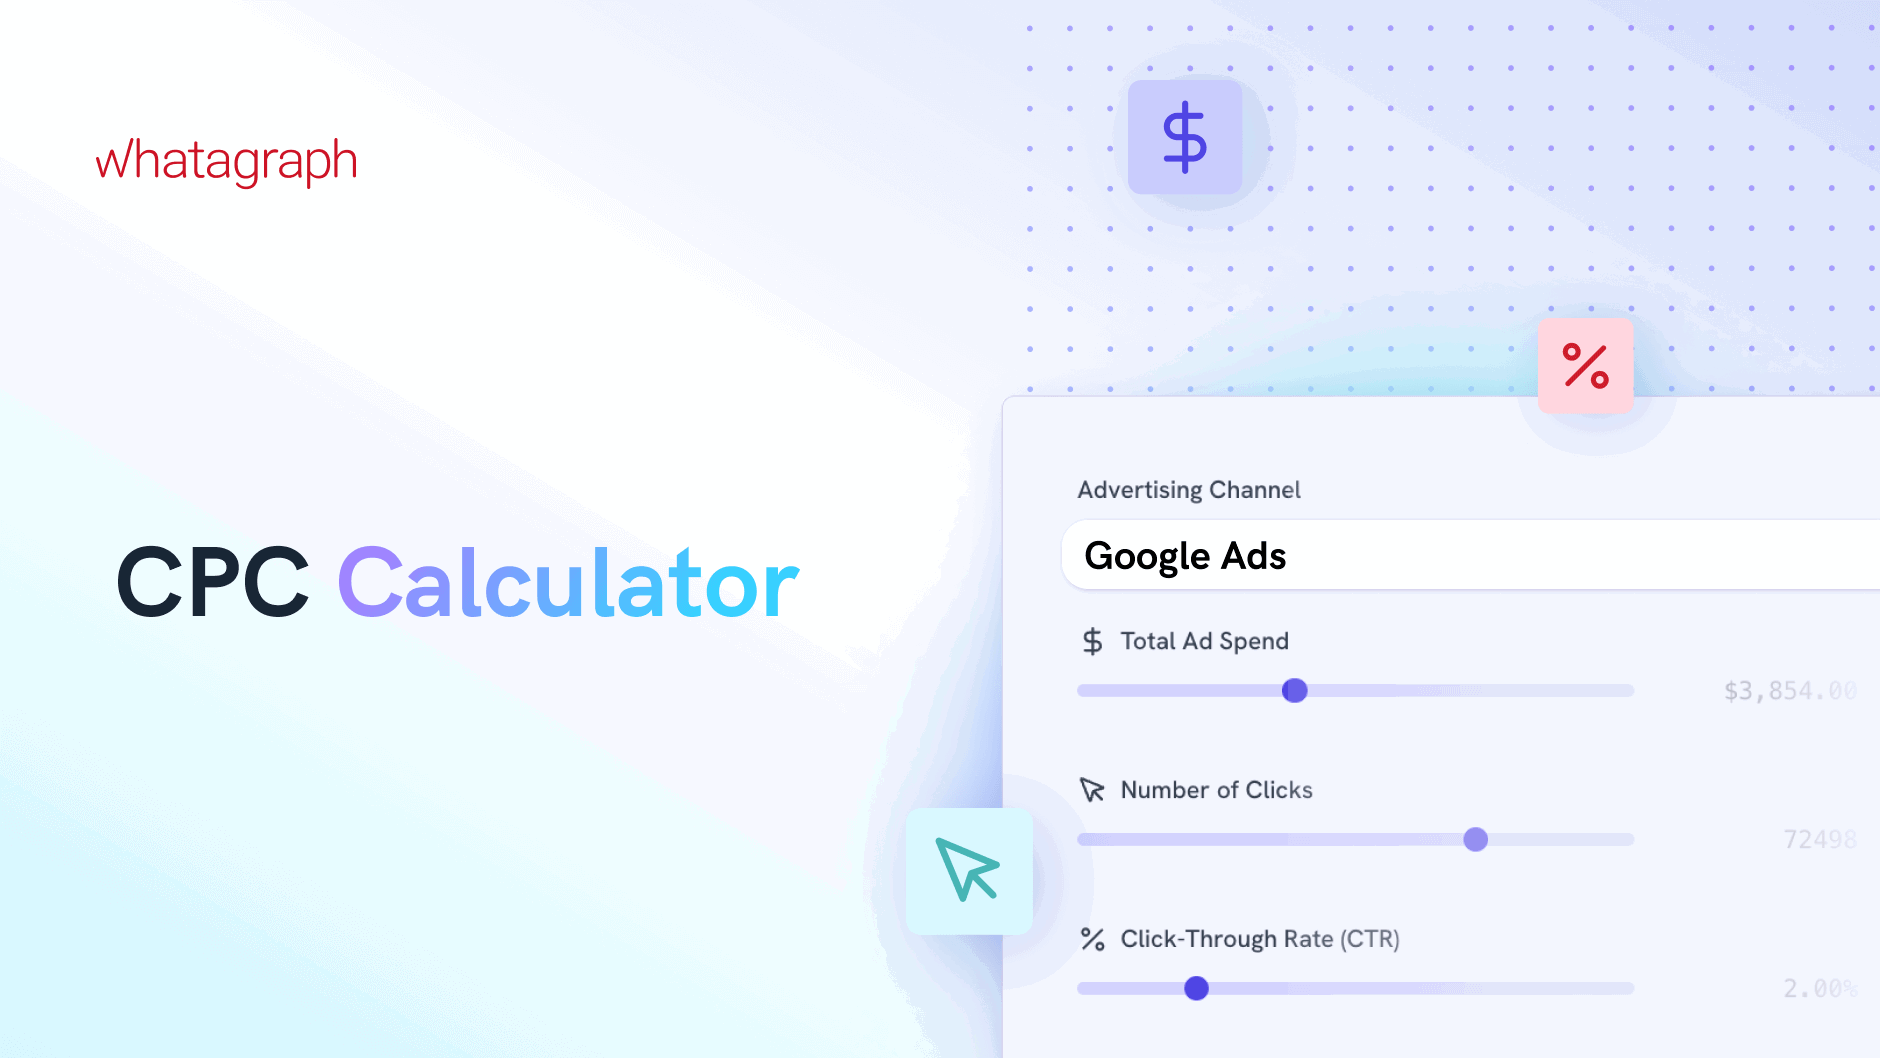
- CPC Calculator: Measure how much you’re paying for each click and compare it against benchmarks for your specific industry.
Want to benchmark your results? Here’s what good typically looks like:
- Click-Through Rate (CTR): The average CTR across all industries is 6.42%. (Source)
- Cost per click (CPC): The average CPC across all industries is $4.66. (Source)
- Conversion Rate: The average conversion rate across all industries is 6.96%. (Source) But this metric varies significantly by industry, with some sectors like Automotive Repair, Service, and Parts achieving rates as high as 12.96%. (Source)
