Supermetrics Connectors: Full List, Pricing, and Limitations
If you’re tired of manually exporting data from marketing platforms, Supermetrics probably landed on your radar.
At its core, Supermetrics helps you automate data transfers from marketing platforms into tools like Google Sheets, Looker Studio, and BigQuery.

Jun 18 2025●7 min read


But once you start digging into Supermetrics connectors, things can get confusing fast.
- What platforms can you actually connect to?
- How do the connectors work?
- Why are some labeled “Premium” or “Early Access”?
- And how much does it all cost?
In this guide, we’ll break it all down clearly – platform by platform. You’ll learn exactly what Supermetrics connectors do, which tools they support, and where the limitations show up.
Let’s get into it.
What are Supermetrics connectors?
Think of Supermetrics connectors as the “pipes” that move your marketing data from one place to another.
Instead of manually downloading reports from Google Ads, Facebook, or LinkedIn, and then uploading them into Google Sheets or Looker Studio, Supermetrics connectors automate that entire process.
They pull raw data directly from your marketing platforms and send it to a destination of your choice, whether it’s a spreadsheet, dashboard, or data warehouse.
But the catch is – Supermetrics itself doesn’t visualize that data. There are no internal dashboards or reports available. You’d still need to build them in an external business intelligence tool like Looker Studio or Power BI.
If you're a data-savvy marketer or BI specialist with an existing reporting setup and you just need reliable data extraction – Supermetrics connectors might fit the bill.
But if you’re looking for an all-in-one solution that not only pulls the data but also organizes, visualizes, and shares it with clients or teams, Whatagraph is the better option.
What platforms can I connect to using Supermetrics connectors?
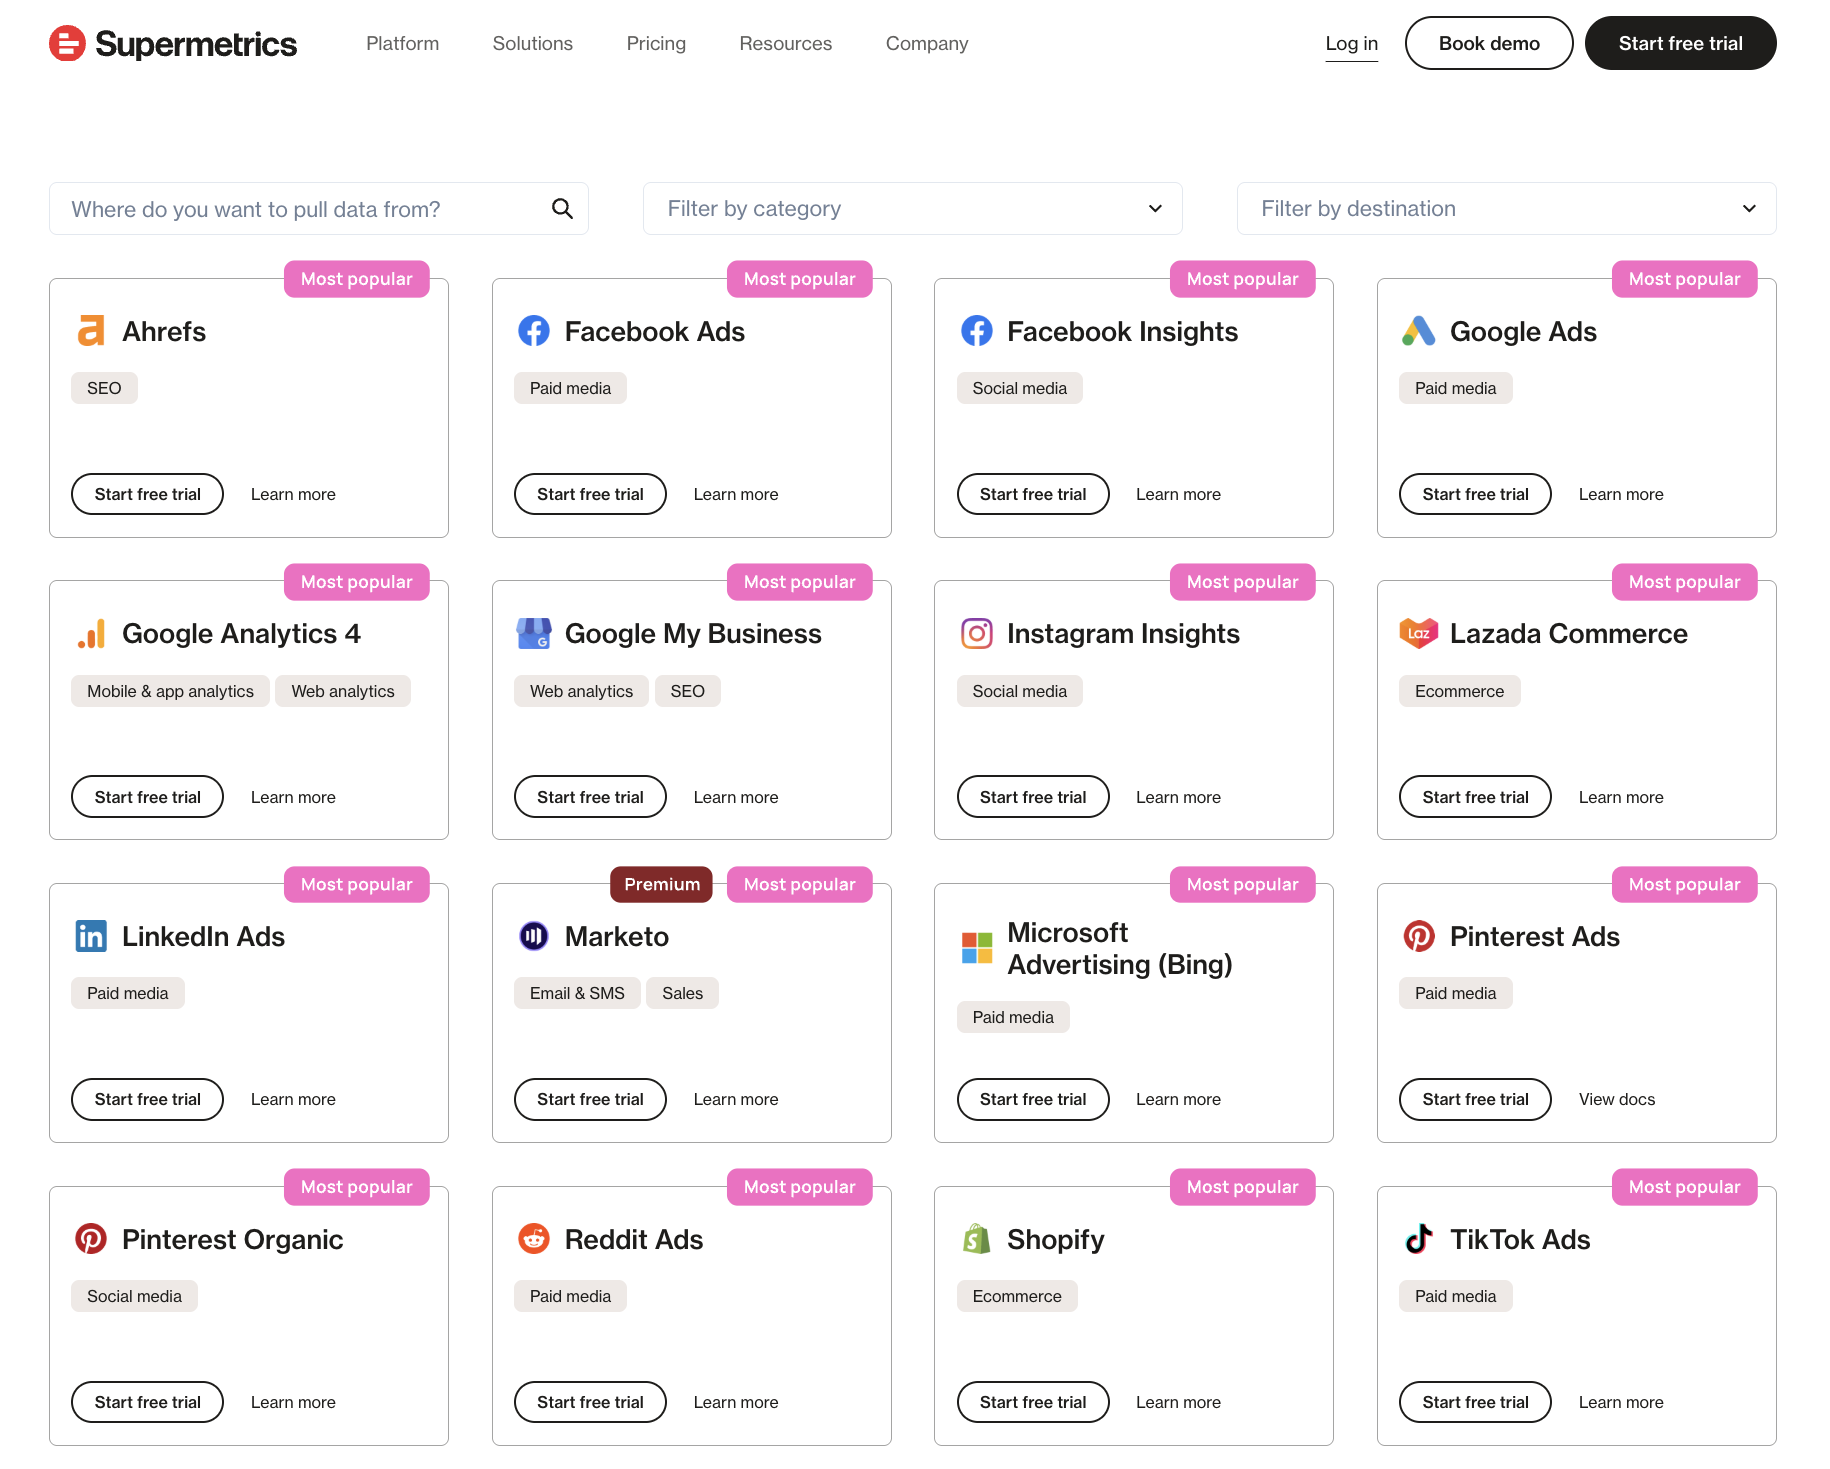 As of June 2025, there are 130+ Supermetrics integrations available, ranging from ad channels like Google Ads and Meta to analytics platforms like GA4 and ecommerce tools like Shopify.
But not all of these connectors are created equal.
Some are only available on higher-tier plans, others are still in beta, and a few require advanced setup or manual tweaks when they break.
One of our customers at Whatagraph – Tanja Keglić, Performance Marketing Manager at Achtzehn Grad agency – knew this pain all too well.
Tanja used to use Supermetrics and Looker Studio, but the connections frequently broke, sources failed to load properly, and she had to either waste time fixing them herself or contact Support for help. She told us:
It’s such a pain to reconnect a lot of sources and accounts on Supermetrics, and it takes so much time, which you don’t have when you want a quick report.
But this problem was solved when she switched to Whatagraph, an all-in-one marketing intelligence platform. She said:
We don’t have any connection issues on Whatagraph at all. We just connected the platforms once, and that was it. Whatagraph is also very, very quick when loading the data.
That being said, here’s a full Supermetrics connectors list, divided into nine different categories:
1. Paid per click (PPC)
Supermetrics is best known for its ad platform coverage. If you’re managing paid campaigns across multiple channels, you’ll likely find the major ones covered here.
- Google Ads
- Meta Ads (Facebook & Instagram Ads)
- LinkedIn Ads
- TikTok Ads
- Twitter/X Ads
- Pinterest Ads
- Snapchat Marketing
- Microsoft Advertising (Bing)
- Amazon Ads
- Reddit Ads
- Apple Search Ads
- Spotify Ads
Apart from these common ones, Supermetrics also covers the more obscure and niche platforms like:
- Taboola
- Yahoo! Japan Display Ads
- Yahoo! Japan Search Ads
- Yandex.Direct
- Adform (Premium)
- Adobe Advertising (Campaign Manager 360, DV360, SA360) (Premium)
- AdRoll (Premium)
- Adtraction (Premium)
- Amazon DSP (Premium)
- Basis
- Beeswax
- Celtra (Premium)
- Criteo (Premium)
- Criteo Retail Media (Premium)
- DoubleVerify (Premium)
- Flashtalking (Premium)
- Integral Ad Science (Premium)
- IQM (Premium)
- Kwai Ads
- LINE Ads
- Moloco DSP
- Nexxen DSP (Premium)
- Outbrain DSP (Zemanta) (Premium)
- Quantcast (Premium)
- RTB House (Premium)
- StackAdapt (Premium)
- Teads (Premium)
- The Trade Desk (Premium)
- Tradedoubler (Premium)
- Xandr (Premium)
- Yahoo DSP (Premium)
- Readpeak
- Quora Ads
- Shopee Ads (Early Access)
Each of these connectors pulls granular campaign-level data like impressions, clicks, CPCs, ROAS, and audience breakdowns.
Most of these data source connectors come included in standard plans, but for some niche or enterprise-level platforms (like Adobe Analytics or Campaign Manager 360), you’ll need a premium upgrade.
That said, the experience isn’t always plug-and-play. You’ll still need to pair these connectors with another tool (like Looker Studio or Sheets) to visualize the data, and occasional Supermetrics API changes can cause sync issues, so staying on top of your setup is key.
2. Mobile and web analytics
Supermetrics also connects with several popular web and mobile analytics tools so you can track organic traffic, site behavior, search rankings, and technical performance alongside your paid campaigns.
Here’s a full list of analytics tools available in Supermetrics:
- Google Analytics 4
- Google Search Console
- Google My Business
- Google Trends (Premium)
- Adobe Analytics 2.0 (Premium + Early Access)
- Matomo
- Moz
- Semrush Analytics
- Semrush Projects (Early Access)
- Similarweb (Early Access)
- Hotjar
- Mixpanel (Early Access)
- Amplitude (Early Access)
- Bing Webmaster Tools
- Google PageSpeed Insights
- Yandex.Metrica
- Piwik PRO
- Piano Analytics (AT Internet)
- Affluent (Premium)
- Yext (Premium)
- Adjust
- AppsFlyer
- Branch
- Apple Public Data
- Apple Search Ads
- Google Play Console
- Google Play Reviews
- Slack (used for internal comms tracking or notifications)
This mix means you can not only analyze user sessions on websites, but also app installs, attribution, in-app events, reviews, and even messaging workflows.
Note that Mixpanel and Amplitude are still in early access. The rest are available under standard plans and work across both marketing and product analytics workflows.
That said, several of these connectors (like Adobe Analytics, Google Trends, and Yext) require a premium plan or are still in early access – so depending on your setup, there may be extra cost or technical overhead to consider.
3. Social media
Need to report on more than just ad performance? Supermetrics also connects with social platforms to pull in organic insights like post reach, engagement, follower growth, and video views.
Here’s the full list of social media connectors:
- Facebook Insights
- Instagram Insights
- Pinterest Organic
- TikTok Organic
- X Organic (Twitter)
- Facebook Public Data
- Instagram Public Data
- LinkedIn Company Pages
- Pinterest Public Data
- YouTube Public Data
- Threads Insights
- Vimeo Public Data
- Meltwater (Premium)
- Smarp (Premium)
- Sprout Social (Status not specified)
This group is especially useful for social media teams that want to include organic performance data in client reports alongside paid results from the same platforms.
Most of these connectors are generally available. A few, like Meltwater and Smarp, require premium access. Sprout Social isn’t clearly labeled, so you may need to verify availability with Supermetrics support.
4. Sales
For teams that want to close the loop between marketing and revenue, Supermetrics also offers connectors for sales, CRM, and payment platforms. These are especially useful if you're trying to tie campaign performance to pipeline growth or actual revenue.
Here’s the full list of sales and revenue connectors:
- CallRail
- Close CRM (Early Access)
- Pipedrive
- Stripe
- Zoho CRM
- Marketo (Premium)
- Salesforce (Premium)
These connectors let you track sales data like lead volume, opportunity stages, call tracking, and revenue attribution.
Note that the two biggest enterprise players here – Salesforce and Marketo – require a premium plan. Close CRM is still in early access, so functionality or reliability may vary.
5. SEO
If you're working on organic search performance, Supermetrics offers several connectors that help you report on rankings, visibility, keyword data, and local SEO metrics.
Here’s the complete list of SEO-related connectors:
- Ahrefs
- Google Search Console
- Google My Business
- Bing Webmaster Tools
- Google Ads Keyword Planner (Early Access)
- Moz
- Semrush Analytics
- Semrush Projects
These connectors give you access to data like keyword positions, backlink profiles, local listing performance, and search visibility – all essential to track SEO ROI with dashboard reports.
Most are available under standard plans, but Google Ads Keyword Planner is still marked as early access. The rest are fully supported and widely used.
6. Email & SMS
Supermetrics also supports a solid lineup of email and SMS platforms, giving marketers access to campaign performance, audience engagement, and automation insights—all within their reporting workflows.
Here’s the list of connectors in this category:
- ActiveCampaign
- Brevo
- Campaign Monitor
- HubSpot (Premium – Unlimited Contacts)
- Klaviyo
- LiveIntent (Premium)
- MailChimp
- Newsletter2Go (Early Access)
- Omnisend
- Salesforce Account Engagement (Pardot) (Early Access)
- Salesforce Marketing Cloud (Early Access)
These connectors give access to email metrics like open rates, click-throughs, unsubscribes, and list growth, plus campaign-level insights from automation tools.
Most of the mainstream platforms – like MailChimp, Klaviyo, and ActiveCampaign – are fully supported on standard plans. Others, like HubSpot (Unlimited Contacts) and LiveIntent, fall under the premium category, while a few Salesforce-based products are still in early access.
7. eCommerce
For performance marketers and ecommerce teams, Supermetrics offers a variety of connectors designed to track product sales, cart activity, customer lifetime value, and marketplace performance across storefronts and ad channels.
Here’s the complete list of ecommerce-related connectors:
- Shopify
- WooCommerce
- Lazada Commerce
- Shopee Commerce (Early Access)
- BigCommerce
- Adobe Commerce (Magento 2)
- Amazon Seller Central
- Google Merchant Center
- Squarespace Commerce (Early Access)
- Recharge
- PrestaShop (Early Access)
- Prisjakt
- Criteo Retail Media (Premium)
- Bambuser (Premium)
- Lazada Ads (Early Access)
These connectors allow teams to track everything from product performance and fulfillment metrics to inventory insights and revenue attribution.
While core platforms like Shopify, WooCommerce, and Amazon Seller Central are generally available, more specialized tools – like Criteo Retail Media and Bambuser – fall under Supermetrics’ premium tier. Others are still in early access, so their functionality may evolve over time.
8. Feedback and reviews
For businesses that rely on reputation, customer sentiment, and user experience feedback, Supermetrics also offers connectors that pull in data from major review sites and survey platforms.
Here’s the full list of supported review and feedback-related connectors:
- Capterra Reviews
- G2 Reviews
- Glassdoor Reviews
- Indeed Reviews
- Tripadvisor Reviews
- Yelp Reviews
- Simplesat
These connectors are useful for aggregating user reviews, tracking changes in ratings over time, and identifying common themes in customer feedback.
9. Data infrastructure and utility
These connectors don’t fit neatly into marketing categories—but they’re critical for teams managing data operations, internal workflows, or custom reporting pipelines.
Here’s the list:
- Clockify
- Harvest
- Facebook Billing Data (Early Access)
- Google Ads Account Explorer (Early Access)
- Google Sheets (Early Access)
- Google Sheets (Legacy) (Early Access)
- Google BigQuery
- Snowflake
- Database
- JSON/CSV/XML
- Ignite (Premium)
These tools help extend Supermetrics’ capabilities into raw data formatting, custom querying, and operational insights especially for advanced teams blending marketing and internal ops data.
How do Supermetrics connectors work?
Supermetrics connectors serve as pipelines between your marketing data sources (like Google Ads or Facebook) and your reporting destinations (like Looker Studio or BigQuery).
Here’s how the process works, based on official guidance from Supermetrics’ Support Center:
Step 1: Connect to Supermetrics Data Sources
You start in the Supermetrics Hub, where you can view, add, or manage your data connections:
- Visit the Data Sources page.
- Scroll to Connect to new data source.
- Hover over a platform (e.g., Google Ads) and click Connect.
- Choose to make the connection shared (team-wide) or private (user-only).
- Authenticate using your credentials or API login.
You can also share an authentication link with external stakeholders. This is useful if you don’t have direct access to the account. Links are valid for 12 hours.
Here's a handy video from Supermetrics on how to authenticate connectors:
Step 2: Add, Replace, or Reauthenticate Connections
Once a connector is active, you can:
- Add new connections to the same source (e.g., multiple Facebook ad accounts).
- Replace existing connections (e.g., if a team member leaves).
- Reauthenticate when credentials expire or APIs time out.
These actions help keep your queries running smoothly, especially in shared team environments.
Step 3: Build and Schedule Queries
After connecting, you define what data you want to pull:
- Choose metrics (e.g., clicks, conversions).
- Select dimensions (e.g., date, campaign, region).
- Apply filters and date ranges.
Then, you send this data to a destination like:
- Google Sheets or Excel
- Looker Studio or Power BI
- BigQuery, Snowflake, or another warehouse
Most destinations support scheduled refreshes, with options varying by plan and platform.
Step 4: Send to Destination
Once your query is configured, Supermetrics sends the data to your chosen destination:
- Spreadsheets: Google Sheets, Excel
- Dashboards: Looker Studio, Power BI
- Warehouses: BigQuery, Snowflake
Each destination supports different functionality—for example, Looker Studio supports visualizations, while BigQuery is for storage and advanced querying.
Step 5: Schedule Data Refresh
You can set up scheduled refreshes to keep your data up to date:
- Spreadsheets: Up to 5 automatic refreshes per day (per file)
- Looker Studio: Schedule depends on Google’s limits
- Warehouses: Refresh frequency depends on your Supermetrics plan
Some data sources also allow historical data loading, but this often requires a higher-tier plan or is capped by API limitations.
Step 6: Maintain & Troubleshoot
Here’s where things get tricky:
- Connectors may break when APIs change
- Data may partially load or fail if your account permissions shift
- Some sources have strict rate limits or require re-authentication
Supermetrics does offer support, but priority help is typically reserved for premium customers. Non-technical users may find it challenging to debug issues without help.
In short: Supermetrics connectors are powerful if you know how to use them – but they’re not “set it and forget it.” You’ll still need to build and maintain the workflows, troubleshoot sync issues, and handle reporting outside of Supermetrics itself.
Can you use Supermetrics connectors for reporting?
Technically, yes you can.
Supermetrics doesn’t offer built-in reporting or data visualization, but you can send the data to another reporting or BI tool.
Here are some popular options:
- Looker Studio (prev. Google Data Studio): This is the most popular destination for Supermetrics users. It’s free, visual, and great for lightweight dashboards. But it struggles with large datasets, has rigid formatting, and requires time to design reports manually.
- Google Sheets or Excel: Flexible and familiar, but entirely manual. Formatting, formulas, and visuals are up to you. Great for deep analysis, not ideal for automated reporting.
- Power BI or Tableau: These are powerful business intelligence tools for advanced users. You’ll need technical know-how to model the data and build dashboards, but they offer excellent scalability and visualization control.
Supermetrics does offer some pre-made templates for all these reporting tools so you don't have to start from scratch.
But no matter where you send your data, you’ll still need to:
- Format and update reports regularly
- Troubleshoot broken queries or data mismatches
- Export or share the reports with stakeholders
We broke down more of this “two-tool” workflow in this honest and in-depth Supermetrics review.
If you want a solution that combines data connectors + pre-built reports + automation + sharing, that’s where platforms like Whatagraph shine.
From connecting to your data sources, to cleaning it up, to visualizing and sharing it, Whatagraph takes care of your entire data journey.
We built Whatagraph specifically to eliminate the friction points that marketers and agencies run into with tools like Supermetrics.
Here’s how we simplify your reporting workflow:
✅ All-in-one platform: Connect data, visualize it, and share reports without needing Looker Studio, Sheets, or BI tools.
✅ No-code setup: Use pre-built report templates for platforms like Google Ads, Meta, and LinkedIn. Go from connection to report in minutes.
✅ Automated workflows: Schedule data refreshes, email reports, and live sharing – all handled inside Whatagraph.
✅ Agency-ready features: Manage multiple clients, collaborate with teammates, and assign report access—all in one workspace.
✅ Transparent pricing: Get all your connectors and destinations under a single plan – no hidden upcharges for adding tools or users.
✅ Less maintenance, fewer breakdowns: No dealing with broken connectors, query errors, or constant reauthentication.
With Whatagraph, you don’t just get data pipelines, you get finished, polished, and automated reporting, end-to-end.
For an in-depth breakdown of how Whatagraph compares against Supermetrics, check out this Supermetrics alternatives article.
How much do Supermetrics connectors cost?
Supermetrics charges based on how many connectors (data sources), destinations, users, and accounts per data source you need. While the entry-level pricing might look simple, it can scale quickly depending on your setup.
Here’s a breakdown of what each plan includes and what extras to watch out for:
| Plan | Price (billed annually) | Data Sources | Users | Accounts per Source | Refresh Frequency |
| Starter | $29/month | 3 | 1 | 3 | Weekly |
| Growth | $159/month | 7 | 2 | 7 | Daily |
| Pro | $399/month | 10 | 3 | 10 | Hourly |
| Business | Custom | Unlimited | Custom | Custom | On-demand |
Note: All plans support a single destination by default (e.g., Google Sheets or Looker Studio). Additional destinations (e.g., BigQuery or Snowflake) may require separate subscriptions or upgrades.
What counts toward your connector limit?
Each of the following counts against your usage:
- Each platform (e.g., Google Ads, Meta Ads) = 1 data source
- Each platform account (e.g., three Google Ads accounts) = 3 accounts
- Each destination (Sheets, Looker Studio, etc.) = additional plan or fee
- Each user = limited by your plan unless you upgrade
So if you're managing Facebook Ads for three clients and pushing that data to both Sheets and Looker Studio, that could already consume:
- 1 data source (Meta Ads)
- 3 accounts
- 2 destinations
- 1–2 users
You can see how quickly cost can balloon.
Add-on costs and upgrades
All Supermetrics pricing plans come with the option to "bolt on" extras, including:
- Additional data sources
- Additional accounts per data source
- More users
- More frequent refreshes (if you're on lower tiers)
- Access to premium or warehouse destinations (e.g., Snowflake, BigQuery)
So, how much can you expect to pay?
Taking all this into consideration, most marketing teams or agencies managing 5–15 clients find themselves spending between $600–$1,200/month, especially if they need:
- More than one destination
- Premium connectors (e.g., Amazon DSP, Salesforce)
- High-frequency syncing (hourly or on-demand)
- Access for multiple team members or stakeholders
And remember – Supermetrics only handles data transfer. You still need to build and maintain dashboards in Looker Studio, Sheets, or another BI tool.
Meanwhile, Whatagraph’s pricing is all-inclusive, because we know how predictable pricing is important for marketing agencies and teams.
You get:
✅ 55+ native and stable data connectors
✅ Unlimited internal dashboards and external reports
✅ Unlimited data blends, custom metrics and dimensions
✅ AI performance summary writer and chatbot to extract insights
✅ A dedicated Customer Success Manager
✅ Live chat support that replies within 4 minutes
Talk to us, we’d love to show you around.
Published on Mar 10 2023
WRITTEN BY
YamonYamon is a Senior Content Marketing Manager at Whatagraph. With an eye for detail and a knack for always considering context, audience, and business goals to guide the narrative, she's on a mission to create genuinely helpful content for marketers. When she’s not working, she’s hiking, meditating, or practicing yoga.