Supermetrics Pricing in 2025: What You’re Really Paying For
Supermetrics is a powerful tool for data integration, but its pricing model is complex and varies by destination.
This guide breaks down each pricing tier, helps you find the right plan, and explores cost-effective alternatives.

Mar 27 2025●5 min read
Supermetrics acts as the “middleman” of data. It pulls data from platforms like Facebook and Google Analytics 4 and passes it to third-party tools like Looker Studio.
Its pricing is based on pay-per-destination—and different add-on fees (such as extra data sources) 2x the total cost. This is a big concern for agencies that need predictable, stable costs to stay profitable.
So, I’ve put together this guide to help you better understand Supermetrics pricing and judge whether it’s the right fit for you.
Here, you’ll find:
- The different Supermetrics plans & pricing structures explained
- My thoughts on Supermetrics' add-on costs & hidden fees
- Supermetrics pricing compared to its competitors
Supermetrics Pricing Explained (Structure & Factors)
The basic concept you need to know is that Supermetrics pricing depends on the data destination you want to move your data to (e.g. Looker Studio and Google Sheets).
So, for example, if you want to move data to both Looker Studio and BigQuery, you pay for separate plans for each.
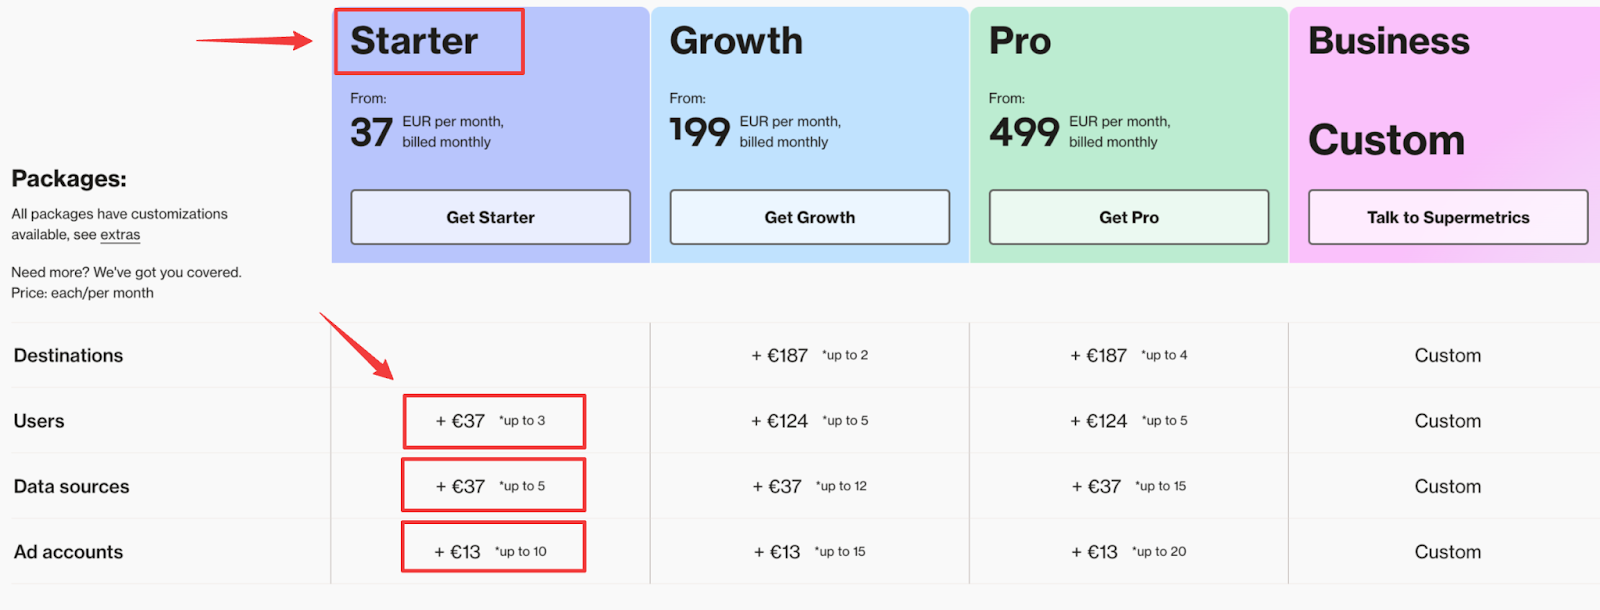
Supermetrics standard pricing plans range from $37 to $499/month per data destination. For reference, here is Supermetrics’ pricing for Looker Studio:
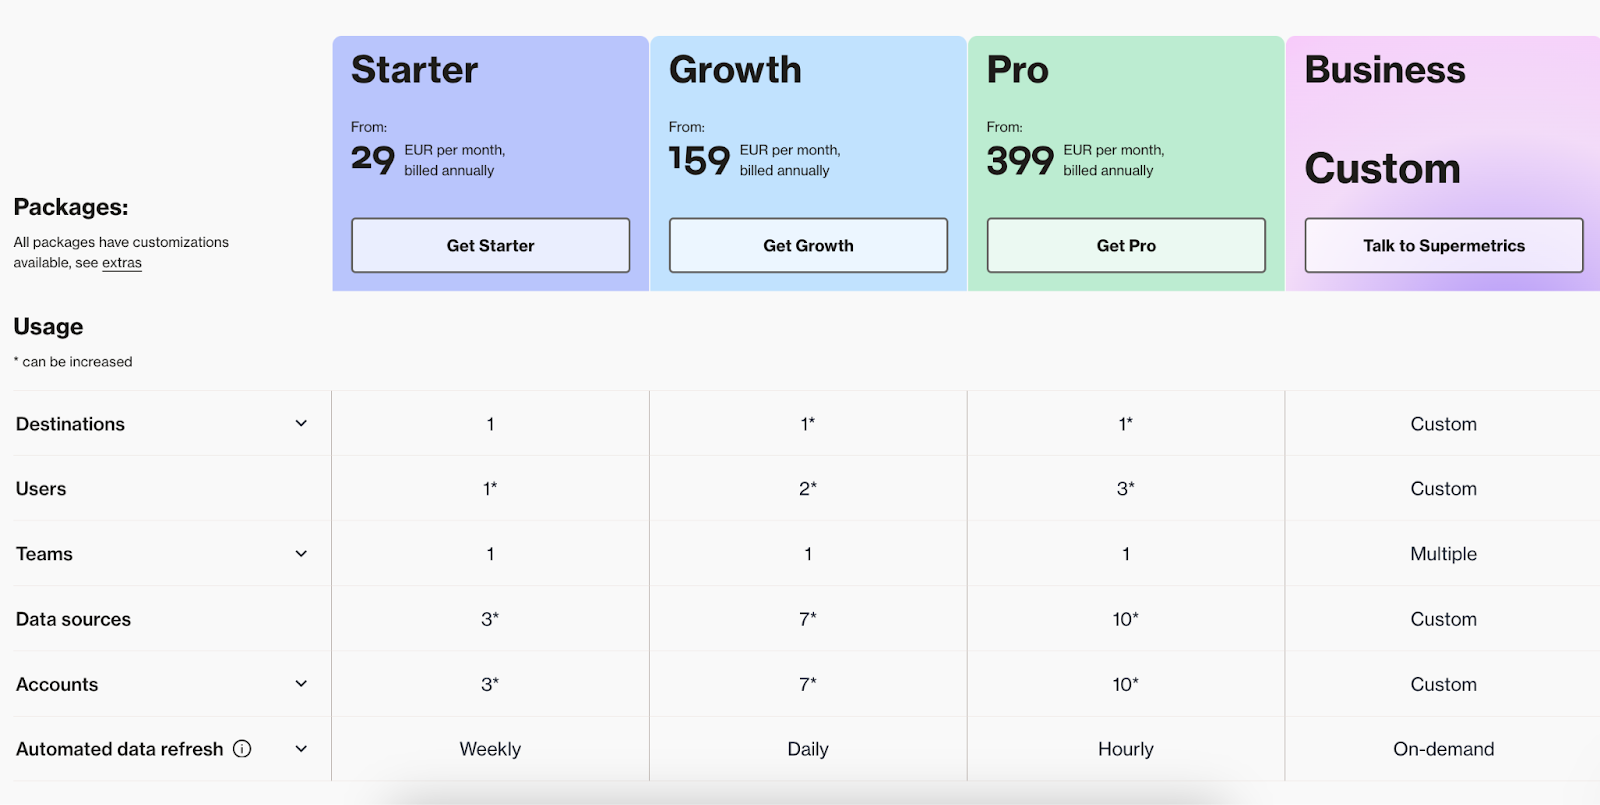 Each plan contains a set number of data sources, users, accounts, and data refreshes. If you exceed your plan limits (which can happen quite easily), you’ll need to pay extra:
- Data destinations: Each additional data destination costs a minimum of $187/month.
- Users: The cost for each new user account is between $37 and $124/month for the standard plans.
- Data sources: Data sources refer to the platforms from which you pull data (e.g., Facebook ads). Each additional data source costs $37/month.
- Ad accounts: If you need to pull data from additional ad accounts, there is an extra cost of $13/month per ad account involved.
- Supermetrics Charts: To extend Looker Studio’s visualization capabilities, a Charts add-on is available starting from $124/month.
Supermetrics' key selling point is that there are no data volume fees. This means you're not charged based on how much data you move but based on how many destinations you transfer data to.
Even so, I find it hard to deny that the many add-ons and separate plans for each data destination can drive up the price substantially.
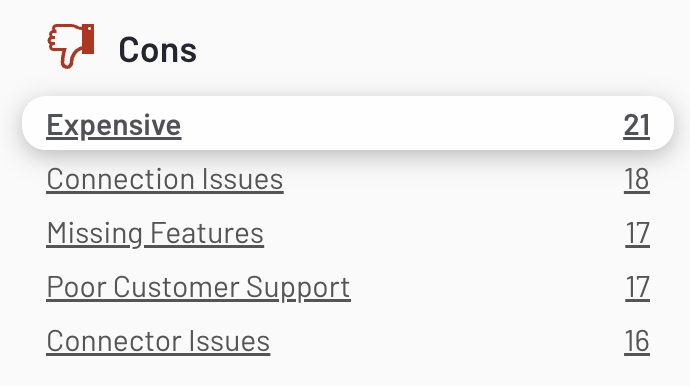
In fact, the biggest “con” of Supermetrics on G2.com is that it’s expensive.
This Capterra review also summarizes the general sentiment around pricing perfectly:
 But what’s more concerning is, Supermetrics’ connectors break often, and you’ll need to either:
- Waste time manually reconnecting the data sources
- Contact their customer support team and wait for the issues to be fixed
This is what we hear most from our customers who previously used Supermetrics and Looker Studio, and what we see on G2 reviews as well: In fact, connector issues are so common that it’s the second-biggest con of Supermetrics:
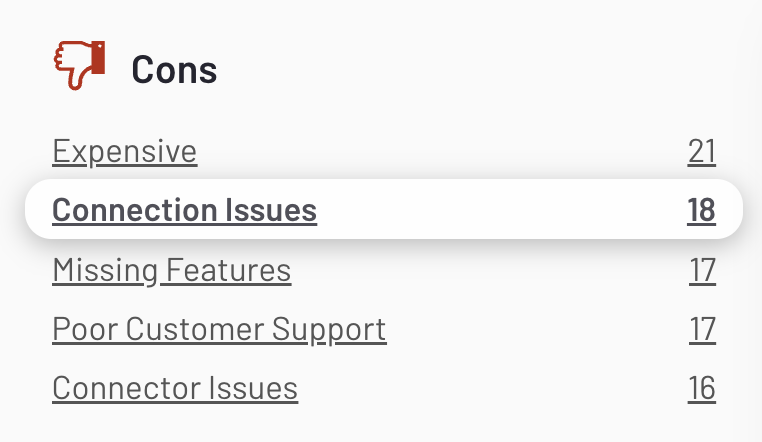 This is a huge deal-breaker for most agencies because when connectors break, the data on your reports becomes inaccurate, and clients lose trust in them.
The unpredictable pricing and connection issues are the biggest reasons why agencies and teams are looking for Supermetrics alternatives that are stable, seamless, and offer more bang for your buck.
But before we get ahead of ourselves, let's look at the different pricing plans available on Supermetrics.
Supermetrics Pricing Breakdown
In total, Supermetrics offers 15 pricing packages, 4 of which are publicly listed and 11 of which are based on a custom quotation.
You can pay monthly or annually, and you'll receive a 20% discount if you pay annually.
Each data destination comes with a different pricing package, so I've explained all of them below in simple overview tables.
Supermetrics Pricing with Google Sheets
Supermetrics lets you pull data from different sources into Google Sheets. The pricing plans for it start at $37/month and go up to $499/month.
Below is an overview table for all of the Supermetrics pricing plans for Google Sheets:
| Pricing plan | Pricing | Users | Accounts | Data sources | Data refresh |
| Starter | $37/month | 1 user | 3 accounts | 3 data sources of your choice | Weekly |
| Growth | $199/month | 2 users | 7 accounts | 7 data sources of your choice | Daily |
| Pro | $499/month | 3 users | 10 accounts | 10 data sources of your choice | Hourly |
| Business | Custom | Custom user limit | Custom account limit | Select from all data sources | On-demand |
Outside of the basic plans, Supermetrics also offers a Business plan, which is priced on a custom quote basis.
Supermetrics Pricing with Looker Studio
Supermetrics standard pricing plans for Looker Studio range from $37 to $499/month.
For a summary of each plan, see my overview table below:
| Pricing plan | Pricing | Users | Accounts | Data sources | Data refresh |
| Starter | $37/month | 1 user | 3 accounts | 3 data sources of your choice | Weekly |
| Growth | $199/month | 2 users | 7 accounts | 7 data sources of your choice | Daily |
| Pro | $499/month | 3 users | 10 accounts | 10 data sources of your choice | Hourly |
| Business | Custom | Custom user limit | Custom account limit | Select from all data sources | On-demand |
Supermetrics Pricing with Power BI
Supermetrics offers three standard pricing plans for Power BI, ranging from $37/month to $499/month. The Business plan is based on a custom quotation.
Here is what each plan involves:
| Pricing plan | Pricing | Users | Accounts | Data sources | Data refresh |
| Starter | $37/month | 1 user | 3 accounts | 3 data sources of your choice | Weekly |
| Growth | $199/month | 2 users | 7 accounts | 7 data sources of your choice | Daily |
| Pro | $499/month | 3 users | 10 accounts | 10 data sources of your choice | Hourly |
| Business | Custom | Custom user limit | Custom account limit | Select from all data sources | On-demand |
Supermetrics Pricing with Microsoft Excel
Like for the other plans, Supermetrics pricing for Microsoft Excel ranges from $37 to $499/month for the standard plans.
Each plan includes the following:
| Pricing plan | Pricing | Users | Accounts | Data sources | Data refresh |
| Starter | $37/month | 1 user | 3 accounts | 3 data sources of your choice | Weekly |
| Growth | $199/month | 2 users | 7 accounts | 7 data sources of your choice | Daily |
| Pro | $499/month | 3 users | 10 accounts | 10 data sources of your choice | Hourly |
| Business | Custom | Custom user limit | Custom account limit | Select from all data sources | On-demand |
Supermetrics Add-Ons Pricing
For an additional cost, Supermetrics lets you add extra seats, data sources, ad accounts, and destinations for their pricing plans.
The add-on prices are as follows:
| Pricing plan add-ons | Destinations | Users | Data sources | Ad accounts | Supermetrics Charts |
| Starter | Not available | $37/month for each new user | $37/month for each extra data source | $13/month for each extra ad account | Not available |
| Growth | $187/month for each extra destination | $124/month for each new user | $37/month for each extra data source | $13/month for each extra ad account | $124/month |
| Pro | $187/month for each extra destination | $124/month for each new user | $37/month for each extra data source | $13/month for each extra ad account | $124/month |
| Business | Custom | Custom | Custom | Custom | Custom |
Each plan has a limit on the number of add-ons you can add.
For example, the Starter plan lets you add three extra users, the Growth plan lets you add five extra users, and the Pro plan lets you add five extra users.
Supermetrics API Pricing
Supermetrics API lets you pull data from third-party platforms like Shopify and HubSpot. Supermetrics offers separate pricing for its API, and you must contact its sales team for a custom plan. There is no public information on the pricing or what it includes.
Supermetrics Pricing with Other Data Sources
In addition to the above pricing packages, Supermetrics integrates with 10 other data sources, but the prices are based on a custom quotation:
- Google BigQuery
- Azure Synapse
- Azure Storage
- Google Cloud StorageAmazon Redshift
- Amazon S3
- Snowflake
- Google AlloyDB
- Azure SQL Database
- SFTP
Hidden Costs & Pricing Considerations
Supermetrics charges based on data destinations, number of users and ad accounts, and API refresh rates.
With so many variables, it’s no surprise that many users find Supermetrics’ pricing complex and expensive. And I completely get that.
The price rises exponentially as you add more users and sources, which is a common complaint among customers.
One G2 user put it this way, “The price… pretty sure that is the one common denominator with everyone using or having used Supermetrics.” For example, the Starter plan only includes one user seat and the price doubles for one additional seat.
Then, for every additional data source, you'll pay $37 per month. When you start adding up other Supermetrics costs, such as add-ons, it becomes clear that it isn't affordable.
 Many users are also forced to upgrade to more expensive plans because the data refreshes only once every week or day in the Starter and Growth plans:

For agencies that rely on real-time data, the lack of it is a significant drawback—especially because alternatives like Whatagraph guarantee a 30-minute data refresh rate.
Another complaint from customers is Supermetrics’ price increases. One agency owner on Reddit mentioned that their subscription cost doubled during their use:
 As an agency owner, you'll want a platform you know you can rely on years from now— and 100% price increases won't help with that.
Which Supermetrics Plan Is Best for You?
Now that I’ve explained Supermetrics’ pricing plans, the question is:
Which one should you choose (or is there an alternative with clearer pricing)?
If you choose Supermetrics, here’s what I recommend:
- Starter plan - starts from $37/month: Best for small agencies looking to get started with data consolidation.
- Growth plan - starts from $199/month: Best for mid-size teams that require more data and automation.
- Pro plan - starts from $499/month: Best for mid-size teams and small enterprises that need hourly data refreshes and better integrations.
- Business plan - based on a custom quotation: Best for enterprises requiring unlimited data sources and team collaboration features.
For the most part, if you only need raw data connectors, Supermetrics can be a good choice.
But if you need more than just data consolidation (like data visualization and reporting), Supermetrics is not the best solution.
Supermetrics doesn’t have its own data visualization dashboard, so you have to use an external tool like Looker Studio to visualize data – and this is where connectors break and reports become unreliable.
If you need data connections, visualizations, and transfers, an all-in-one marketing intelligence platform like Whatagraph is a better investment.
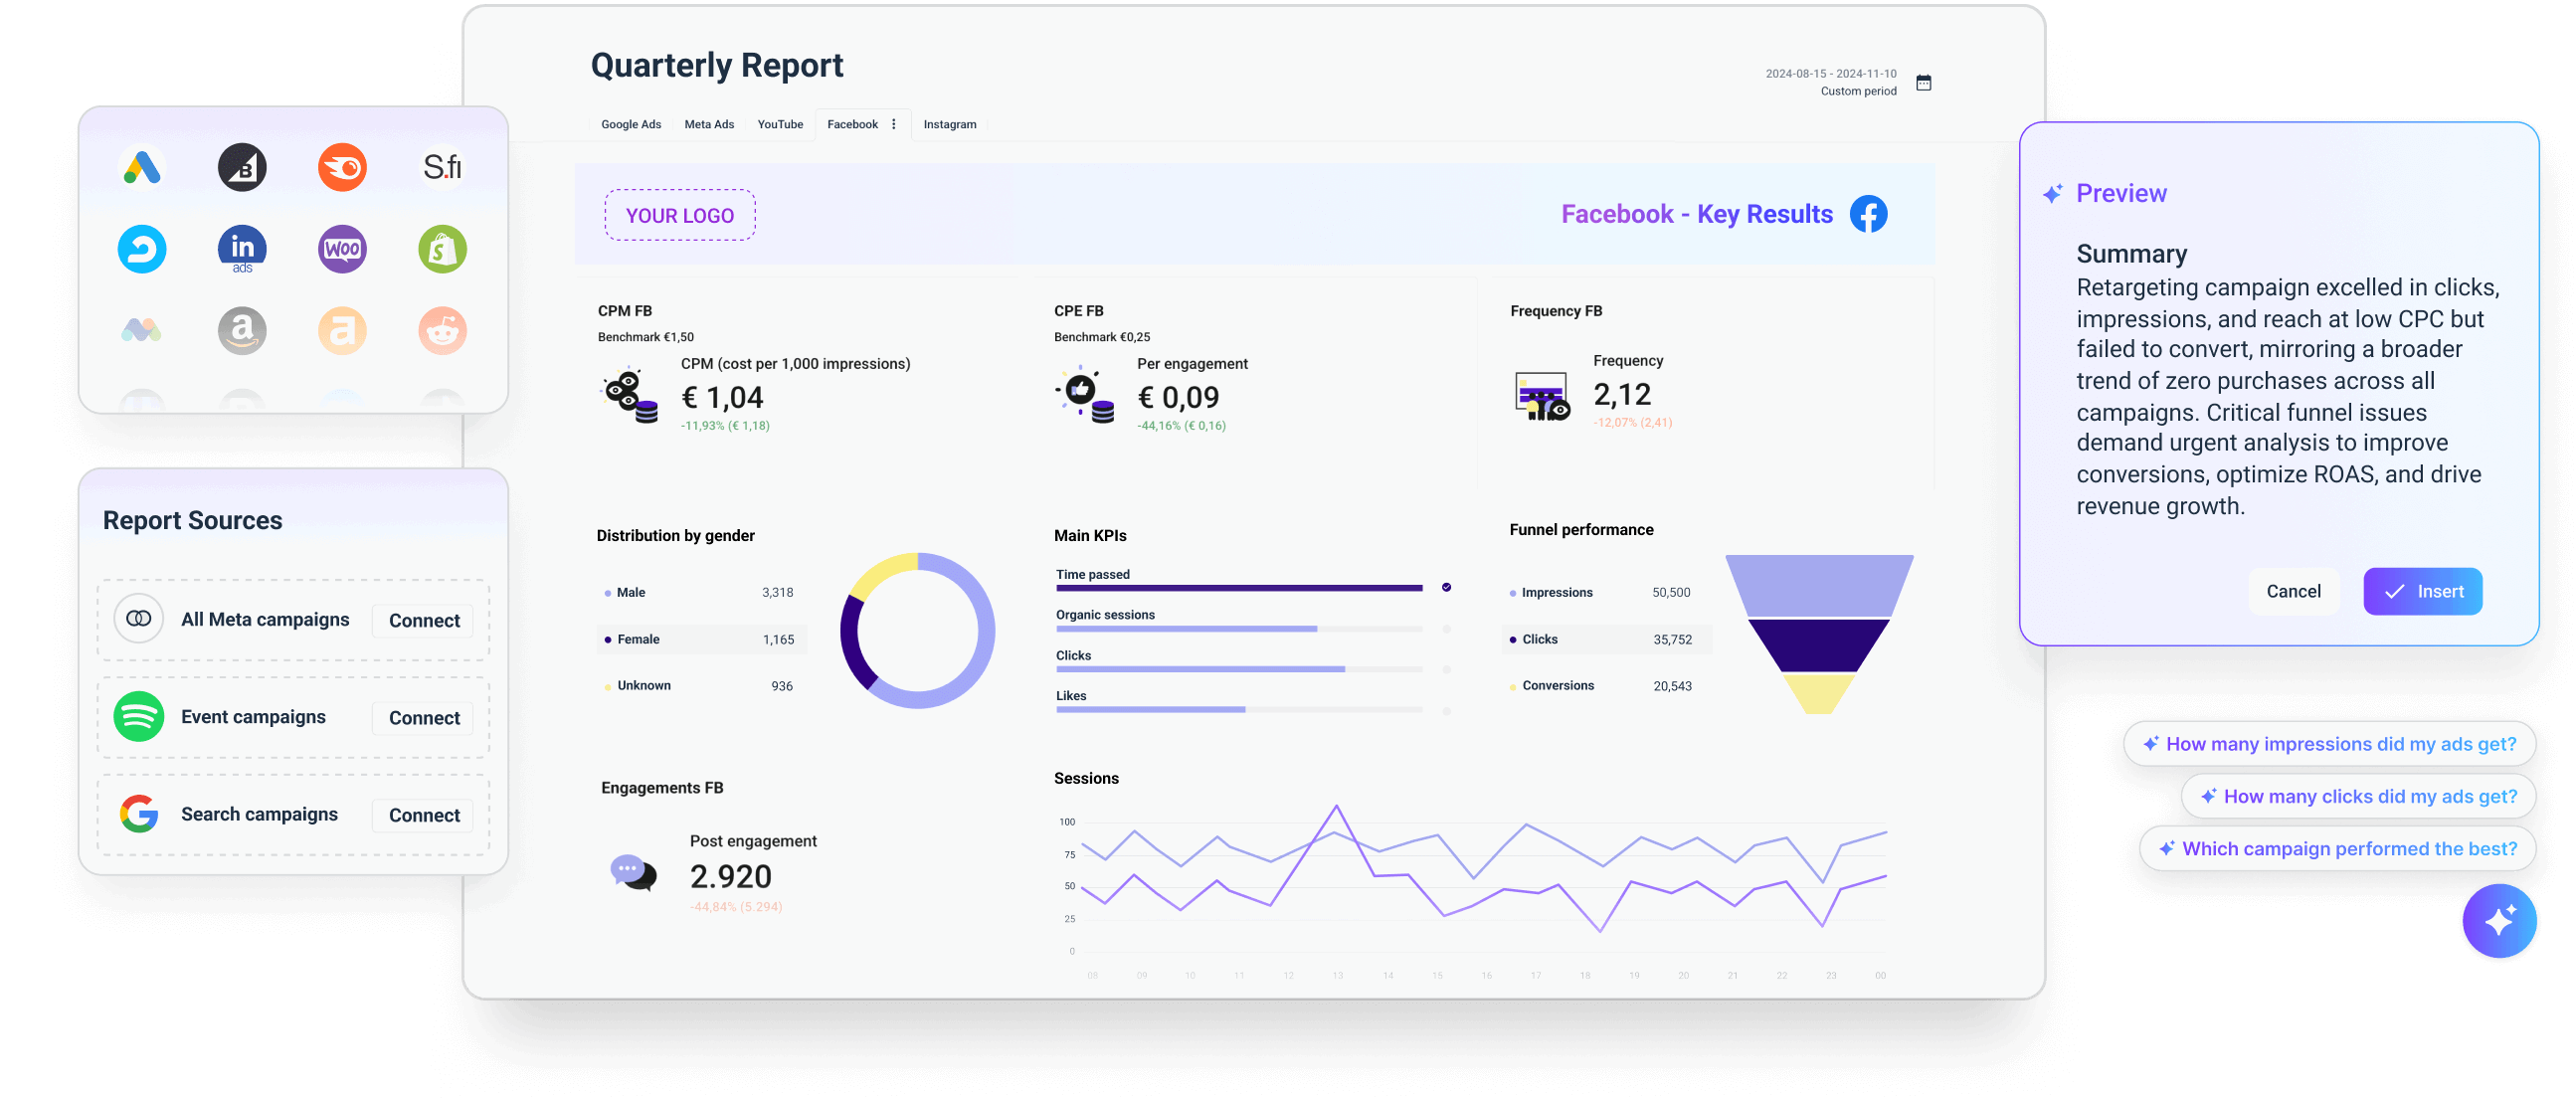
With Whatagraph’s all-in-one platform, you simply connect all your channels and can start visualizing data right away—no extra tools needed.
This means:
✅ There are no connection issues. Your data flows in seamlessly from your source platform (e.g. Google Ads) to Whatagraph.
✅ Your data is safe, secure, and organized on one platform.
✅ You don’t need to jump from one marketing platform to another.
✅ You don’t need to bother your accounting team with different invoices—just one invoice and done.
Supermetrics vs. Whatagraph Pricing
While Supermetrics offers pay-per-destination pricing with different add-on costs, Whatagraph offers transparent, all-in-one pricing based on the number of source credits.
You can use the source credits to connect data sources, send data to warehouses, and blend cross-channel data together.
Whatagraph’s fixed pricing model means agencies know exactly what they’re paying for. The pricing includes:
- ALL integrations and channels (55+)
- 30-minute consistent data refresh rate
- Unlimited team members and reports
- A dedicated customer success manager
- Instant, human live chat that operates 18/5
- 100+ marketing report templates
For more differences between Supermetrics and Whatagraph pricing, see the below overview table:
| Feature | Supermetrics | Whatagraph |
| Pricing Model | Pay per destination | Fixed, all-in-one pricing |
| Ease of Use | Requires setup & API | Plug-and-play, easy setup |
| Data Visualization | No built-in dashboards | Fully customizable reports |
| White-Labeling | No | Yes, with client branding |
| Integrations | 100+ | 55+ but fully managed (we're also adding new integrations every month) |
If you want a data transfer and reporting tool with fully transparent pricing, we suggest switching from Supermetrics to Whatagraph.
Final Verdict – Is Supermetrics Worth It?
So, is Supermetrics worth the money?
My opinion is if you’re a small team using Supermetrics just to gather data and ship it to platforms like Looker Studio, the pricing plans can be worth it.
If you’re looking to do anything more than that, such as creating reports, Supermetrics is not the best fit. The platform lacks tools for creating white-label reports and does not support exporting, such as sharing links or downloading PDFs.
This means you would need to use a third-party data visualization tool along with Supermetrics to collect and report on your data fully. And then, we’ve seen that Supermetrics’ connectors break frequently when shipping your data to a reporting tool like Looker Studio.
Alternatively, you can select Whatagraph’s all-in-one marketing data platform from the get-go. Whatagraph makes it incredibly easy to collect, visualize, monitor, and report on your marketing data.
Unlike Supermetrics, Whatagraph covers the entire data journey on one platform—from data connections and transformations to visualizations and data transfers.
Reach out to us for a pricing plan and product walkthrough, designed just for you.

WRITTEN BY
Elmeri PalokangasElmeri is a content strategist and writer helping SaaS firms scale up with long and short-form content. He has written dozens of SEO- and conversion-optimized blog articles for SaaS brands like Atera, Cognism, Scribe, Drip, QuickMail, Time Doctor, and TechnologyAdvice. When he's not working, he's off exploring Switzerland's stunning mountains.