


What is a Google Analytics 4 reporting tool?
At its core, a Google Analytics 4 reporting tool is a system that automatically pulls your GA4 data and visualizes it in easy to understand formats for clients and stakeholders who aren’t in the weeds.
Instead of logging into GA4, exporting CSVs, and formatting everything in a spreadsheet, you get a single, polished report that tells the full website performance story.
For instance, a Google Analytics report tool like Whatagraph helps you:
✅ Understand website performance fast (e.g. which pages are losing organic traffic) without being buried in spreadsheets (hint: just ask AI on Whatagraph)
✅ Track and monitor website trends closely (super important during the recent turbulent SEO times)
✅ Get notified every day about performance changes
✅ Take proactive action before clients and stakeholders start asking questions
✅ Send white-labeled, easy to understand GA4 reports to clients and automate delivery via email or Slack
What should a GA4 reporting tool do, and what to look for in one
The Google Analytics reporting tool you choose needs to:
- Cut through the complexities of GA4.
- Offer fast and accurate reporting across your other channels with customization and time-saving features.
Here are key features to consider:
Easy to use
The reporting tool should be intuitive and easy to navigate. Any marketer, no matter technical expertise, should be able to create professional reports without much training.
Also, the tool should come with a library of ready-made report templates tailored for GA4 and other channels. This can considerably save you the time needed to build reports from scratch.
Offers flexible custom options
You should be able to customize reports to create specific views, dimensions, and metrics as needed.
The reporting tool should offer different visualization options so you can easily interpret the data and present it to clients or stakeholders.
Look for reporting software that lets you white-label any report without help from designers or developers.
Presents accurate and stable data
A good GA4 reporting tool should create realtime reports which give you quick actionable insights.
If you regularly analyze and report on large data volumes, consider a tool that integrates directly with BigQuery. This way you can have accurate data without sampling issues at any time.
Integrates with multiple data sources
You should be able to integrate GA4 data with other platforms like CRM systems, advertising platforms ( PPC, display, and programmatic), social media, and other marketing tools.
Apart from multi-source reports, the tool should let you combine GA4 data with other data sets to create holistic performance reports.
Automates your process
The tool should let you automate the whole reporting process and schedule regular updates to clients and stakeholders without your intervention.
Automated reporting has several benefits:
✅ Saves time: Automated insights give you the most important findings while you use the time for more creative tasks.
✅ Identifies trends and patterns: You can more easily spot trends and patterns that may escape you otherwise. A tool with an alerting capability can notify you of sudden spikes or dips in traffic so you can take quick action.
✅ Make better decisions: By understanding the trends and patterns, you can make better decisions about your marketing strategy. You can use automated insights to discover:
- Which marketing campaigns are most effective.
- If changes to your landing pages improve UX and conversion rates.
Helps you store historical data
Since GA4 keeps your data up to 14 months, you should pick a reporting tool that lets you report on longer periods.
Look for a reporting platform with an ETL feature that automates transfers from GA4 to your data warehouse and then uses the accumulated data to create reports.
What are the best GA4 reporting software?
GA4 gives you data. It doesn't give you a client-ready report, a branded dashboard, or a performance summary your stakeholders can actually act on. That's where third-party GA4 reporting software comes in.
Here's a quick look at the best options on the market right now.
1. Whatagraph: Best GA4 reporting software for agencies
Whatagraph is a marketing intelligence platform built for agencies that need to connect, organize, and share GA4 data without touching a single spreadsheet.
It pulls GA4 data automatically, blends it with 60+ other sources, and lets you build fully branded, client-ready reports in minutes using AI. Automated delivery, live links, BigQuery exports — everything runs on schedule without manual work.
Whatagraph has also launched an MCP that lets you connect your data to Claude or ChatGPT and analyze your data there.
2. TapClicks: Best for large agencies with complex operations
TapClicks is a comprehensive website performance tracker and marketing operations platform with 150+ integrations and strong workflow management. It works well for enterprise teams managing multiple stakeholders — but the interface feels dated and customization is limited compared to modern alternatives.
3. Databox: Best for real-time dashboard snapshots
Databox is a solid web analytics tracker that consolidates data into interactive dashboards for teams that need quick performance snapshots. The downside: agencies often spend 15–30 hours a month wrestling with setup, and the rigid dashboard format forces extra workarounds for client-ready reports.
4. AgencyAnalytics: Best for white-labeled reporting with basic customization
AgencyAnalytics is a white-label Google Analytics website tracker with solid Google Ads reporting tools integration. It's easy to get started, but you hit a ceiling fast — no master templates, slow data updates (2–3 days), and limited automation mean it doesn't scale well for busy agencies.
5. DashThis: Best for straightforward multi-channel reporting
DashThis pulls data from 50+ platforms into pre-built dashboard templates. It's affordable and quick to set up, but customization is limited and the insights experience feels more like a Word document than a modern reporting platform.
6. Swydo: Best for small teams with simple reporting needs
Swydo is a budget-friendly website traffic monitor tool for smaller agencies with basic needs. But it hits a hard cap of 50 sources per report, has no advanced data blending, and can't export to data warehouses, making it a poor fit for agencies planning to grow.
Want to get the full breakdown of these tools like key features, pricing, and real user reviews? Check out this best SEO reporting tools article.
How agencies are winning with Whatagraph’s Google Analytics reporting software
Instead of telling you why Whatagraph is the best for agencies and teams, we’ll show you with these three success stories:
1. Maatwerk Online: 100 hours saved per month on reporting
Challenges
Maatwerk Online was running on a Looker Studio + Supermetrics stack that was slow, bloated, and constantly breaking.
Dashboards took 15+ minutes to load, connectors failed without warning, and reports were crammed with dozens of metrics nobody looked at.
"I got the feeling we were actually rebuilding Google Analytics," said Lars. "There were so many metrics and tables that no one was using."
Solution
The team switched to Whatagraph and built four reusable report templates, eCommerce, Leadgen, Branding, and B2B, that covered 90% of clients out of the box.
They used Whatagraph IQ's AI Widget Creator to build report widgets instantly, and IQ Chat to answer client questions live in meetings, without digging through dashboards.
Results
- 100 hours saved per month on reporting
- $4,000 saved per year by eliminating Supermetrics
- 100% of reporting costs covered by client licensing fees
Whatagraph saves time and energy, and the hours we're saving is just pure profit. We now have the time to focus on more strategic things that help both our agency and our clients grow. - Lars Maat, Co-Founder at Maatwerk Online
2. Peak Seven: 63 hours saved per month, clients retained
Challenges
Peak Seven was using Looker Studio with Funnel and Supermetrics to handle non-Google data, and the setup was constantly breaking.
Data either didn't pull through or came through wrong, forcing Kim Strickland to spend hours manually cross-checking figures before every client meeting.
"The first report I created on Looker Studio took me 40 hours," Kim recalled. "It's just not a very user-friendly system."
Solution
Kim built a "Master" template for franchise clients and simply swapped out data sources for each new report, cutting report creation time from 4 hours to 1.5 hours.
Custom formulas combined data from different platforms into one accurate view. Clients got live links to always-fresh dashboards they could check anytime.
Results
- 63 hours saved per month across 25 reports
- $9,450 saved per month for clients on reporting time
- Report build time cut from 4 hours to 1.5 hours
Whatagraph is now our Bible, both for our clients and internal teams. - Kim Strickland, Digital Marketing Specialist, Peak Seven
3. Dtch. Digitals: 50% decrease in client churn
Challenges
As Dtch. Digitals scaled to 340 clients, their old reporting tool couldn't keep up.
Static PDF reports with basic number tables failed to engage clients, and inconsistent reporting across team members made onboarding new employees a nightmare.
"I was convinced that if we kept using the old tool, we wouldn't be able to scale up," said Stef Oosterik, Quality Manager.
Solution
Dtch. Digitals moved 250 clients onto Whatagraph in just one month.
They created four white-labeled report templates — E-commerce B2C, E-commerce B2B, Lead gen B2C, and Lead gen B2B — that standardized reporting across the entire team. Every client received a monthly report and a live dashboard link, fully branded to match their new identity.
Results
- 50% decrease in client churn
- 340 active clients managed on one platform
- 10% reduction in reporting tool costs
Whatagraph not only helps us get clients on board, but also to keep them within the agency. Our churn rate is very, very low. - Stef Oosterik, Quality Manager, Dtch. Digitals
How do I track website performance with Whatagraph’s GA4 reporting tool?
Tracking website performance and reporting in GA4 doesn't have to mean logging into the platform every morning, exporting CSVs, and spending half your day formatting data before a single insight is delivered.
With Whatagraph, you go from raw GA4 data to insights ready to share with clients in under 30 minutes.
Here's how:
1. Connect your GA4 property
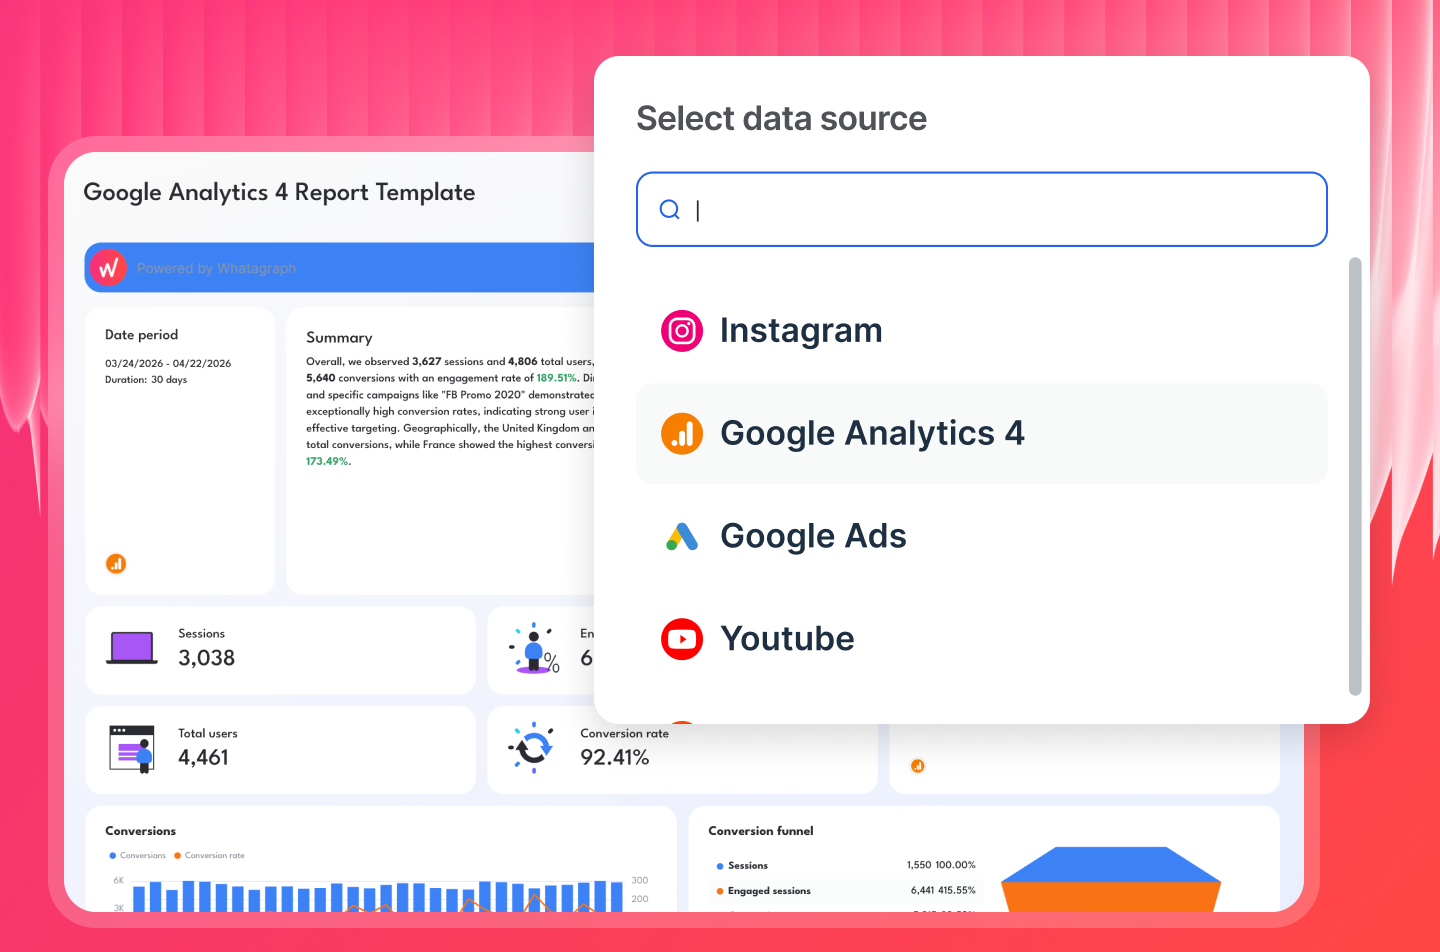
Start by connecting your Google Analytics 4 account directly from your Whatagraph workspace.
Select GA4 from the source list, authenticate with your Google login, and you're done. No APIs, no third-party connectors, no dev work. Setup takes under five minutes.
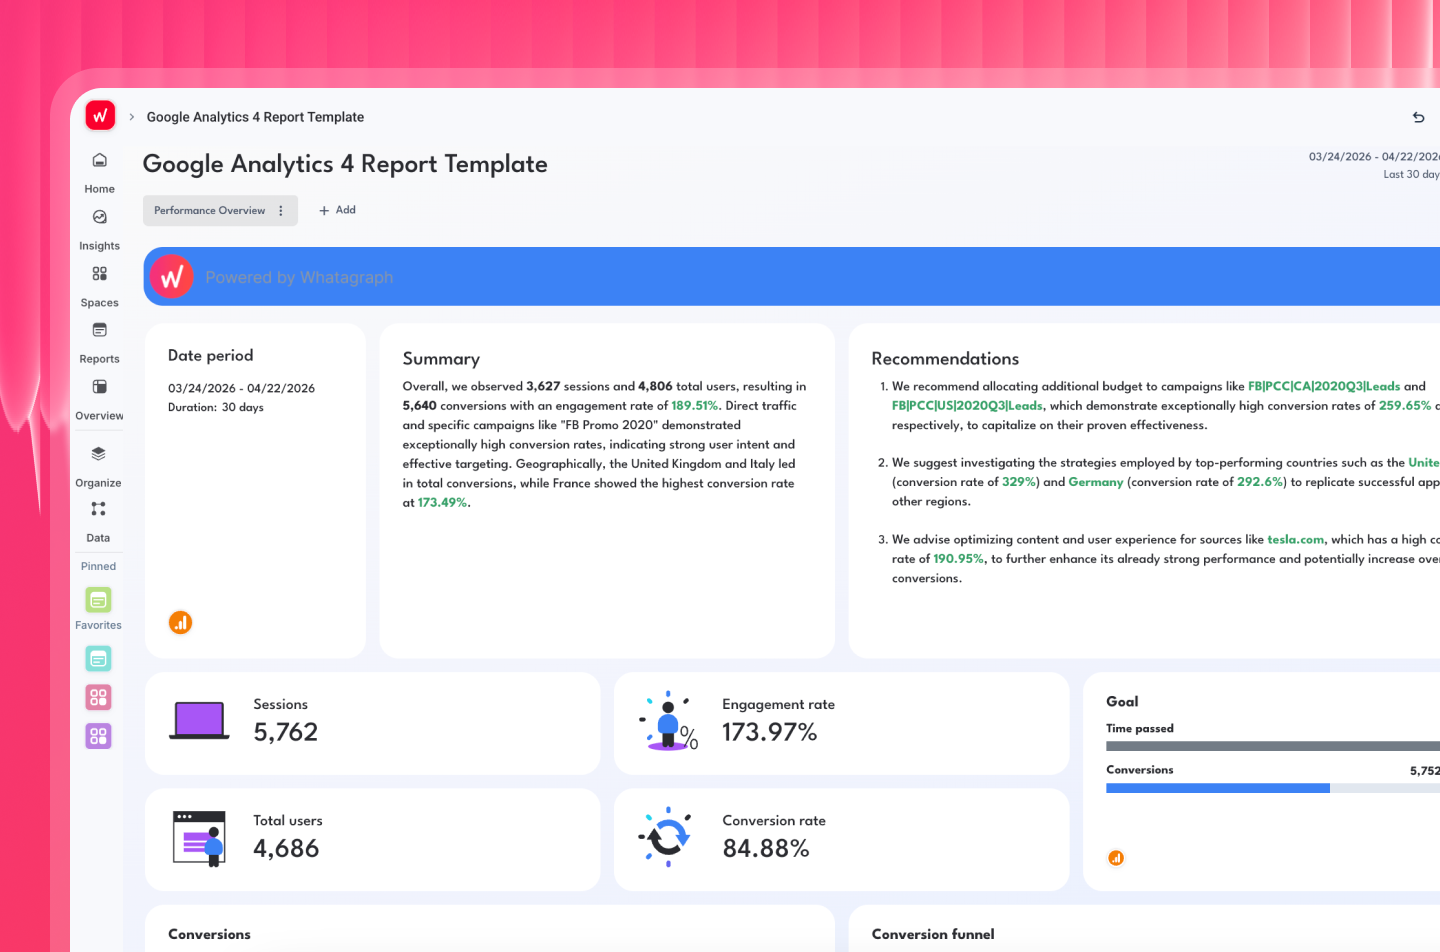
Your data starts flowing immediately - sessions, users, engagement rate, conversions, traffic sources, landing page performance - all of it, pulled automatically into your Google Analytics marketing dashboard.
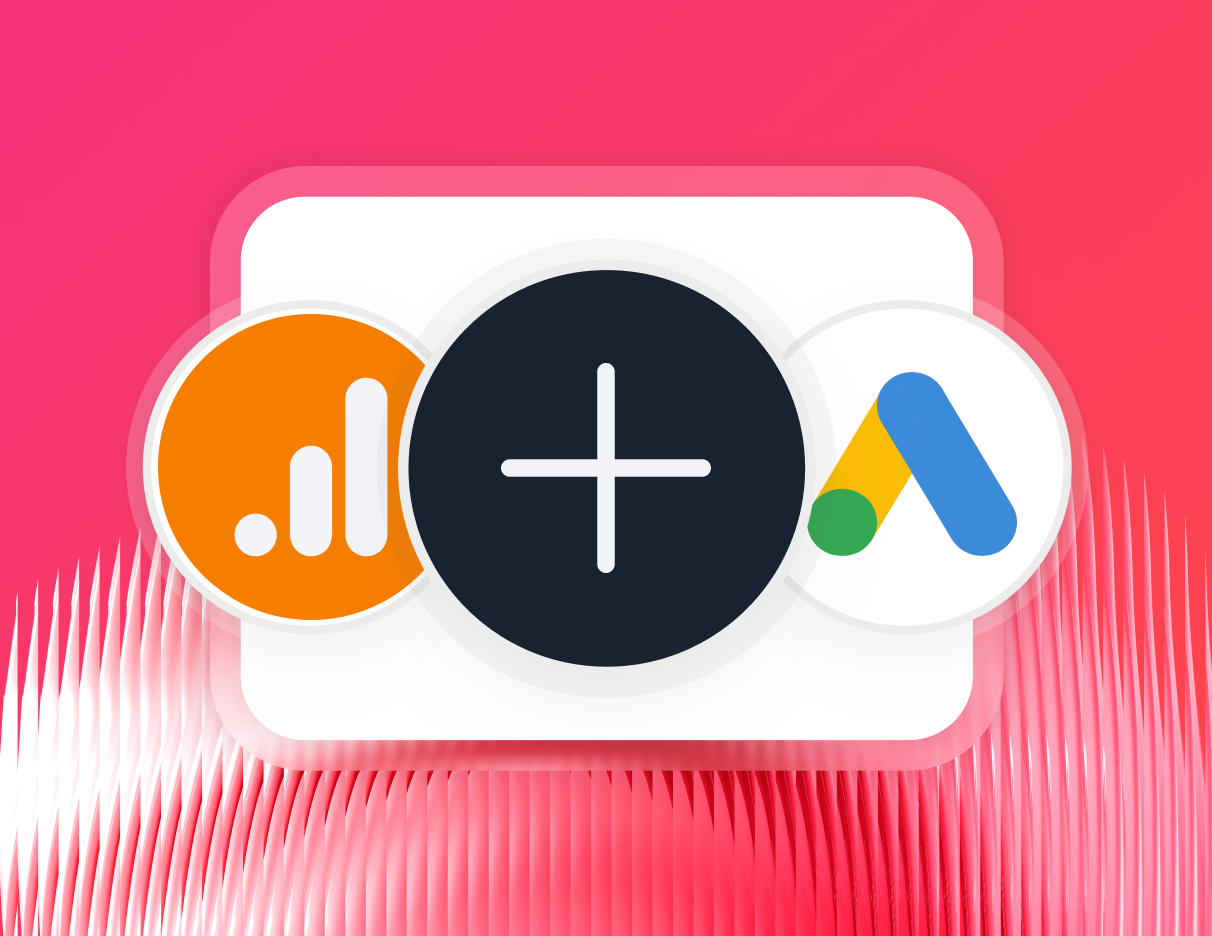
2. Blend GA4 with your other channels
GA4 tells you what's happening on your website. Your other channels tell you why.
Once your GA4 property is connected, add your other sources — Google Ads, Search Console, Meta, LinkedIn, Semrush — and bring everything into one unified report.
Want to see how your paid campaigns are driving site engagement? Or how organic search is contributing to conversions? Blend the data, and Whatagraph organizes it into clean, cross-channel views your clients can actually follow.
No formulas, no manual stitching, no separate reports for each channel.
3. Build your Google Analytics client report in seconds
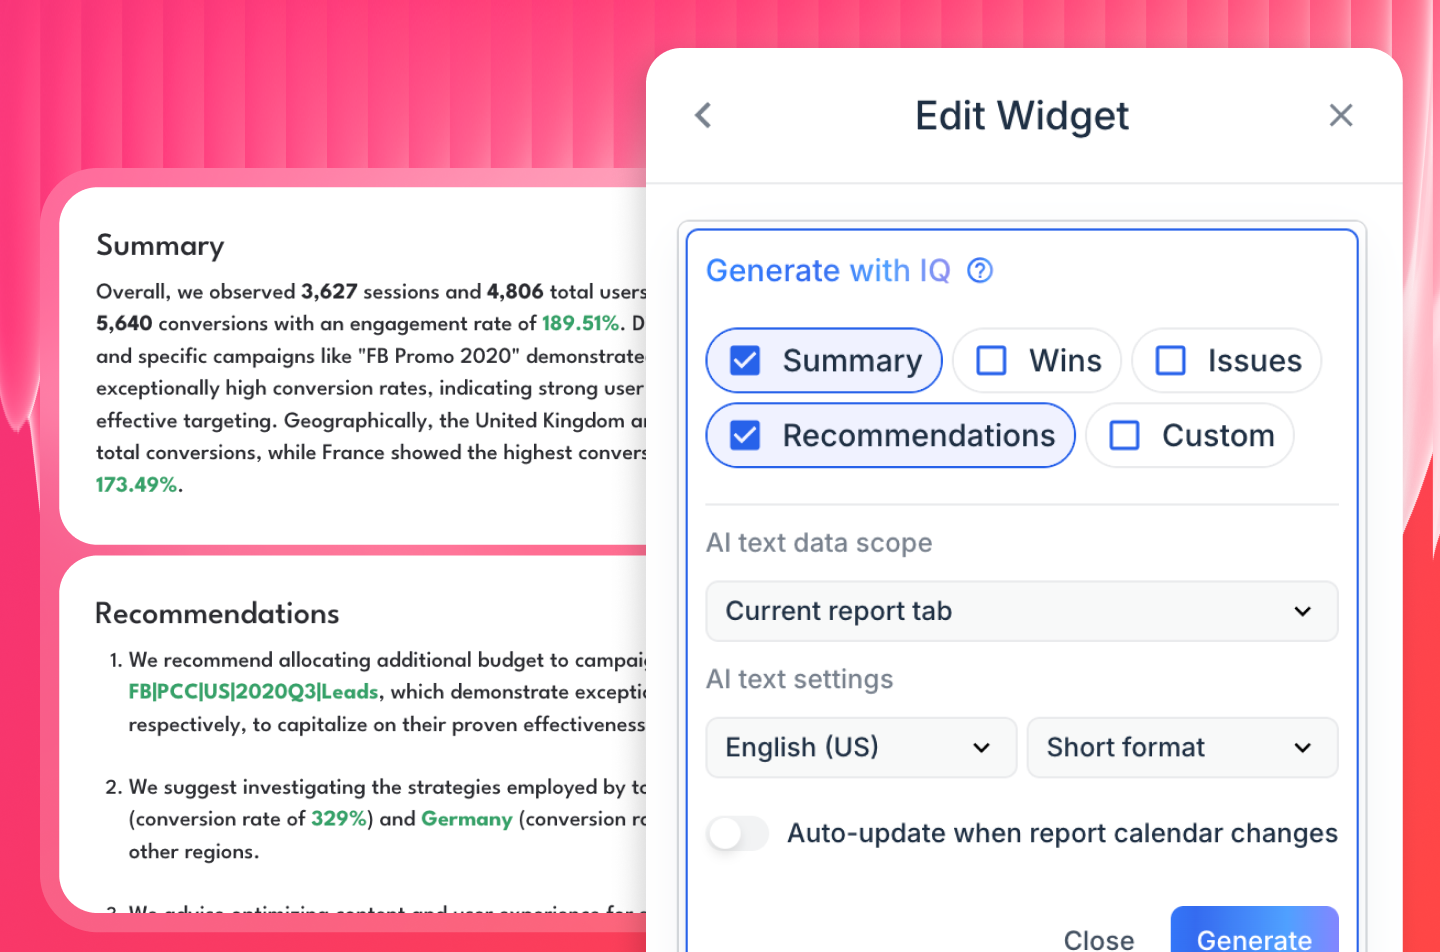
This is where Whatagraph IQ changes everything.
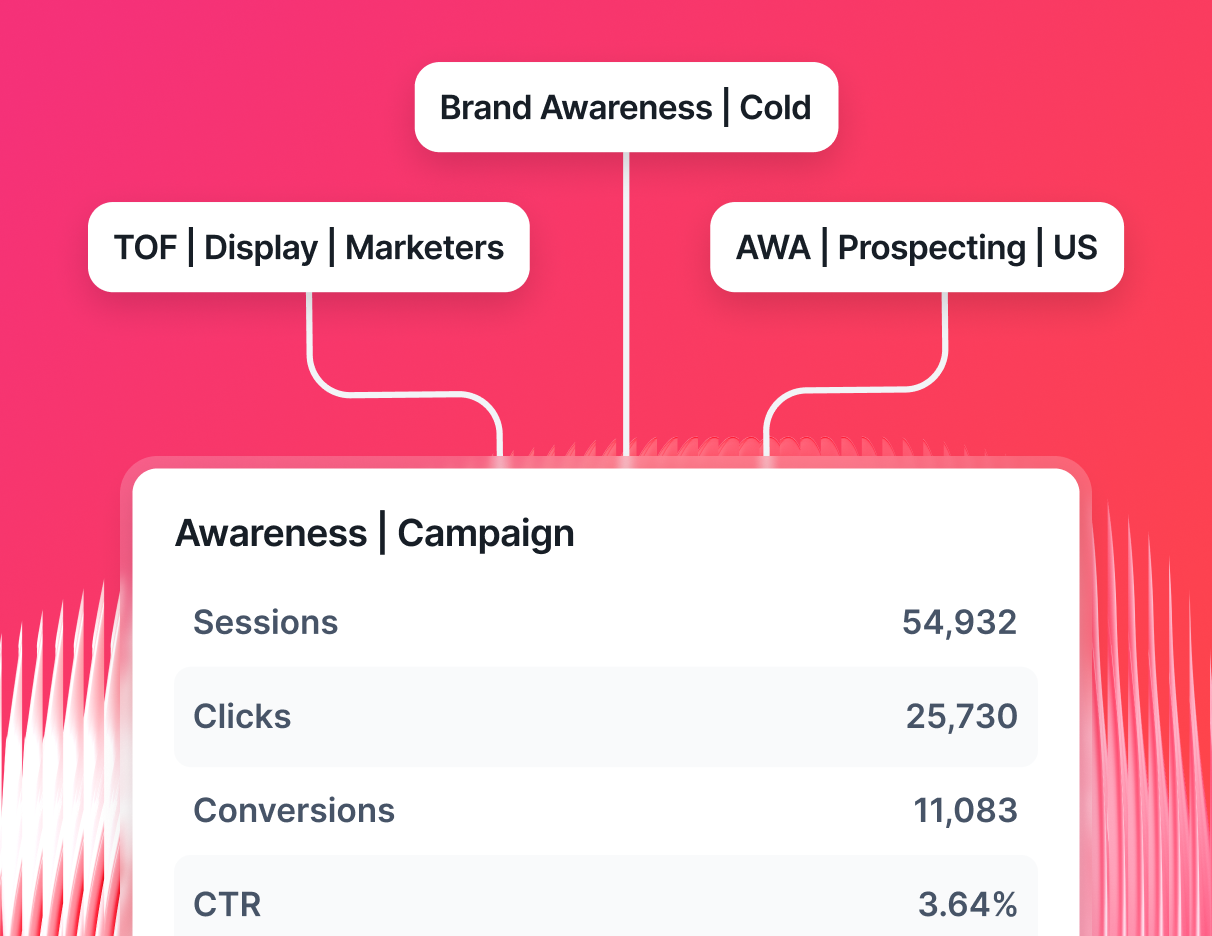
Instead of dragging and dropping widgets one by one, just tell IQ what you need. Type something like: "Build me a GA4 report with traffic sources, top landing pages, conversions, and a month-over-month comparison" — and IQ builds the entire report instantly. Charts, tabs, KPIs, all included.
This way you can create a GA4 report for your clients in minutes, not hours.
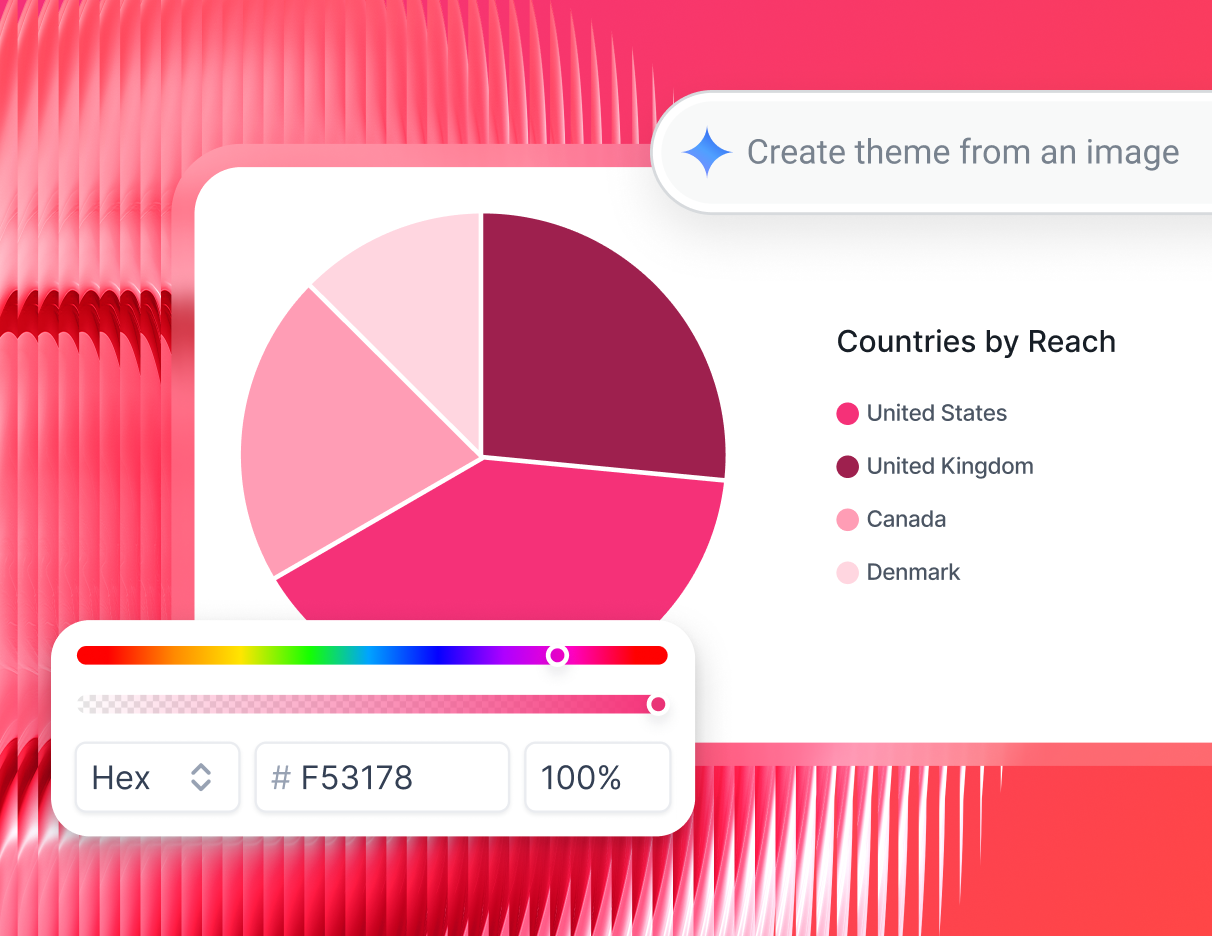
Want it branded for a specific client? Upload their logo or a screenshot of their brand guide. IQ Themes reads it and applies the right colors, fonts, and styling automatically.
Or pick from 100+ Google Analytics dashboard templates and customize from there. Either way, your report is ready in minutes — not hours.
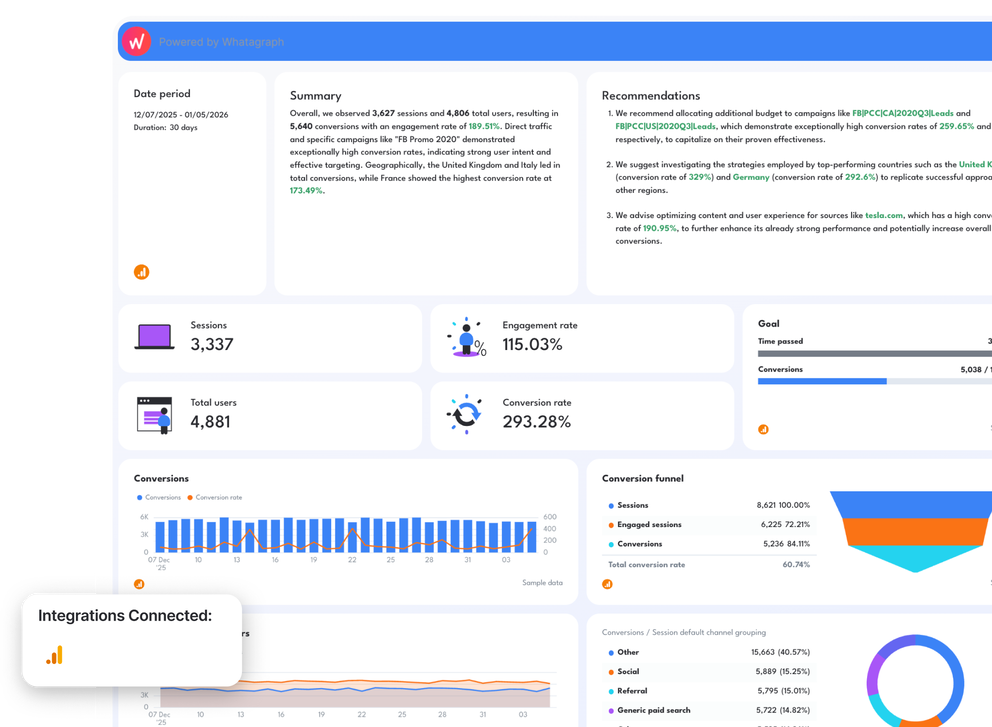
Here’s a sample Google Analytics report for client you can use straight away with your data.
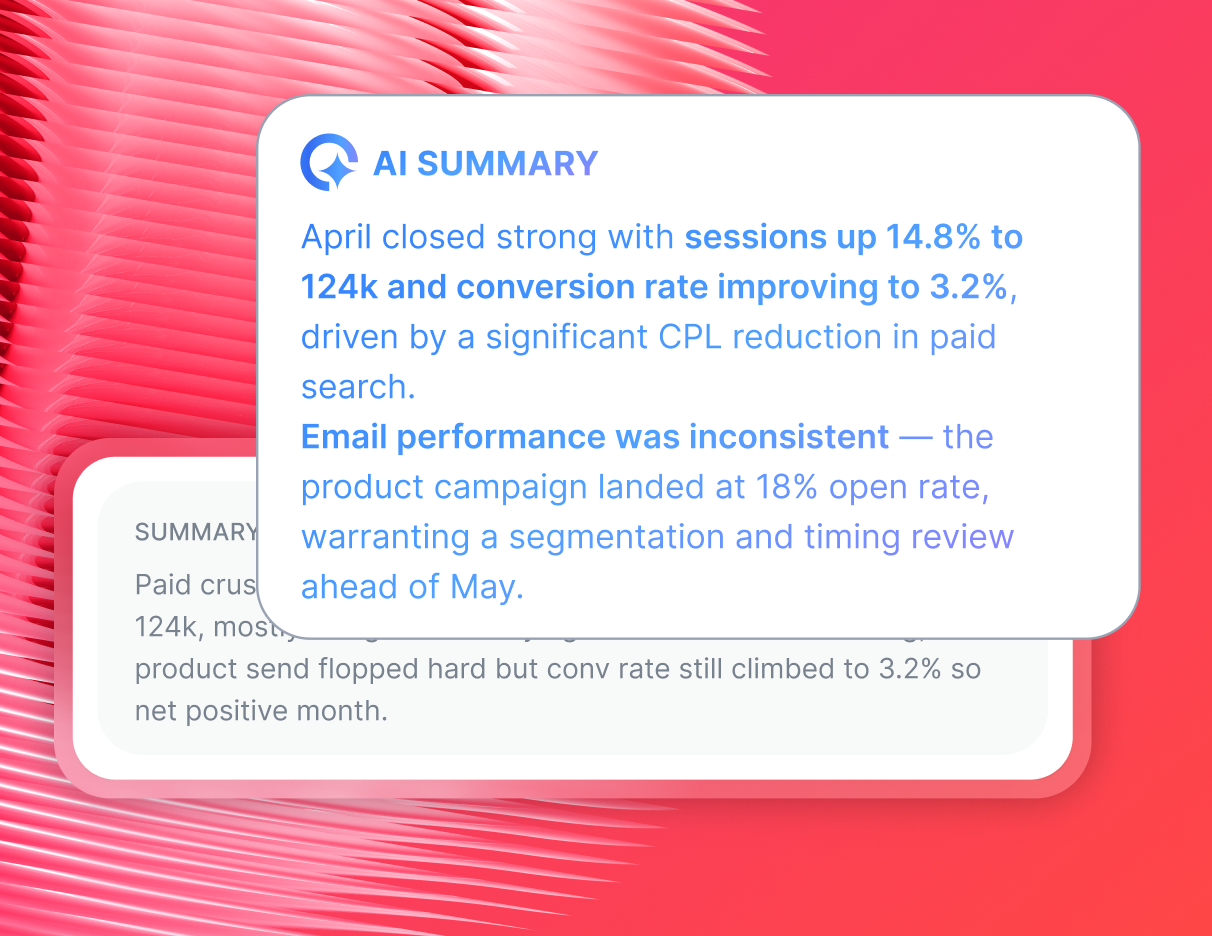
4. Analyze website performance with AI
This is where most GA4 reporting tools stop. Whatagraph goes further.
Once your report is built, IQ reads the data and writes a plain-English performance summary. No hallucinations, no generic copy-paste insights. Just a clear narrative based on your actual GA4 numbers that you can edit, add context to, and send straight to clients.
But the real power is IQ Chat.
Instead of digging through Explorations or building custom reports inside GA4, just ask. Here are the kinds of prompts your team can get answered instantly:
- “Show me GA4 traffic trends across all my clients”
- "Which landing pages drove the most conversions last month?"
- "How did organic traffic perform in X period compared to Y period?"
- "Is our bounce rate improving month over month?"
- "What's our top-performing campaign by sessions this quarter?"
IQ Chat reads your connected GA4 data and answers in plain language without pivot tables, “Explorations”, or having to wait until after the client call to follow up.
It's like having a data analyst sitting next to you, but one that knows your GA4 account inside out and never needs a coffee break.
5. Put reporting on autopilot with Google Analytics automated reports
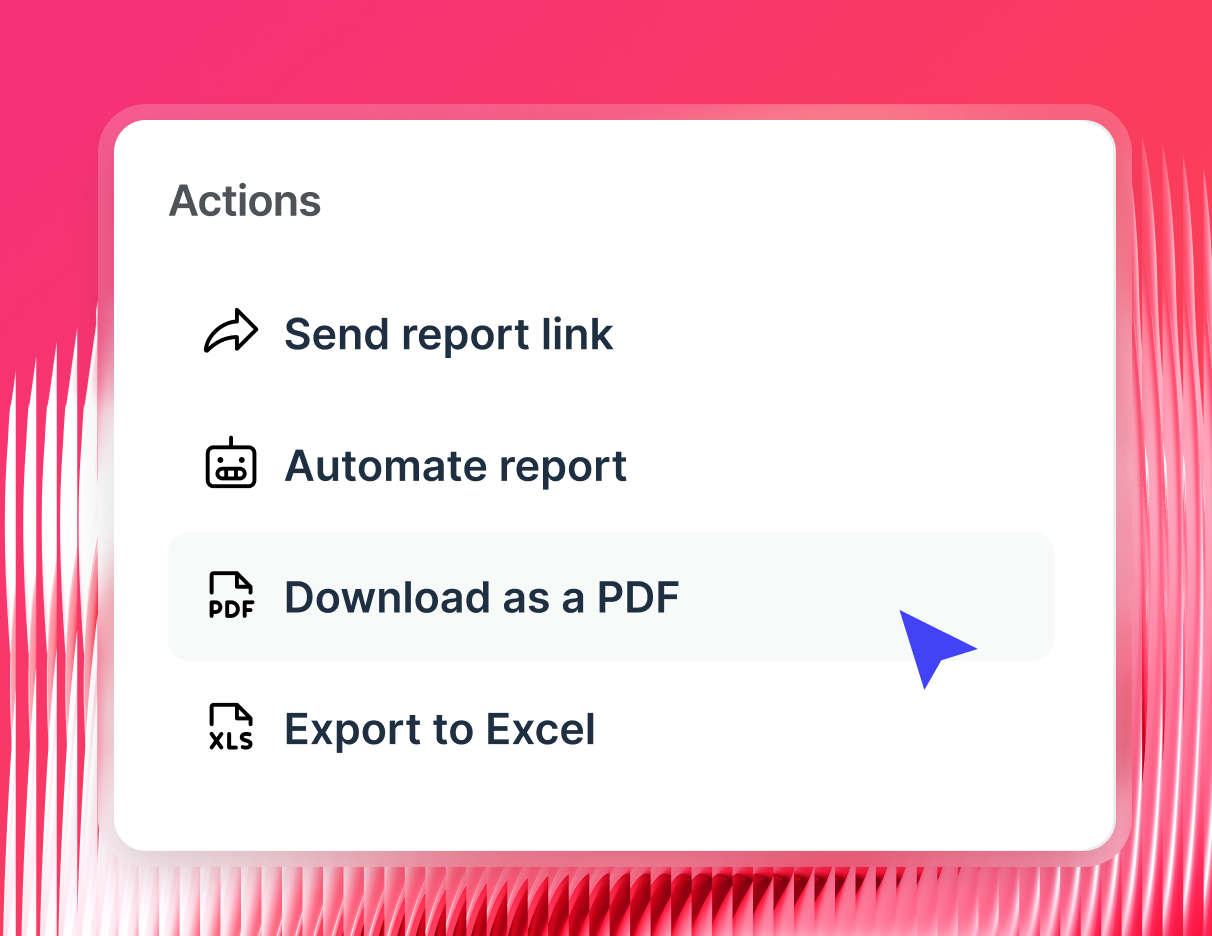
Once your report is ready, Whatagraph takes it from there.
Schedule Google Analytics automated email reports to go out weekly, monthly, or on whatever cadence fits your client. Share a live link so stakeholders can check in on real-time data without logging into anything. Export as PDF or CSV for internal archives.
Need long-term data storage beyond GA4's 14-month retention limit? Send your GA4 data straight to BigQuery automatically — no code, no pipelines, no data engineering.
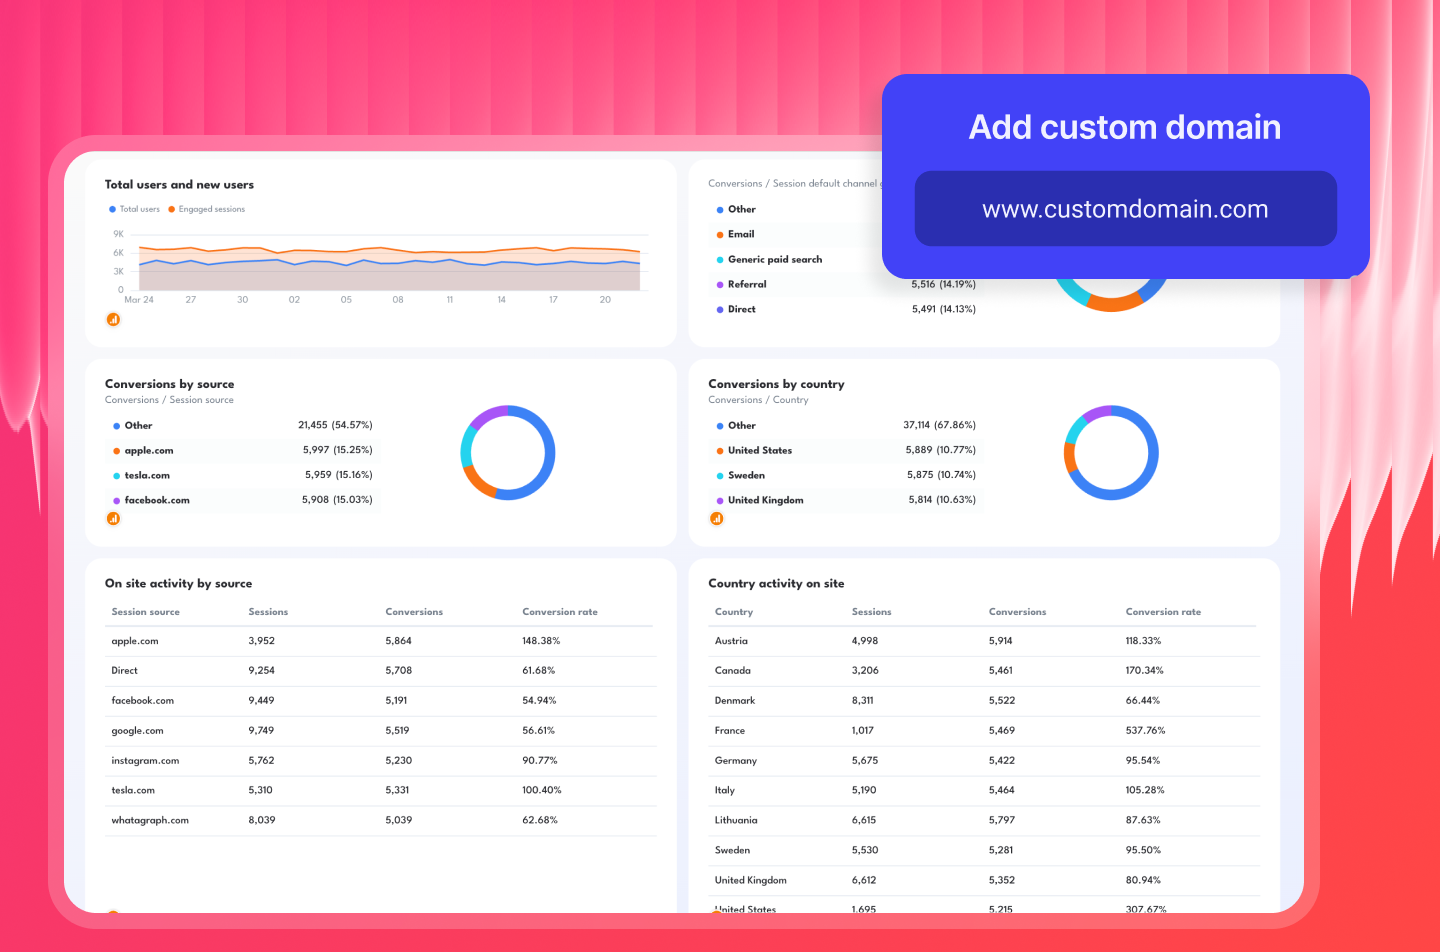
White-label everything with your own domain and sender details so every report feels like it came from your agency. Save your reports as linked templates and edit once — changes sync across every client report instantly.
Your GA4 reporting workflow, fully on autopilot.