Easy, No-Code Adobe Analytics Integration
Looking for a simpler way to report on your Adobe Analytics data sources?
Whatagraph’s no-code Adobe Analytics integration lets you skip the dev tickets and get a full-fleshed report in seconds.
Just log in, and let AI build full reports, summarize insights, and even style them for you.
All-in-One Marketing Intelligence Platform for Adobe Analytics

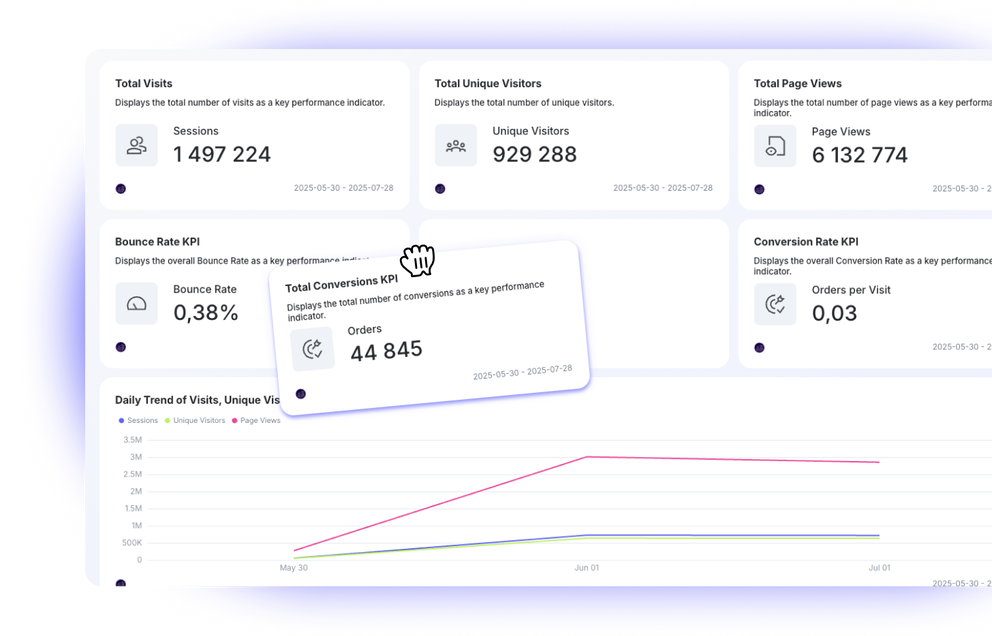
Beautiful Adobe Analytics Reports, Zero Guesswork
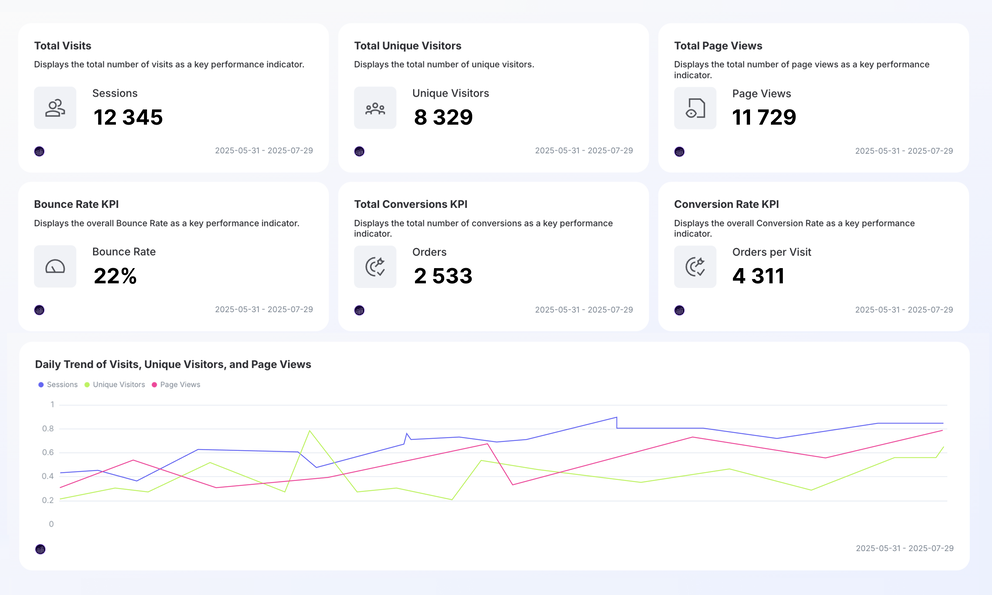
Adobe Analytics Metrics Available Instantly in Whatagraph
All
All Adobe Analytics Metrics
53Search...
Average page depth
Average page views per visit
Average session length
Average time on site
Bot occurrences
Bot page views
Bounce rate
Bounces
Cart additions
Cart removals
Cart views
Carts
Checkouts
Content velocity
Custom events
Entries
Exits
Identified People
Instances
Mobile lifecycle metrics
Mobile views
New engagements
Occurrences
Orders per visit
Orders
Page events
Page views
Pages not found
People with Experience Cloud ID
People
Product views
Reloads
Revenue
Searches
Single access
Single page visits
Streaming media core metrics
Streaming media ads
Streaming media chapters
Streaming media player state tracking
Streaming media quality
Streaming media video metadata
Time spent per visit
Time spent per visitor
Time spent overview
Total seconds spent
Unidentified People
Unique devices
Unique visitors
Units
Voice metrics
Visitors with Experience Cloud ID
Visits
Check out related integrations:


Save Time on Adobe Analytics Data Integration & Reporting


Frequently Asked Questions
Why use Adobe Analytics data connectors?
Using an Adobe Analytics data connector gives you a seamless way to unify your reporting across platforms without relying on manual exports or complex setups. It’s especially useful if you're connecting Adobe Analytics with other analytics tools like Google Analytics or CRM platforms.
In short, an Adobe Analytics source connector allows you to pull structured customer data directly from your report suite, so you can build clear, real-time dashboards with the metrics that matter.
With Whatagraph’s Adobe Analytics connector, you can instantly pull all your data from the Adobe Analytics API and bring in accurate data without writing queries or building custom pipelines.
Plus, you can automate reports, identify performance gaps in the customer journey, and optimize your insights without touching a line of JavaScript.
How can I integrate Adobe Analytics with third-party platforms?
This is ridiculously easy if you’re using Whatagraph’s Adobe Analytics integration. Here's how to do it step by step:
Step 1: Connect Adobe Analytics to Whatagraph
Start by selecting Adobe Analytics from Whatagraph’s list of native integrations. You’ll be prompted to log in and authenticate your account using OAuth. Make sure your permissions and product profile settings are correctly configured within the Adobe Experience Cloud before proceeding.
Whatagraph supports 55+ native integrations, and our data connectors Adobe Analytics setup makes it incredibly easy to unify your attribution, content, and conversion tracking—without dev support or custom code.
Step 2: Blend data with third-party platforms
After selecting your data source, you can combine your Adobe Analytics metrics with metrics from other platforms like Google Ads, Facebook, HubSpot, or Shopify.
Previously you’d have to create these custom blends, metrics, and dimensions manually. But with Whatagraph, you can just ask us to create them for you and we’ll get it done in seconds. No manual work or head-scratching required.
Whatagraph makes it easy to merge these data sets into one unified view, giving you a complete picture of the customer journey.
Step 3: Create your Adobe Analytics report instantly
Once you’re ready to create a report, you can just prompt Whatagraph to generate an Adobe Analytics report with the exact metrics, structure, and format you want.
Just wait a few seconds and you’ll get a fully-fleshed out Adobe Analytics report—all done for you. Adjust the widgets and reports any way you want, like adding drop-down filters, charts, or pivot tables. You can do this either manually or by asking AI.
The data on your reports also refresh in near real-time (every 30-minutes) automatically so you never have to worry about late or inaccurate data.
Whether you're visualizing funnel performance, content views, or custom events, Whatagraph pulls the right metrics using the Adobe Analytics reporting API, so your data is always complete and up to date.
Step 4: Brand your reports
Want to make your reports your own? No need to figure out complicated settings or color themes.
With Whatagraph, you can just upload an image of your brandbook or type in a prompt and we’ll apply the exact colors and fonts to your report.
You still have full-control—you can fine-tune the fonts, HEX codes, colors, and even choose which icons you want to apply to your reports.
What is the difference between AEM and Adobe Analytics?
AEM, or Adobe Experience Manager, is a content management solution designed to build, deliver, and personalize web experiences across channels.
Adobe Analytics, by contrast, is focused on data collection, measurement, and analysis—helping teams understand user behavior across web pages, apps, and digital touchpoints.
While AEM manages the content side of things, Adobe Analytics provides insight into how users interact with that content.
Together, they form a core part of the Adobe Experience Platform, allowing you to measure and optimize performance in real time. Integration between the two requires configuring Adobe Launch, setting permissions, and aligning on shared use cases.
What metrics should I highlight on my Adobe Analytics report?
The most important metrics in an Adobe Analytics report depend on your business goals, but you’ll generally want to surface KPIs like bounce rate, time on site, exit pages, conversion events, and marketing channel performance.
If you’re tracking campaign attribution, eVars help you capture custom values like campaign names, devices, or referrers.
For teams working across multiple regions or brands, organizing your report suite structure is essential to standardize data and ensure consistency.