AppsFlyer Integration
Looking for an easy way to report on your AppsFlyer campaigns? Try our easy, no-code AppsFlyer connector.
Track installs, in-app events, and ROI in real time. Combine AppsFlyer with Meta, TikTok, Google Ads, and more to show true cross-channel performance.
Automate client reporting, create white-labeled reports, and move from spreadsheet chaos to clean, visual insights.
All-in-one marketing intelligence platform for AppsFlyer source data

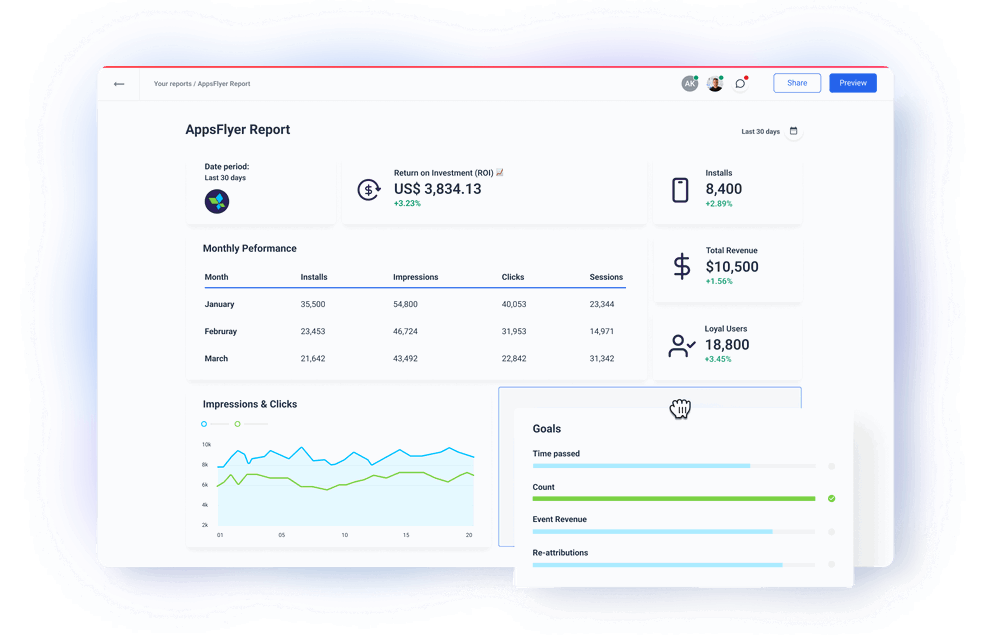
Visualize key metrics on your AppsFlyer reports
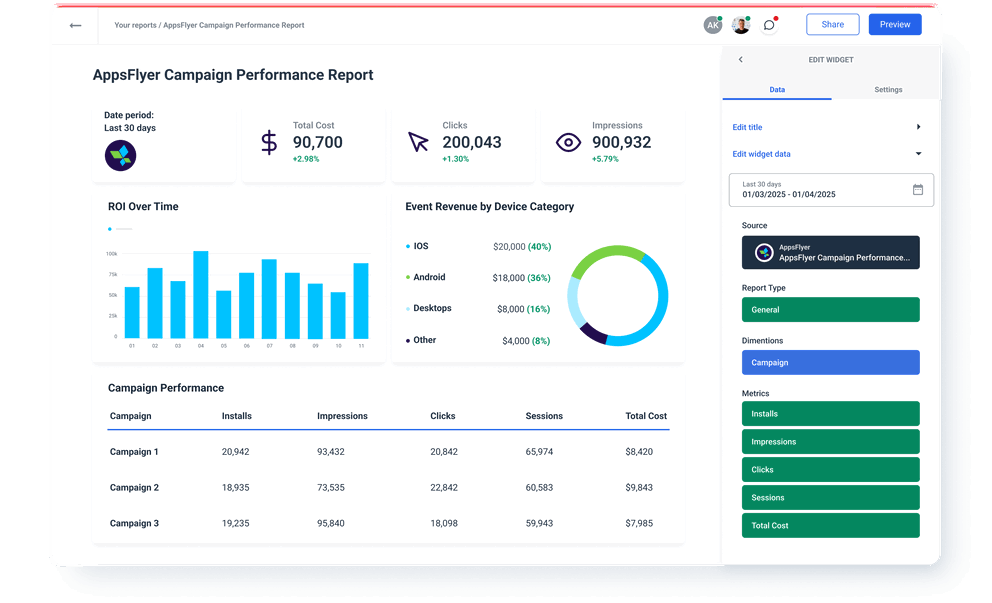
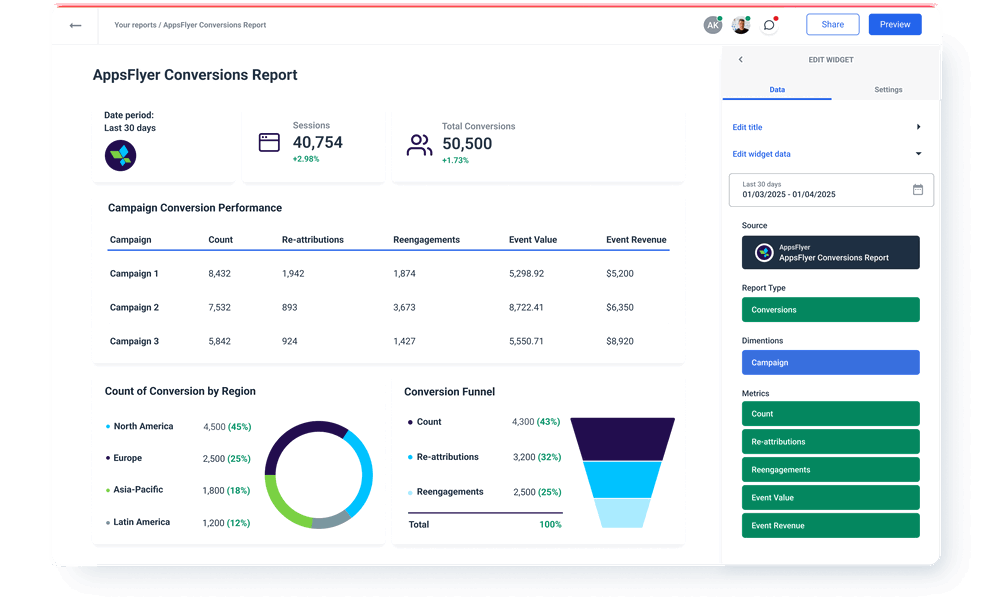
AppsFlyer metrics available instantly in Whatagraph
All
AppsFlyer Conversions Report
6AppsFlyer General Report
9Search...

Count
Re-attributions
Reengagements
Event Value
Event Revenue
Event Revenue in US dollars
Installs
Impressions
Clicks
Sessions
Loyal Users
Return on Investment
Average Revenue per User
Total Revenue
Total Cost
Check out related integrations:


Save time on AppsFlyer data integration and reporting


Frequently Asked Questions
What is AppsFlyer used for?
AppsFlyer is a mobile attribution and analytics platform that helps you track where your users come from and what they do after installing your app—whether it’s on iOS or Android.
You’ll use the AppsFlyer SDK to collect real-time conversion data from your iOS apps and Android apps, so you can see which media sources drive installs, in-app purchases, and other important actions like subscriptions or sign-ups.
With AppsFlyer, you can:
- Attribute installs and in-app actions to the right ad channels
- Measure campaign performance across platforms like Meta, Google, and TikTok
- Analyze user behavior, retention, LTV, and revenue
- Detect and block ad fraud
- Make smarter decisions based on real-time performance data
If you’re running user acquisition or growth campaigns, AppsFlyer gives you the insights to optimize spend and scale what’s working.
How long does it take to integrate AppsFlyer on Whatagraph?
Connecting AppsFlyer to Whatagraph takes just a few minutes. You don’t need any coding skills or developer support.
Simply open Whatagraph, choose AppsFlyer from the list of native integrations, and log into your AppsFlyer account.
Once connected, you can select the specific app you want to report on. Your campaign and attribution data—like installs, in-app events, and ad revenue—will automatically start flowing into Whatagraph.
From there, you can use pre-built widgets and templates to create custom Appsflyer dashboards and reports, or blend AppsFlyer data with metrics from other channels like Meta, TikTok, and Google Ads.
What data does AppsFlyer collect?
AppsFlyer collects data that helps you understand how users discover, install, and engage with your mobile app. This includes:
Attribution data, like the source of the install (e.g. ad network, campaign, keyword)
Install events, including first opens and re-engagements
In-app events, such as purchases, sign-ups, or level completions
Device and user data, including anonymized device IDs and app version
Uninstall tracking
Retention and revenue metrics
Ad revenue data if you're monetizing with in-app ads
All of this data is captured through the AppsFlyer SDK.
What metrics should I highlight on my AppsFlyer report?
The metrics you choose will depend on your goals and audience, but these are the most important ones to include in your AppsFlyer reports—especially when you're reporting on mobile campaign performance.
Conversions
Count: The total number of tracked conversion events. It gives you a high-level view of how many key actions your users are completing.
Re-attributions: Tracks users who reinstalled or reopened the app from a new campaign. Useful for measuring the impact of retargeting efforts.
Reengagements: Shows how many dormant users returned after engaging with a campaign. Helps evaluate your win-back strategies.
Event Value: Represents the total value assigned to conversion events. Useful for gauging the quality of user actions, not just quantity.
Event Revenue: Revenue generated directly from tracked events, like purchases or subscriptions. Essential for calculating ROI.
Event Revenue (USD): Same as Event Revenue but standardized in U.S. dollars, making it easier to compare across regions and clients.
General
Installs: Total number of app installs attributed to your marketing efforts. A key measure of campaign reach and effectiveness.
Impressions: How often your ads were shown. Helps gauge visibility and top-of-funnel performance.
Clicks: The number of ad clicks that led to app store visits. Useful for evaluating ad engagement and creative performance.
Sessions: Tracks how often users open and use your app. Gives you insight into user engagement post-install.
Loyal Users: Users who meet a retention or usage threshold. This metric helps you focus on quality users, not just volume.
Return on Investment (ROI): Shows how much revenue your campaigns generated compared to what you spent. It’s the most direct measure of profitability.
Average Revenue per User (ARPU): Revenue divided by total users. Helps assess user value and app monetization performance.
Total Revenue: All tracked revenue from the app. Useful for big-picture performance reporting.
Total Cost: Total campaign spend across channels. Needed to calculate ROI and budget efficiency.
How do I set up AppsFlyer integration for my mobile app?
To integrate AppsFlyer with your mobile app, you'll need to install the AppsFlyer SDK and configure key settings in your AppsFlyer account. Here's how to do it:
1. Create your app in AppsFlyer
Log in to your AppsFlyer account and register your app by entering the app ID and selecting the platform—iOS or Android. You can link directly to the App Store or Google Play listing.
2. Install the AppsFlyer SDK
Add the iOS SDK, Android SDK, or a cross-platform SDK like React Native to your app. AppsFlyer provides a detailed integration guide to walk you through this step.
3. Set your dev key
Use the dev key provided in your AppsFlyer account to authenticate and initialize the SDK inside your app.
4. Define in-app events
Set up custom event names and event parameters to track key actions such as in-app purchases, sign-ups, or subscription starts. This data is critical for understanding user behavior after the install event.
5. Enable media sources and postbacks
Configure your media sources (e.g. Meta, TikTok, Google Ads) in the AppsFlyer dashboard. Set up postbacks to ensure that your ad partners receive real-time conversion data.
6. Test your setup
Use the SDK’s debug mode and testing tools to make sure your identifier data and events are being tracked properly. You can also check uninstall tracking, user consent compliance, and more.
Once the integration is complete, AppsFlyer will start collecting data across your iOS apps, Android apps, and even CTV campaigns, giving you full visibility into user acquisition, engagement, and revenue.
What others think about Whatagraph
I made a switch from GDS and Sheets for reporting to Whatagraph, and I am saving literal hours each week on performance report creation. Our small firm actually managed to onboard 2 new clients as a result of all the time we saved on managing data and reporting. The customer service is also really helpful and easy to reach.

Capterra verified review by
Mindaugas S., Marketing Consultant
Having active customer support to help fix any issues was a big contributor, but we also really liked the ability to save templates and connect sources to multiple charts/widgets at once without having to edit them individually. And having the grid layout is much easier to stay consistent with than the free form setup that Data Studio has.

Capterra verified review by
Nico T., Media Planner
The system has standard templates that are easy and fast to use. Also you can build your own report with lightning speed. It is very easy to use, has a lot of integration, and let get started very fast.

Capterra verified review by
Rasmus Bernt K., External Senior Management Consultant
We love Whatagraph - we would definitely recommend and our account manager is great! I love how easy this tool is to use, everyone on the team finds it much more user-friendly than other dashboards. Integration was easy, we sent some example reports to the team who duplicated these for us. We literally had to log in and send it to our clients!

Capterra verified review by
Stephanie S., Digital Director
We are showing our clients the work that we're doing for them and this is incredibly important for our clients ROI. They want to see results and having a tool like Whatagraph that can show data from virtually every source we use is hugely important.

Capterra verified review by
John S., SEO Strategist
The tool is easy to use; you do not need to have development resources. Even my junior project managers are capable of making campaign reports in minutes. There are a lot of pre-made templates you can use as well as many pre-made widgets.

Capterra verified review by
Erman E., Marketing Specialist
Really easy to connect data sources within the tool. The library of report templates has been helpful. The customer support team has been responsive to all of our needs. Our team enjoys the simplicity of setting up the reports and how the data is presented.

Capterra verified review by
Brent N., Director of Operations
Easy to create really beautiful graphs and reports which can help other team members to understand the most important takeaways. I especially like the automated report function, so I don't have to check on the same thing repeatedly.

Capterra verified review by
Orsolya S., Online Marketing Manager