


What is marketing reporting software?
Marketing reporting software connects all your performance data from different channels—ads, social, SEO, email, ecommerce—into one place. Instead of juggling spreadsheets or logging into multiple platforms, you get a single, unified view of your results.
But not all marketing reporting tools are created equal.
Most still leave marketers doing the heavy lifting: fixing broken connectors, cleaning up messy metrics, or manually formatting reports for clients and teams.
Whatagraph 3.0 changes that. It’s the first reporting platform built for marketers, not data teams—automating setup, standardizing metrics, and even explaining performance with AI.
Here’s what you’ll get:
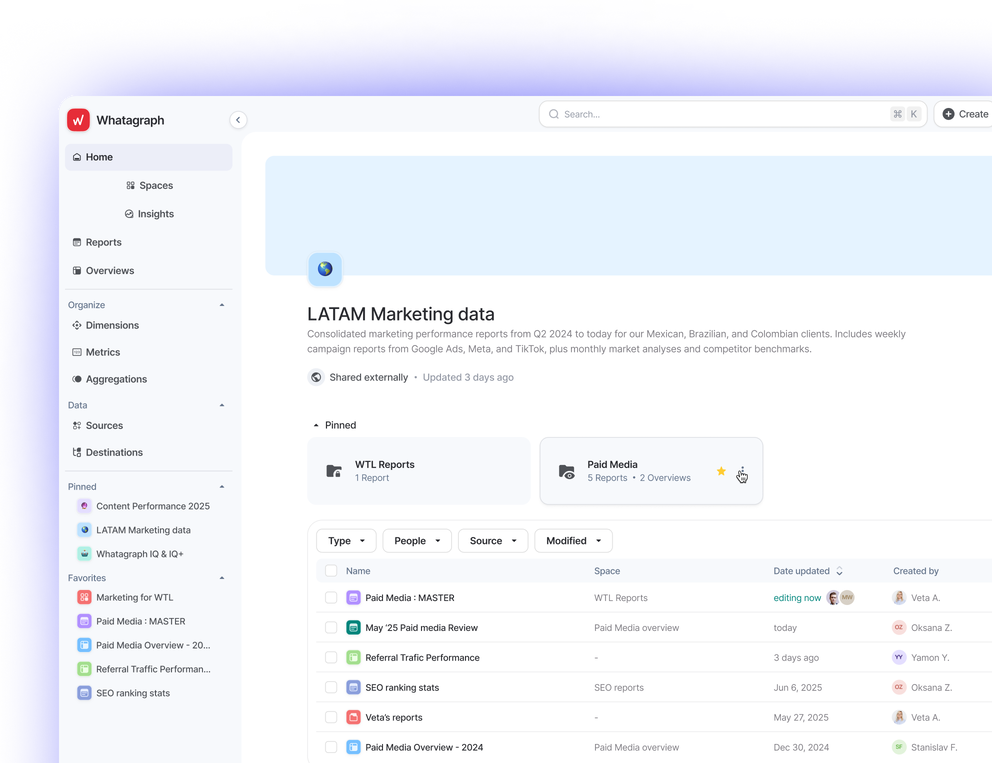
1. The easiest marketing intelligence platform
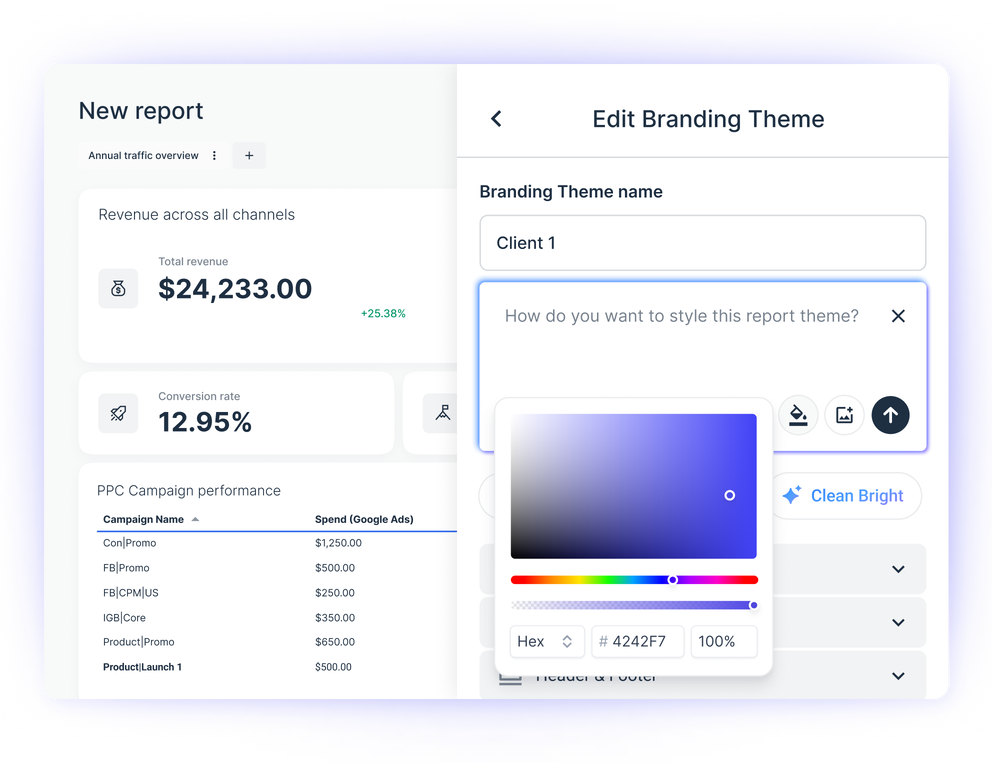
Build reports, tabs, and widgets just by asking AI. No SQL, no report templates, no workarounds needed. White-label your reports from just a screenshot of your brandbook or a prompt. Whatagraph automatically detects and applies the fonts and colors across all your reports.
2. The fastest path from data to insights
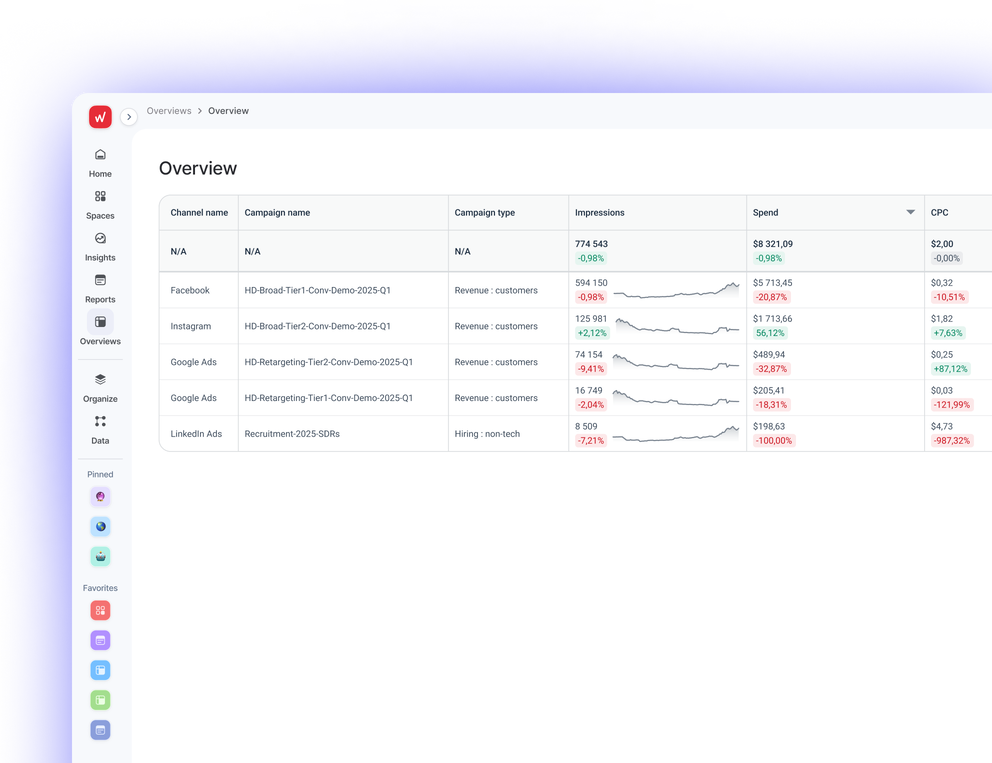
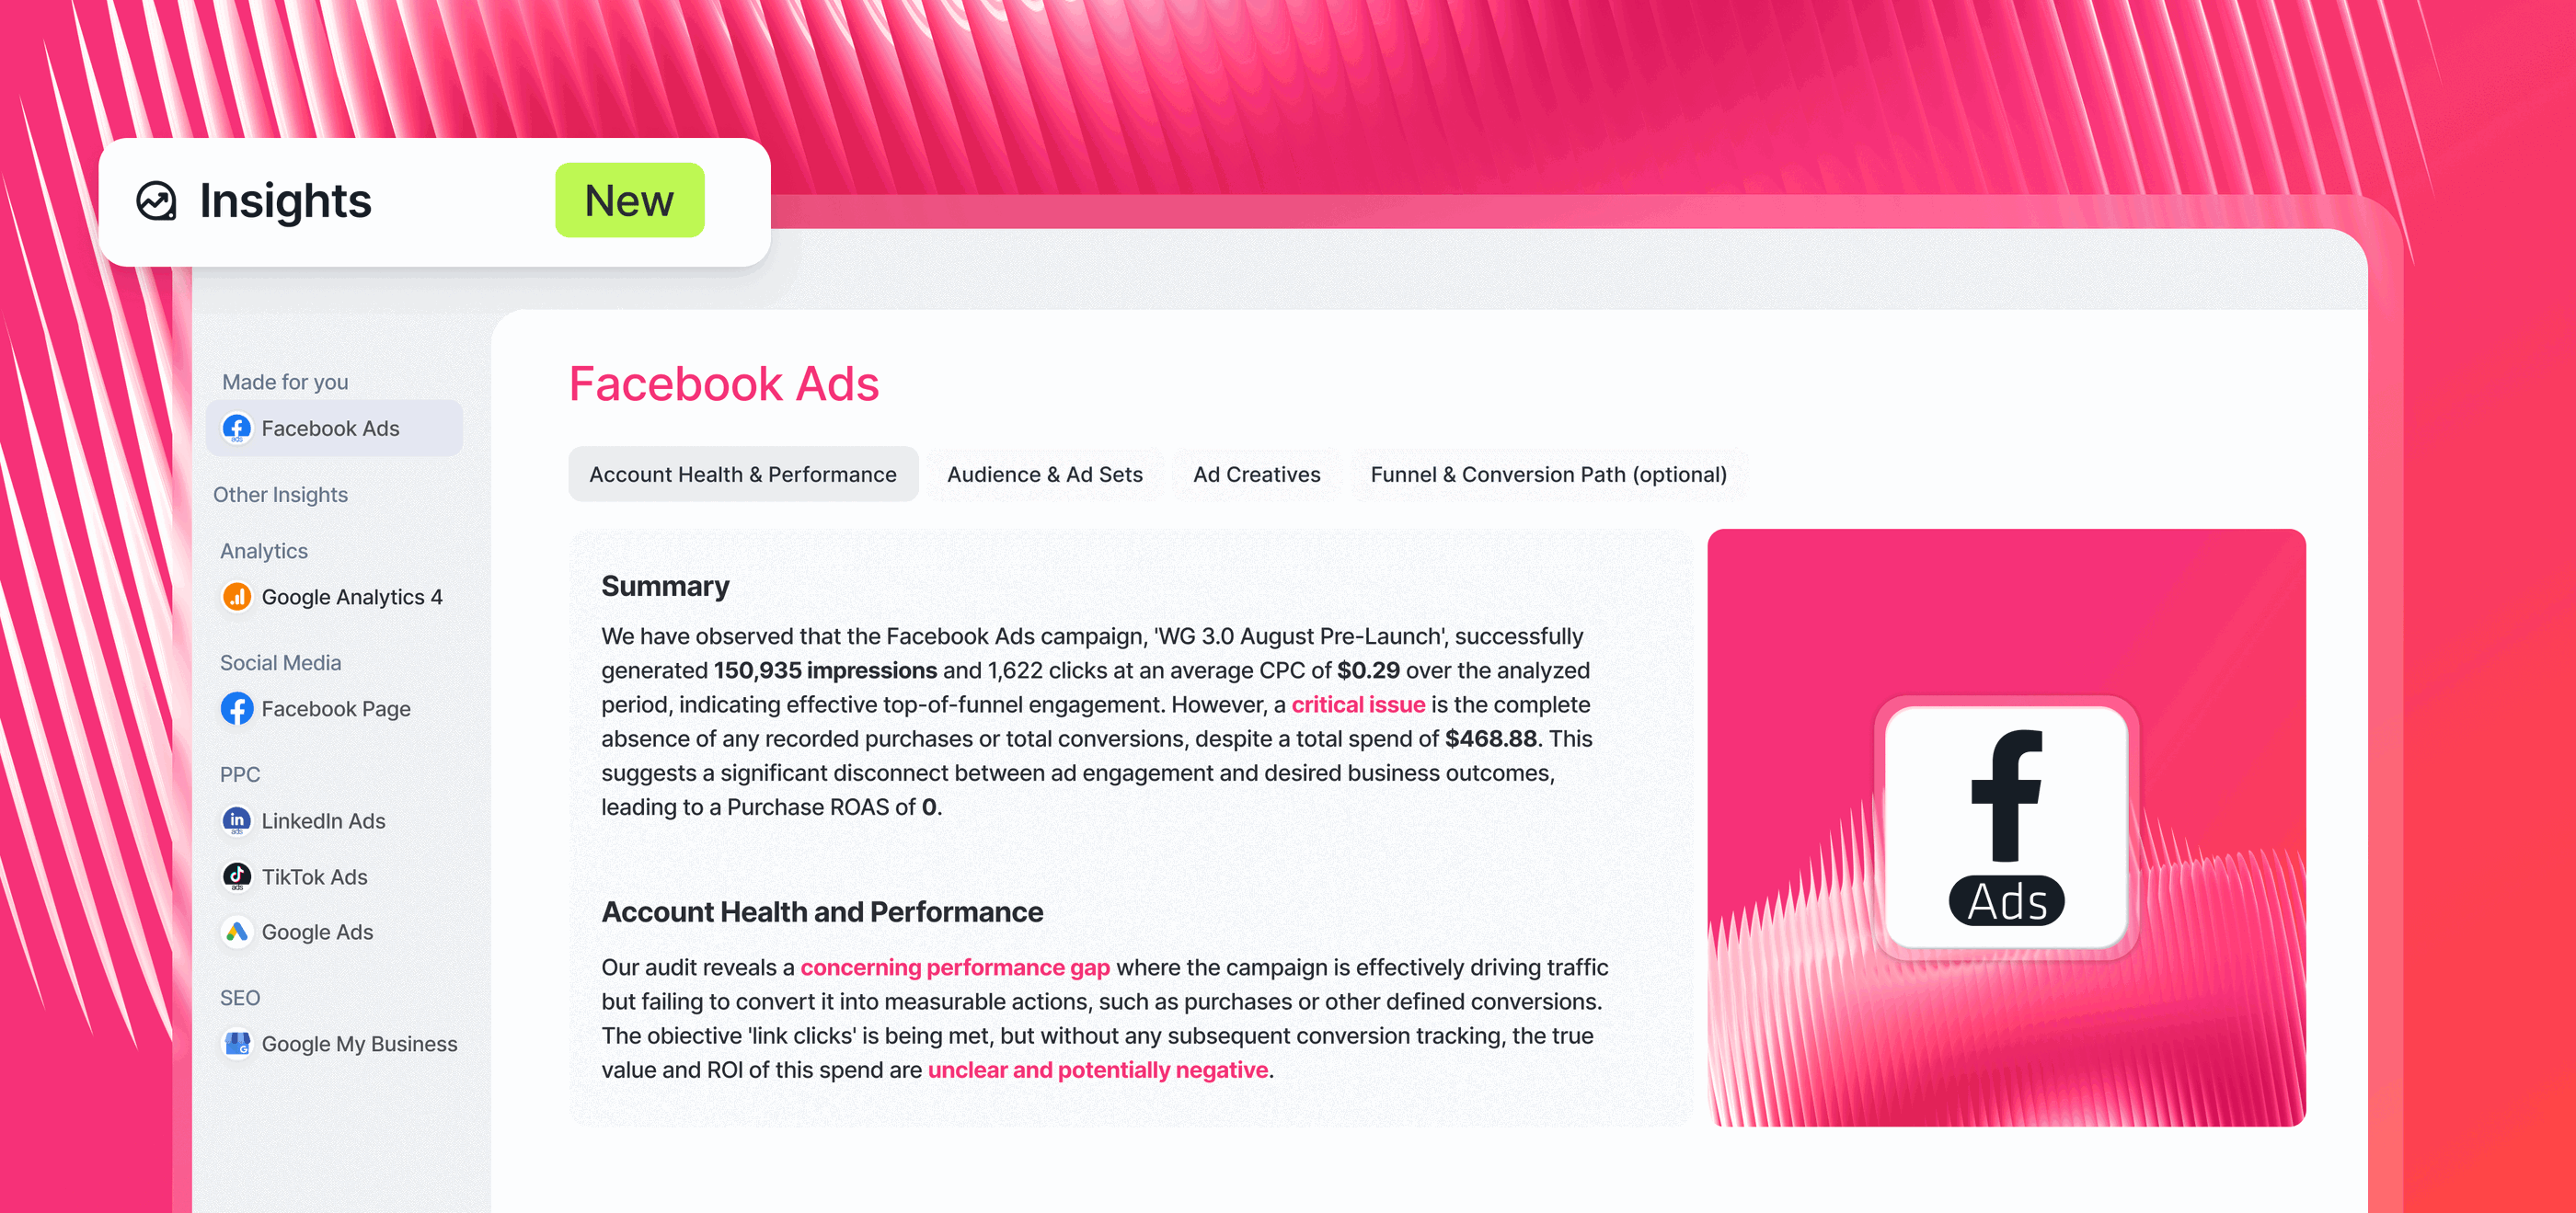
See key insights the moment you log in. Out-of-the-box reports show account health, audience trends, ad creatives, and funnel performance, so you know exactly where to act.
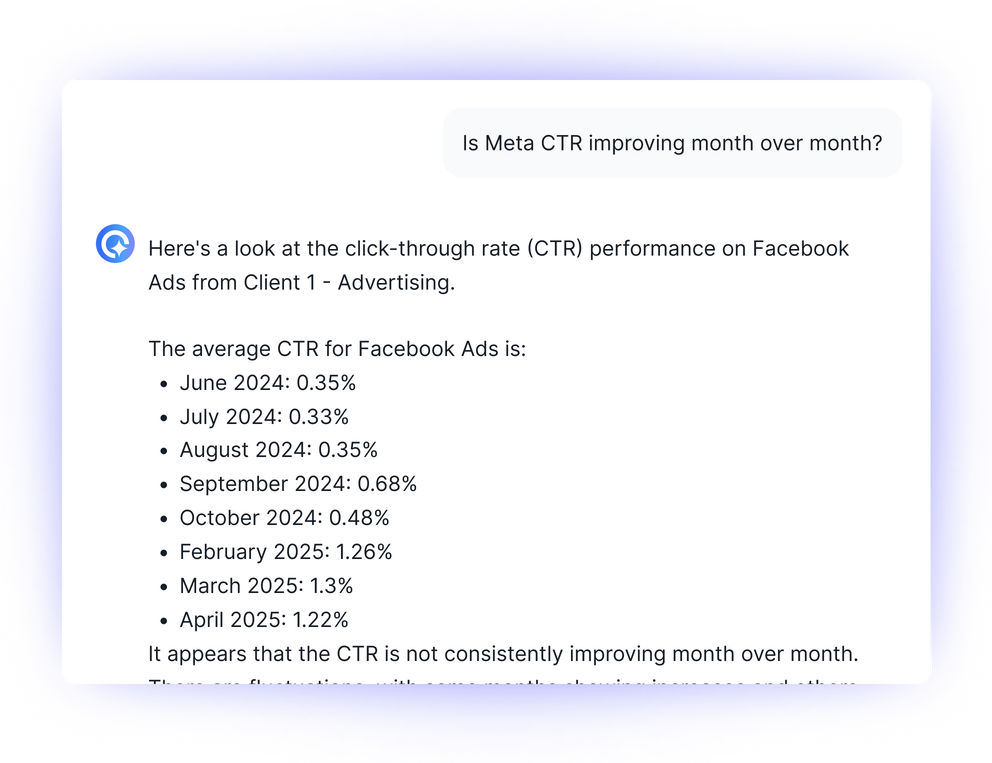
Ask AI any questions you have about your data and get back accurate, instant answers. Add performance summaries directly to your report—written by AI and edited by you—in 18 languages and four formats.
3. Your entire reporting stack in one place
Connect 55+ channels with native, stable integrations. Standardize metrics across platforms, blend data, apply branded themes, and share reports in seconds. No broken connectors. No messy exports.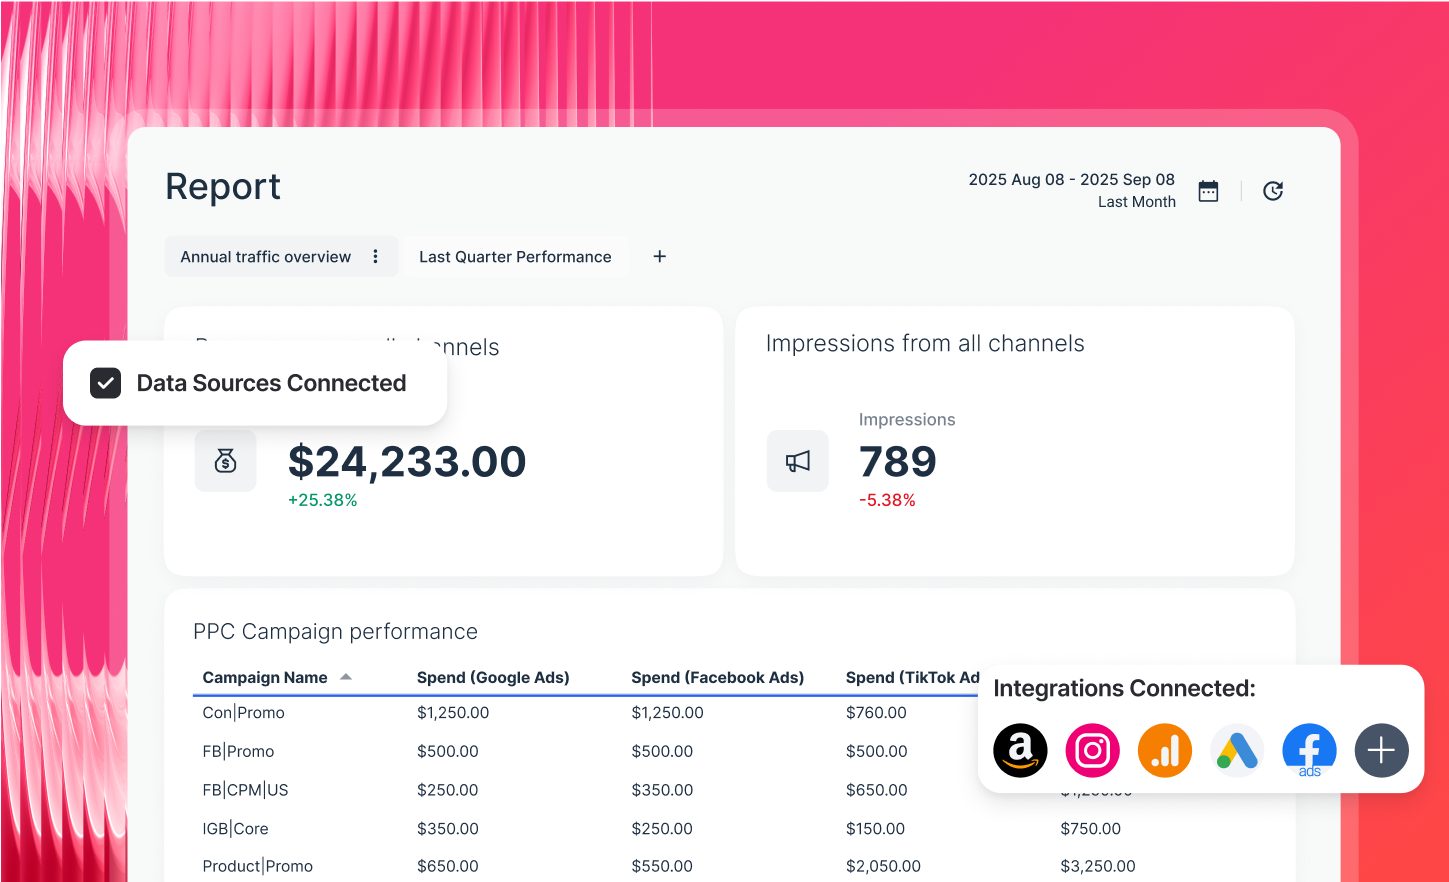
All this means you stop spending hours building and fixing reports and start spending that time improving performance, impressing clients, and driving growth.
At Maatwerk Online, the team is saving 100 hours a month on reporting thanks to an all-in-one marketing reporting software like Whatagraph. Lars Maat, Co-Founder, says:
Whatagraph’s AI saves time and energy for our marketing specialists. And the hours we’re saving is just pure profit. We now have the time to focus on more strategic things that help both our agency and our clients grow.
Choosing the best digital marketing reporting software
Choose marketing reporting software that solves all your agency reporting pain points, from connecting scattered data sources to providing insights to make fast decisions.
Here are the features you should be looking for:
#1. Ease of use
Most online marketing reporting tools aren’t built for marketers, they’re built for data teams. Even with “easy” reporting tools, you still need to:
❌ Wrangle with data connectors
❌ Know basic coding or SQL to clean data
❌ Spend hours building reporting dashboards using complicated controls
❌ Figure out settings to style reports
❌ Fix broken dashboards and connectors
Marketing agencies like Peak Seven struggled with this complexity. The team was using Looker Studio previously and even with templates, it took hours for Kim Strickland, Digital Marketing Specialist, to manually customize tables, widgets, and layouts. Kim said:
The first report I created on Looker Studio took me 40 hours. It’s just not a very user-friendly system.
If a platform requires coding, complex setup, or a steep learning curve, it won’t get adopted across your team, and your reporting will remain a bottleneck.
That’s why ease of use matters when choosing reporting software.
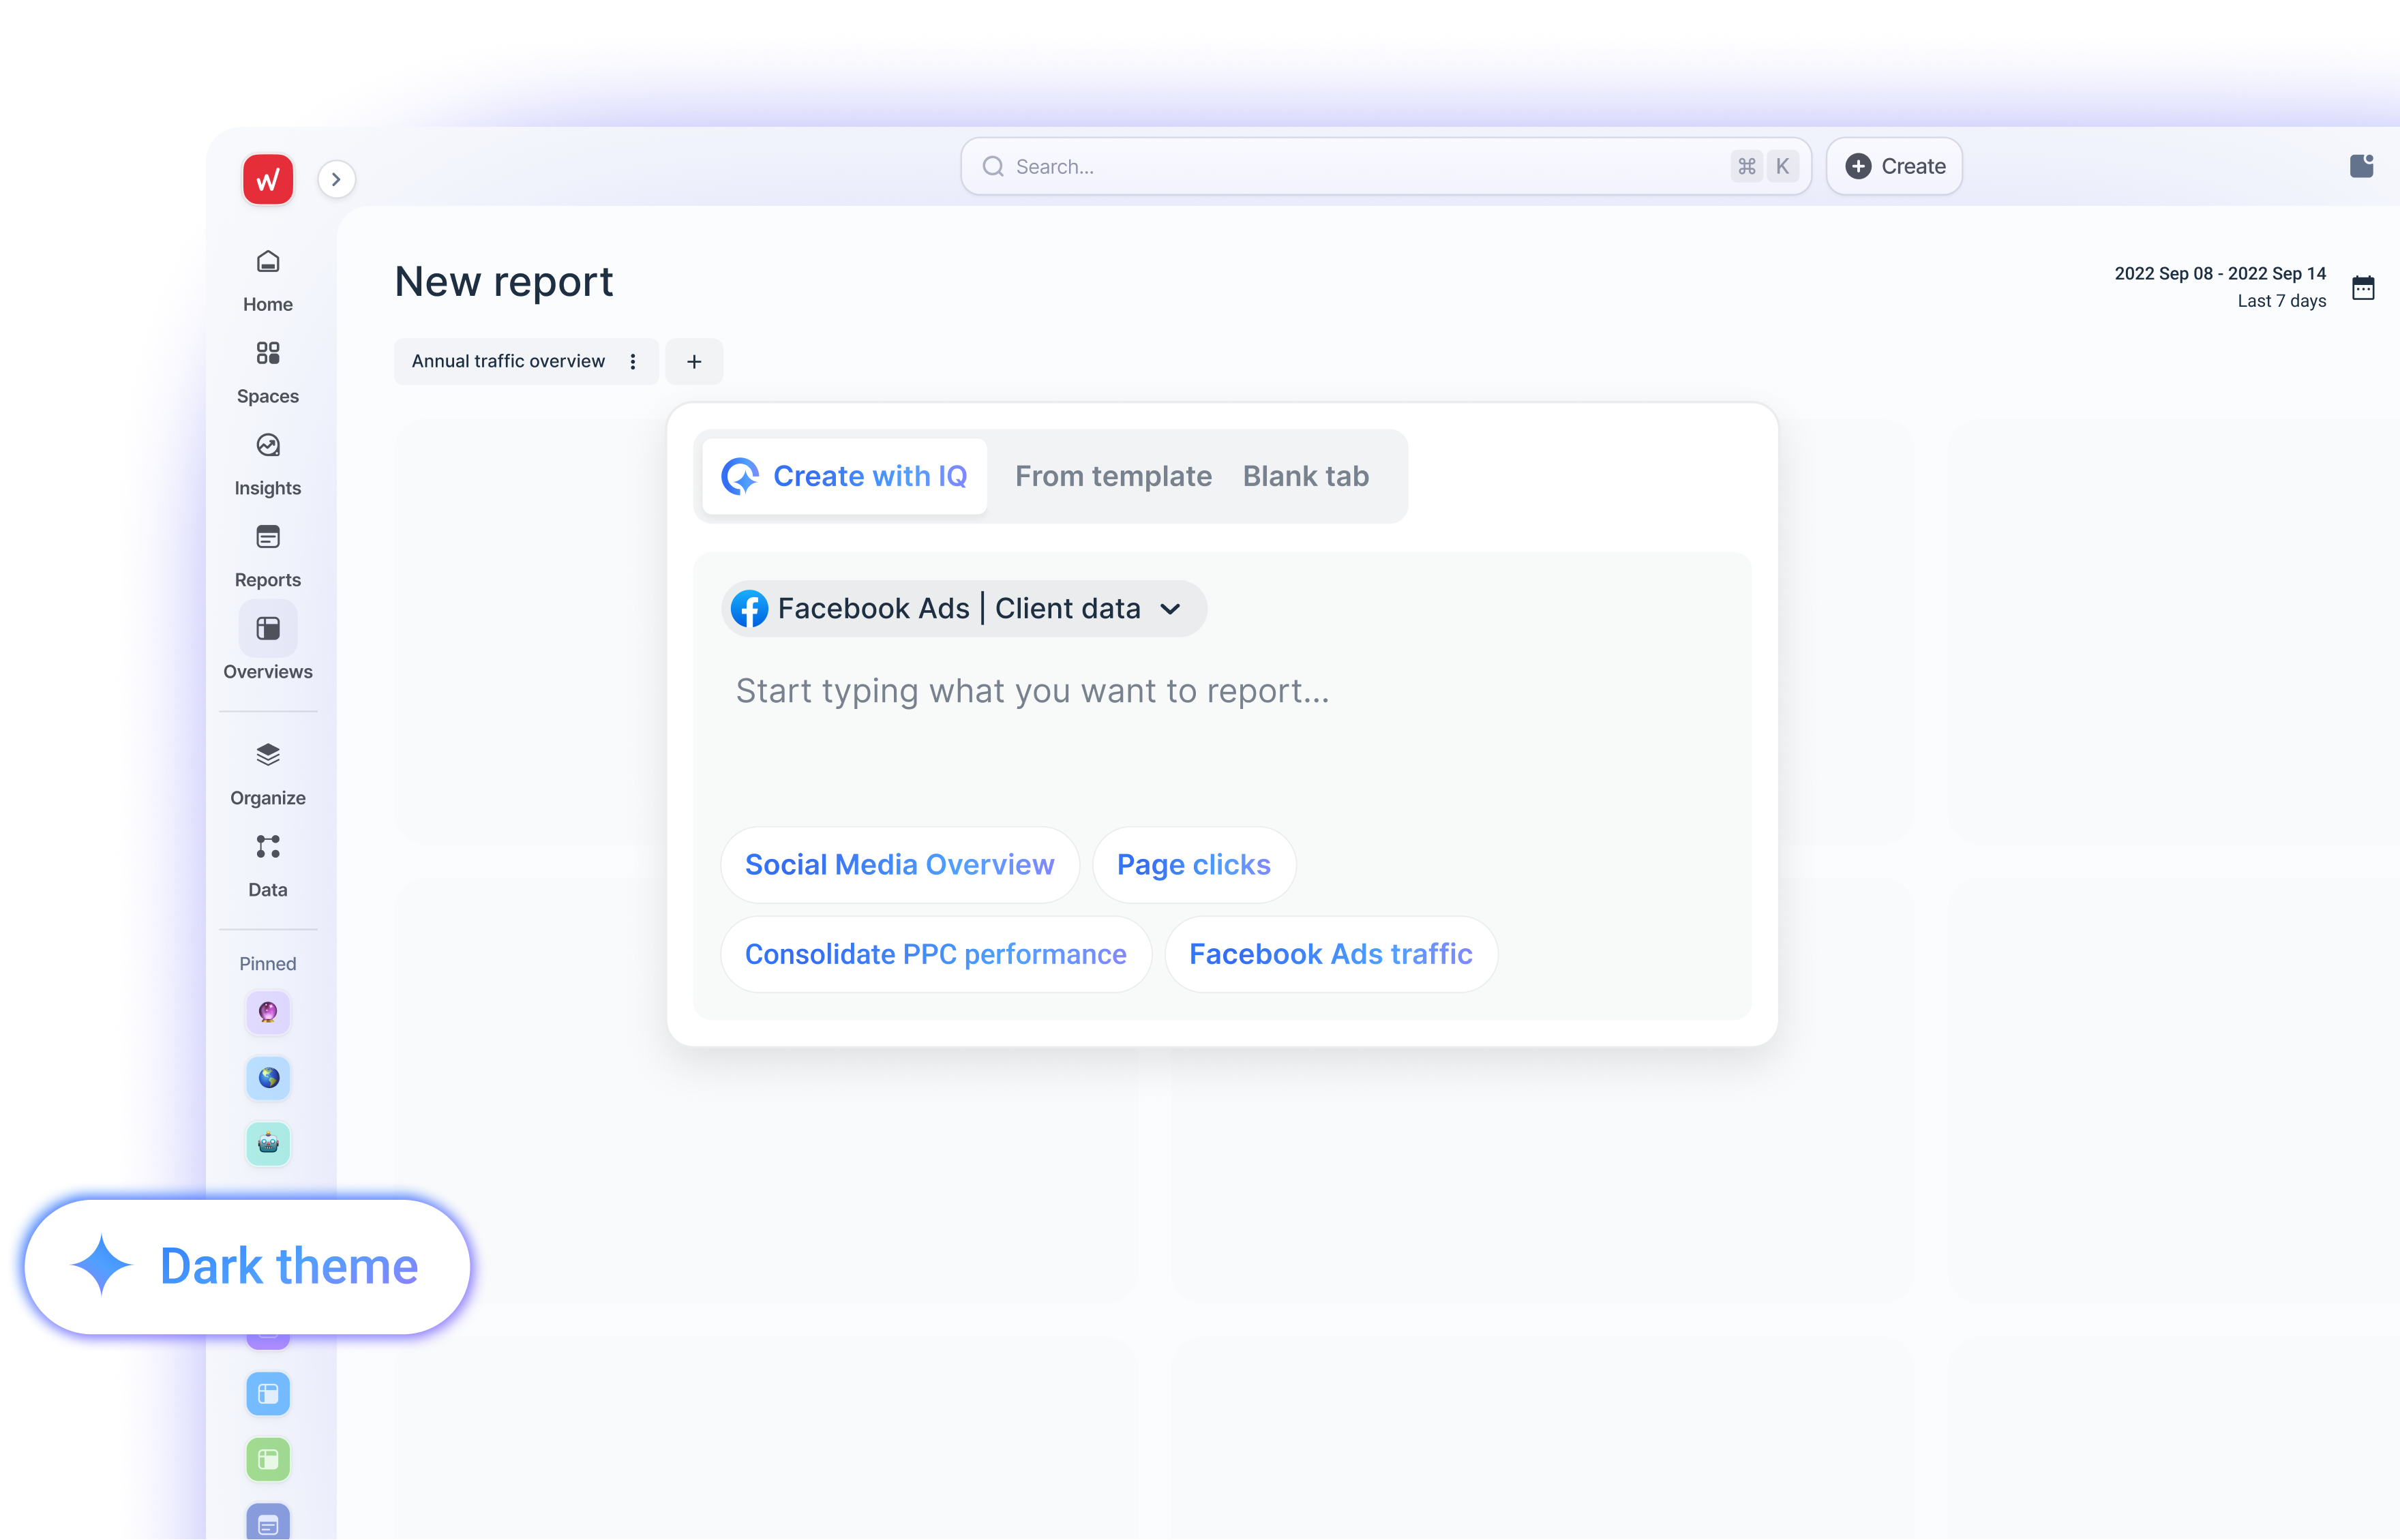
With Whatagraph IQ, reporting is genuinely easy for every marketer:
- Build reports with a single prompt. Ask IQ to generate complete reports with widgets, charts, and graphs—no templates or setup required.
- Add and edit tabs on the fly. Expand reports with new tabs or adjust widgets using simple prompts instead of manual work.
- Get instant explanations. IQ writes performance summaries for you in plain language, in 18 different languages and four formats.
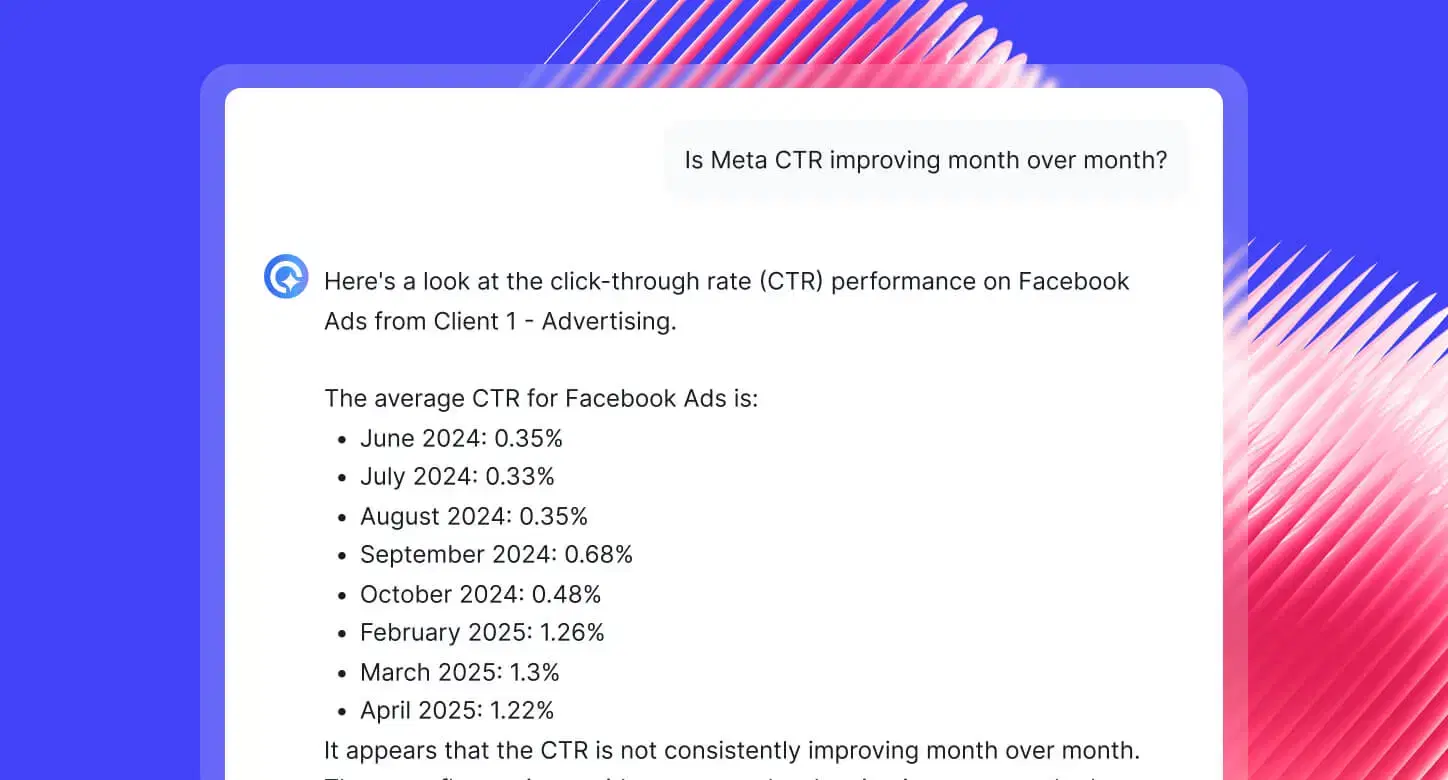
- Ask questions naturally. Type in any question about your marketing campaigns, and IQ Chat pulls the right insights without you digging through dashboards.
- Style automatically. Upload a logo or brandbook, and IQ applies matching fonts, colors, and layouts in seconds.
All of this means marketers don’t have to act like data analysts anymore. Reports are created, explained, styled, and shared in seconds—so you can spend your time on strategy, not setup.
André Cardoso, Project and Performance Marketing Manager at Wise Pirates, raved:
Whatagraph is really simple to use, intuitive, and perfect for marketing teams with limited technical knowledge.
#2. Accurate data
Marketers make decisions based on numbers, but if those numbers aren’t accurate, every decision is built on shaky ground.
Many digital marketing reporting tools pass data through multiple connectors, spreadsheets, and dashboards, leaving plenty of room for errors and inconsistencies.
Kim experienced this first-hand while relying on Looker Studio and Supermetrics. Reports were confusing, data tracking flaws slipped through, and clients were left questioning the numbers. As she explained:
Looker Studio was slow and always breaking. The data wouldn’t pull through, or it would pull through incorrectly. It was just time consuming, frustrating, and a constant guessing game.
If clients can’t trust your numbers—or if you spend hours defending them—you lose credibility, momentum, and growth opportunities.
Whatagraph ensures accuracy at every step:
- Standardize metrics across platforms. Clicks, impressions, and spend are unified automatically, so you never deal with mismatched definitions.
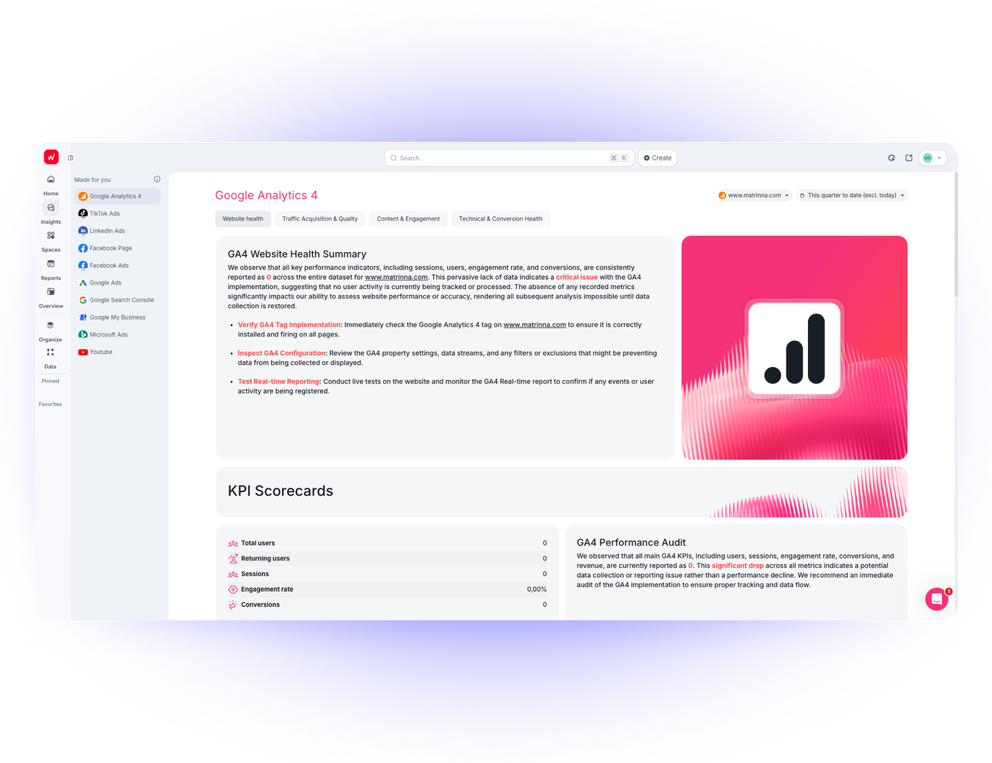
- Spot errors instantly. Insights Space highlights anomalies in account health, audiences, creatives, and funnels, so issues surface before they become problems.
- Explain without hallucinations. Summaries and insights are generated directly from your connected data sources, not approximations—so you can trust every word.
- Stay confident in client conversations. With IQ Chat, you can answer ad-hoc questions on the spot, knowing the data is reliable and up to date.
Our integrations are also built and maintained in-house by our engineers, making them seamless and stable. This also means you don’t need to babysit them—we do it for you.
Whatagraph platform as a whole has a 99.95% uptime and system-wide outages are very rare. If something does happen, there’s an 24/7 emergency alert that notifies our engineers (no matter what time it is) so they can quickly get on it.
Whatagraph also offers a 30-minute consistent data refresh rate across all pricing plans, meaning you’ll see updated data every half hour even without manual refreshes.
When Kim switched to Whatagraph, her data inaccuracy pains were resolved.
With Whatagraph, the data always matches what we’re seeing on the platforms. It allowed us to see clearly how our campaigns are performing and even pointed out the flaws in our data tracking systems.
#3. Stable, native integrations with all your marketing channels
If your reporting tool doesn’t integrate with the channels you use daily, it’s useless. And if those integrations are fragile, you’ll spend more time baby-sitting connectors than analyzing results.
Many online marketing reporting tools rely on third-party connectors, which are notorious for breaking frequently. And when they break, your reports show inaccurate data, which isn’t ideal for client reporting.
In fact, Tanja Keglić, Performance Marketing Manager at Achtzehn Grad, knew this pain all too well. The team was using a combination of Looker Studio and Supermetrics, a third-party connector.
But Supermetrics connectors frequently broke, sources failed to load properly, and Tanja had to either waste time fixing them herself or contact Support for help.
Tanja told us:
It’s such a pain to reconnect a lot of sources and accounts—and it takes so much time, which you don’t have when you want a quick report.
This is why having stable, native integrations matter. And that’s what Whatagraph offers. You’ll get:
- 55+ native integrations: Connect to ads, social, SEO, email, ecommerce, and more—no third-party tools needed. Some examples include:
- Paid-per-click (PPC): Google Ads, Facebook Ads, TikTok Ads
- Social media platforms: Facebook, YouTube, LinkedIn
- SEO: Ahrefs, Google Search Console, Semrush
- Email marketing: Activecampaign, Constant Contact, Klaviyo
- CRM: HubSpot, Salesforce, GoHighLevel
- Analytics: Google Analytics 4, AppsFlyer, Adobe Analytics
- Built and maintained in-house: Our engineers manage every integration directly, so you don’t deal with fragile connectors.
- Custom data available: Have a unique source? Add it via Google Sheets, BigQuery, or API import.
- IQ-powered data blending: Unify and compare metrics across platforms without coding—so “clicks” mean the same thing everywhere.
When Tanja switched to Whatagraph from Looker Studio and Supermetrics, the biggest win she saw was stability and speed.
We don’t have any connection issues on Whatagraph at all. We just connected the platforms once, and that was it. Whatagraph is very, very quick when loading the data.
#4. Scalability
Reporting for one brand is tough enough. But as soon as you’re managing multiple clients, markets, or thousands of data sources, the complexity multiplies.
Most digital marketing reporting platforms don’t scale gracefully. Reports are capped at a certain number of sources, connectors break, dashboards get messy, and keeping everything consistent across clients becomes a full-time job.
This was the exact problem the Rentable team faced with a reporting solution they were previously using.
They had a total of 5,000+ Google My Business data sources, and they needed to visualize 700+ sources in one report – but the tool was capped at 100 per report.
This meant their team had to create 7 different reports, which was time-consuming and frustrating.
Danielle Roberts, Director of Implementation & Support at Rentable, told us:
As we scaled, our reporting needs became more complex. We needed a tool that could grow with us and make reporting more efficient.
That’s why scalability matters when choosing your marketing agency reporting tool. If your platform can’t handle hundreds—or even thousands—of clients, brands, or data sources, it will hold your team back.
Rentable found a solution in Whatagraph, which doesn’t cap them on the amount of data sources they can add to a single report. Danielle said:
Whatagraph lets us pull in all the data we need, fit hundreds of locations in one report, and break it down exactly how our customers want.
To speed up report creation, the team has built out a library of report templates, usually a full portfolio view or a location-specific version.
When they onboard a new customer, they choose an appropriate report template and switch out the data sources. That means no more rebuilding reports from scratch, and no more unnecessary manual steps.
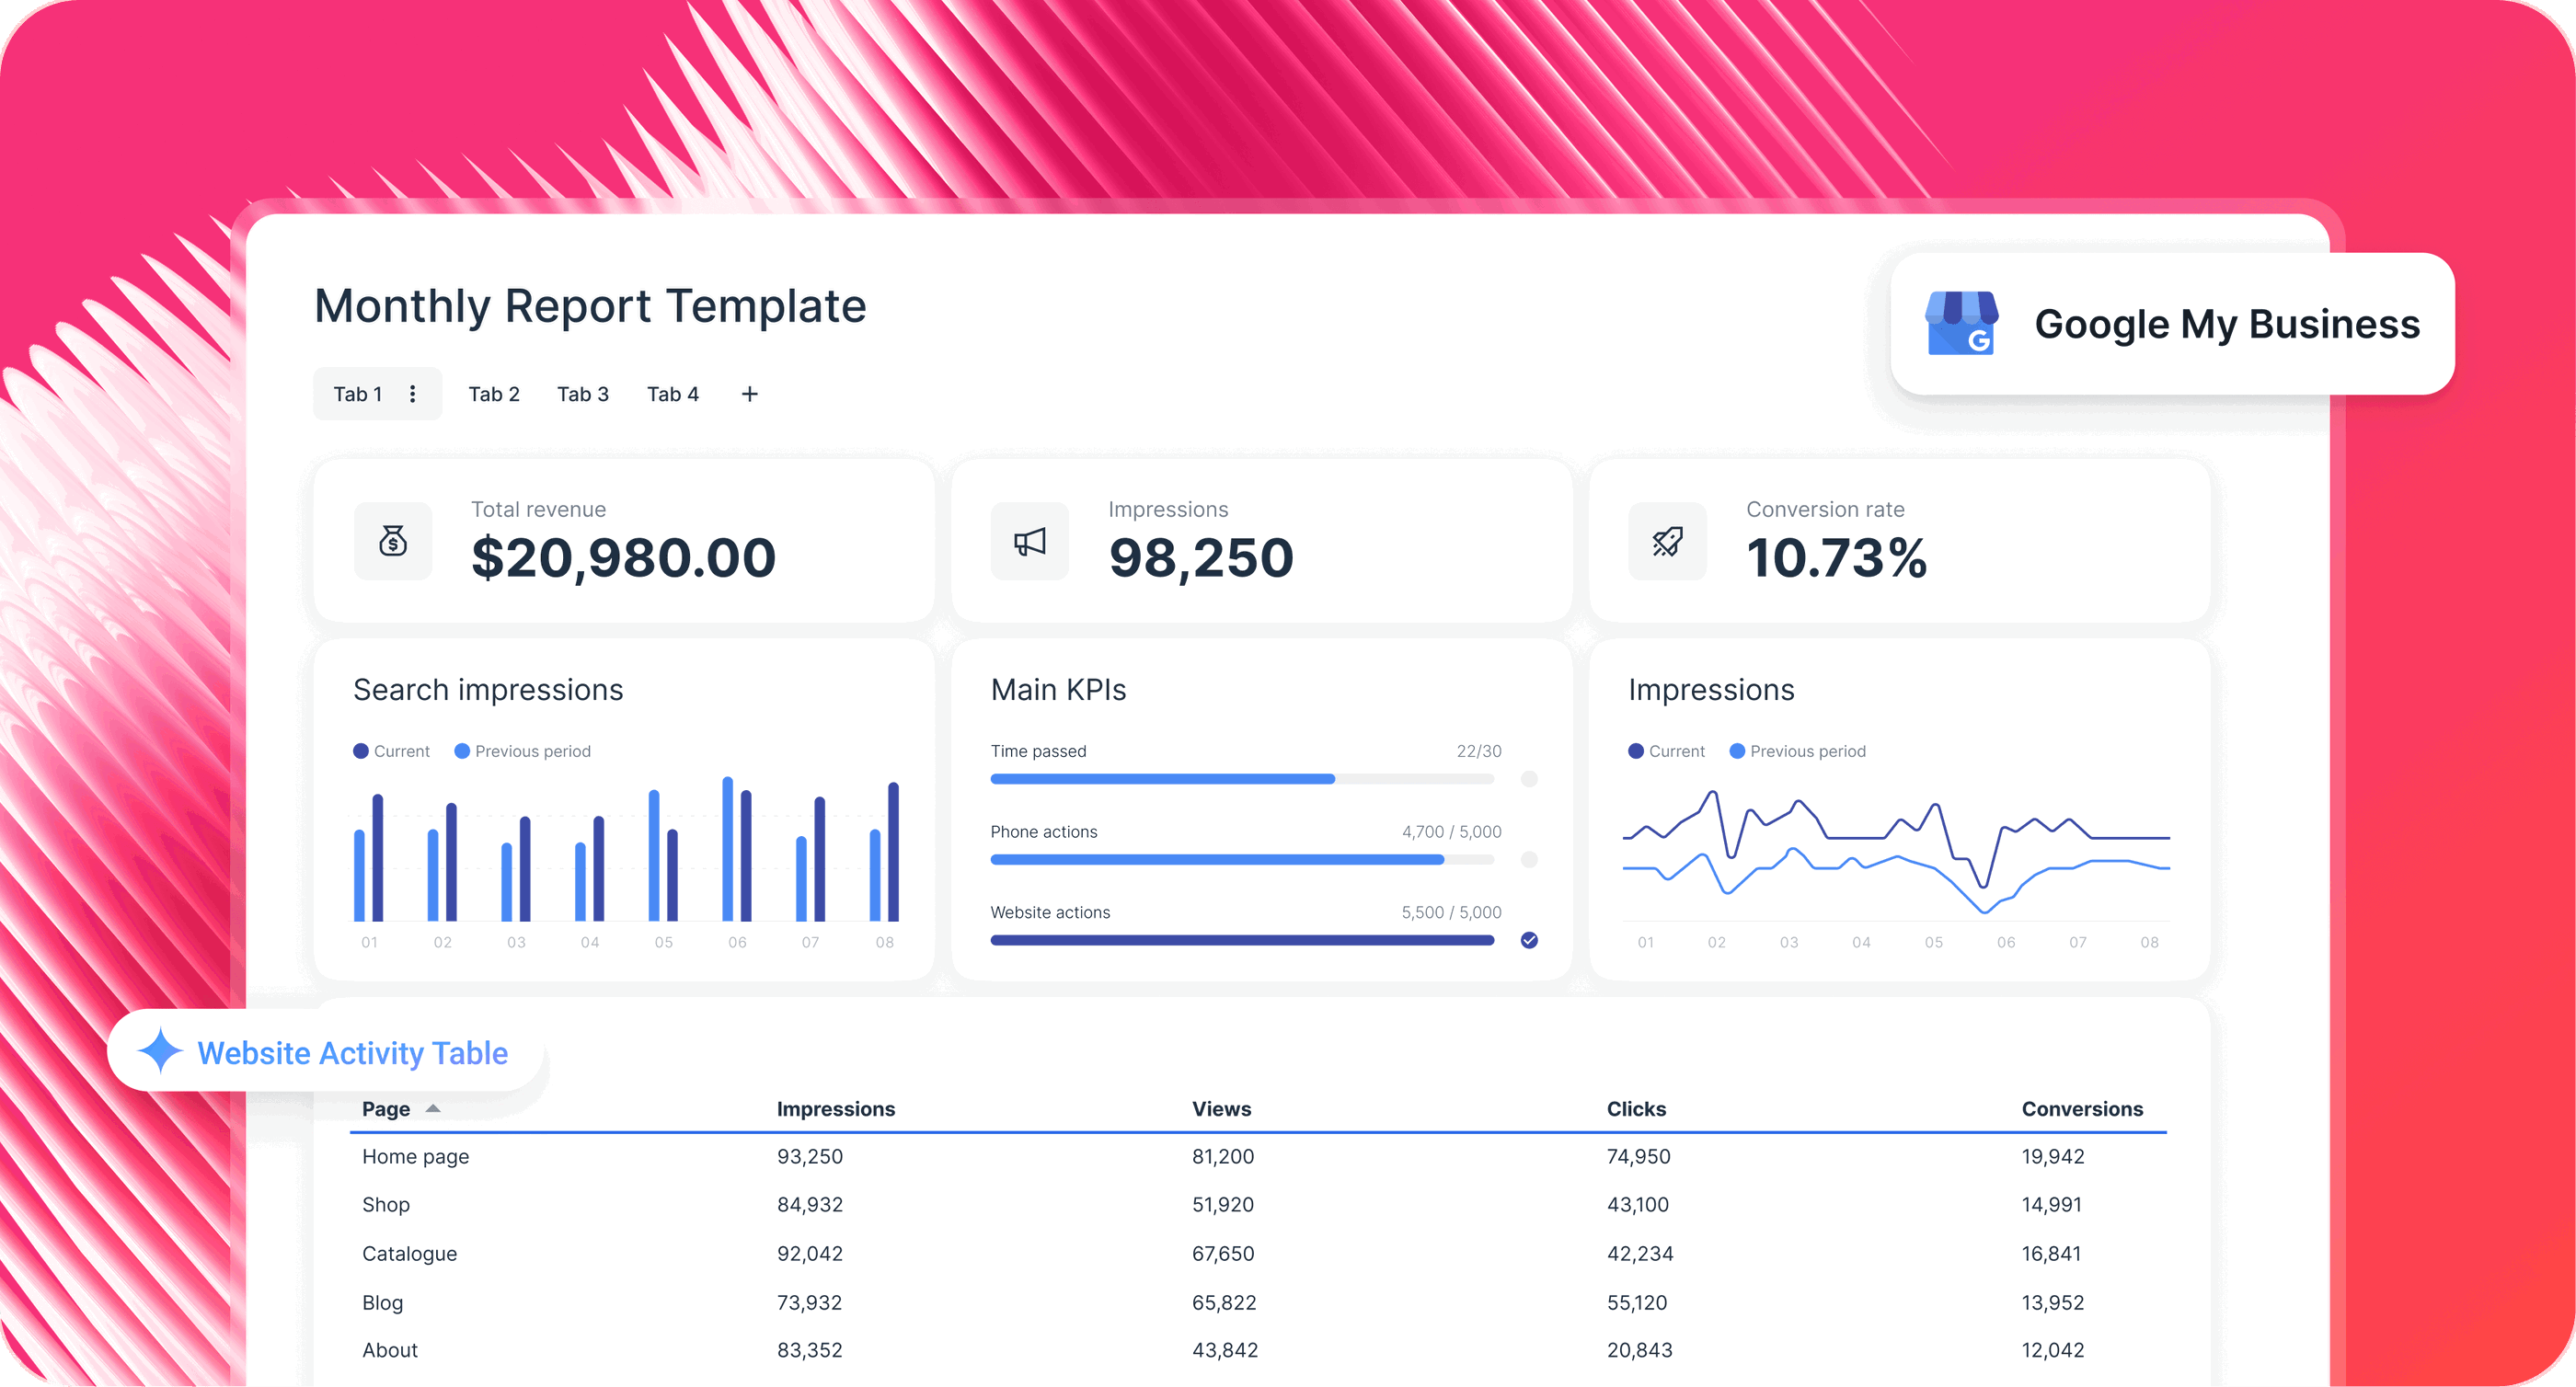
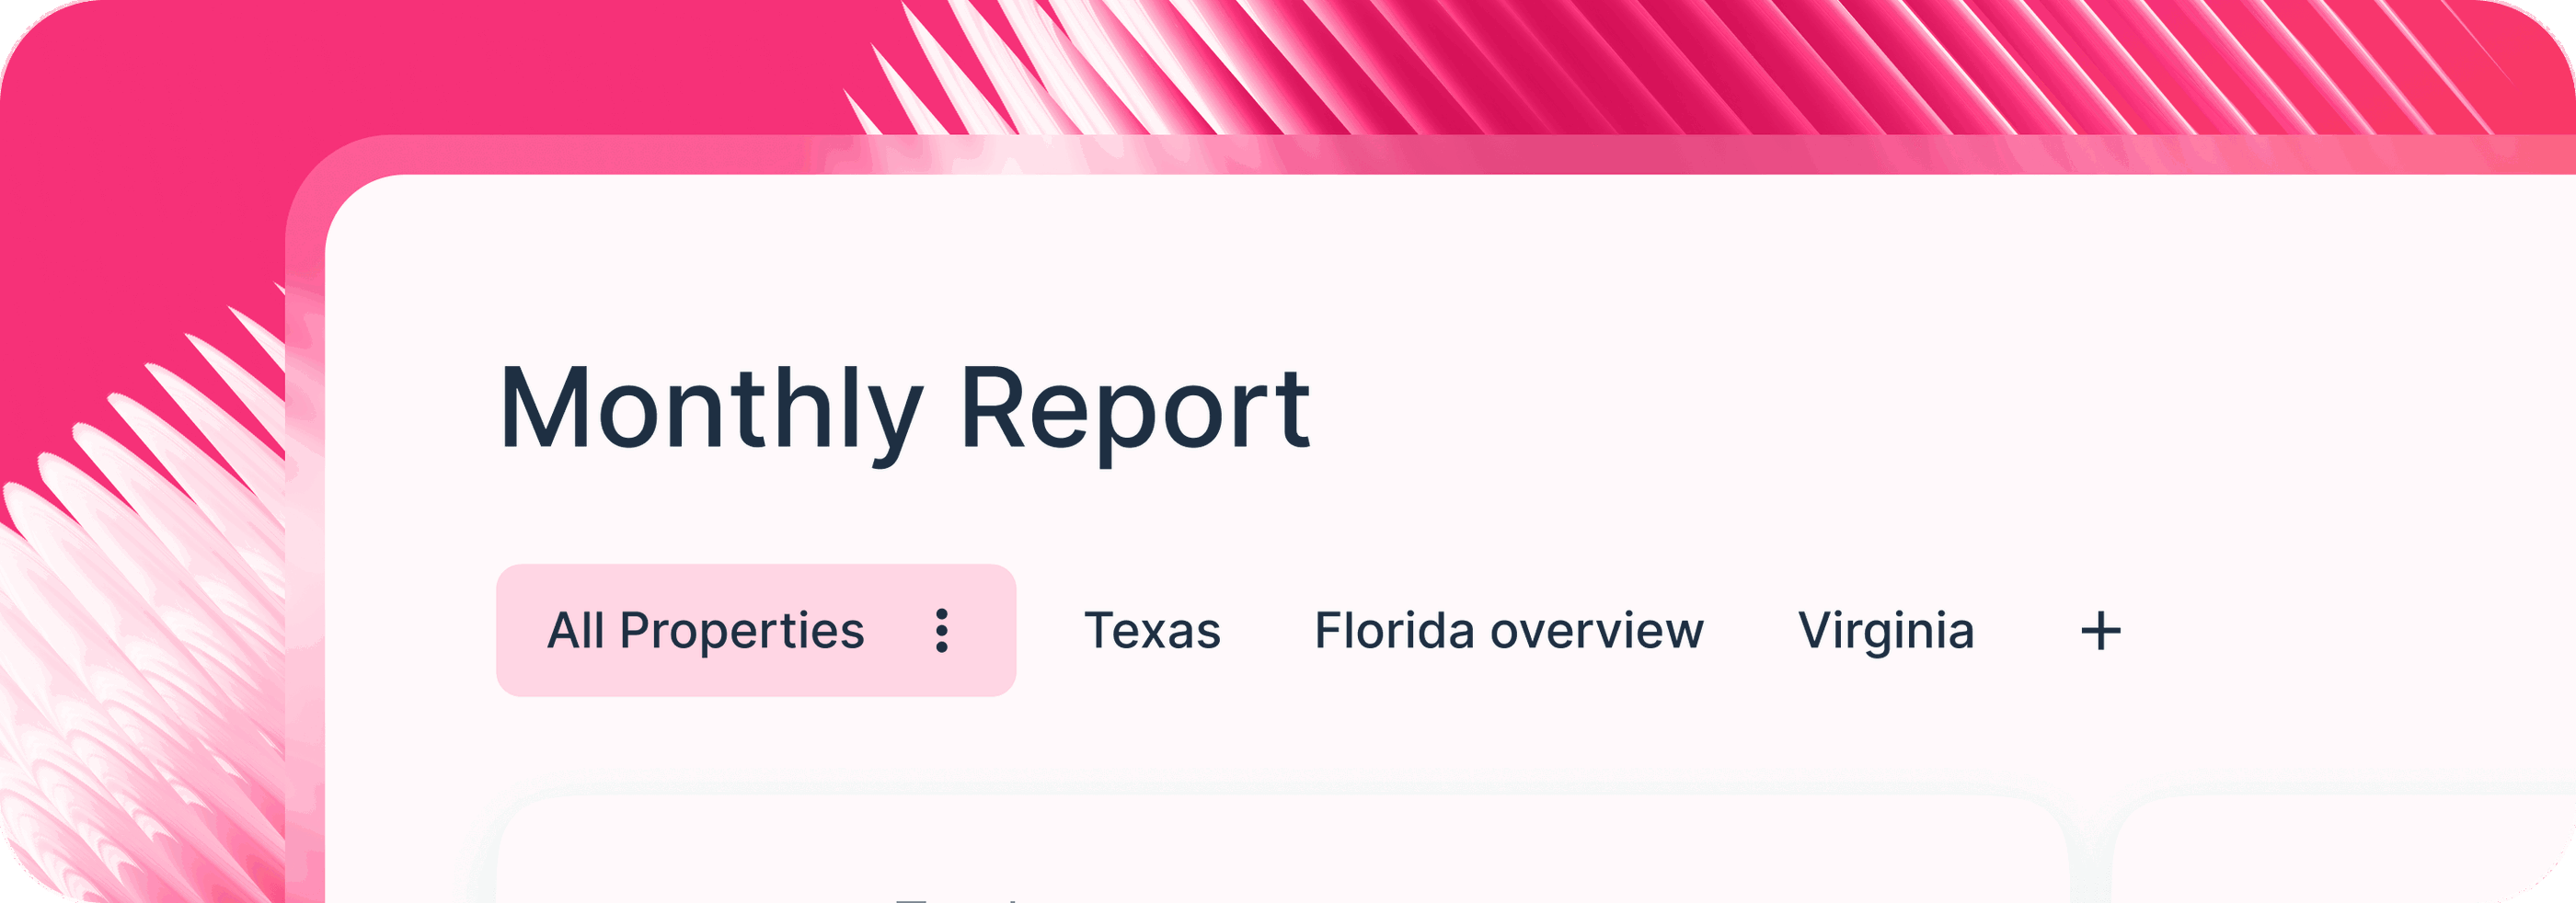
Within each report, Danielle’s team uses tabs to break down performance by property, state, city, or onboarding date according to the customer's needs.
These tabs make it easy to tailor the experience without duplicating work. For example, if a customer wants to see only properties in Texas or New York City, the team creates tabs that filter by location, while still keeping a full overview in an “All Properties” tab.
On top of templates and tabs, Whatagraph also comes with:
- Spaces for organization: Group reports, dashboards, and integrations into folders your team can easily access.
- Linked templates: Update once and roll changes out across every client report.
- Custom tags: Organize sources by industry, region, account manager, or client name, and filter performance at any level without messy workarounds.
- Source groups: Combine multiple data sources into a single group to report on them together and aggregate metrics seamlessly.
- Global themes: Apply branding at scale so every report is white-labeled in seconds.
With Whatagraph, agencies and in-house teams can scale reporting from one brand to hundreds of clients or thousands of data sources, without breaking a sweat.
#5. Customizable reports
Most reporting platforms force you to spend hours formatting reports manually. Fonts, colors, layouts—every detail needs to be tweaked for each client. And if you’re managing multiple clients or brands, keeping everything consistent is nearly impossible.
Reports shouldn’t just be accurate—they should also look professional and reflect your client’s brand automatically.
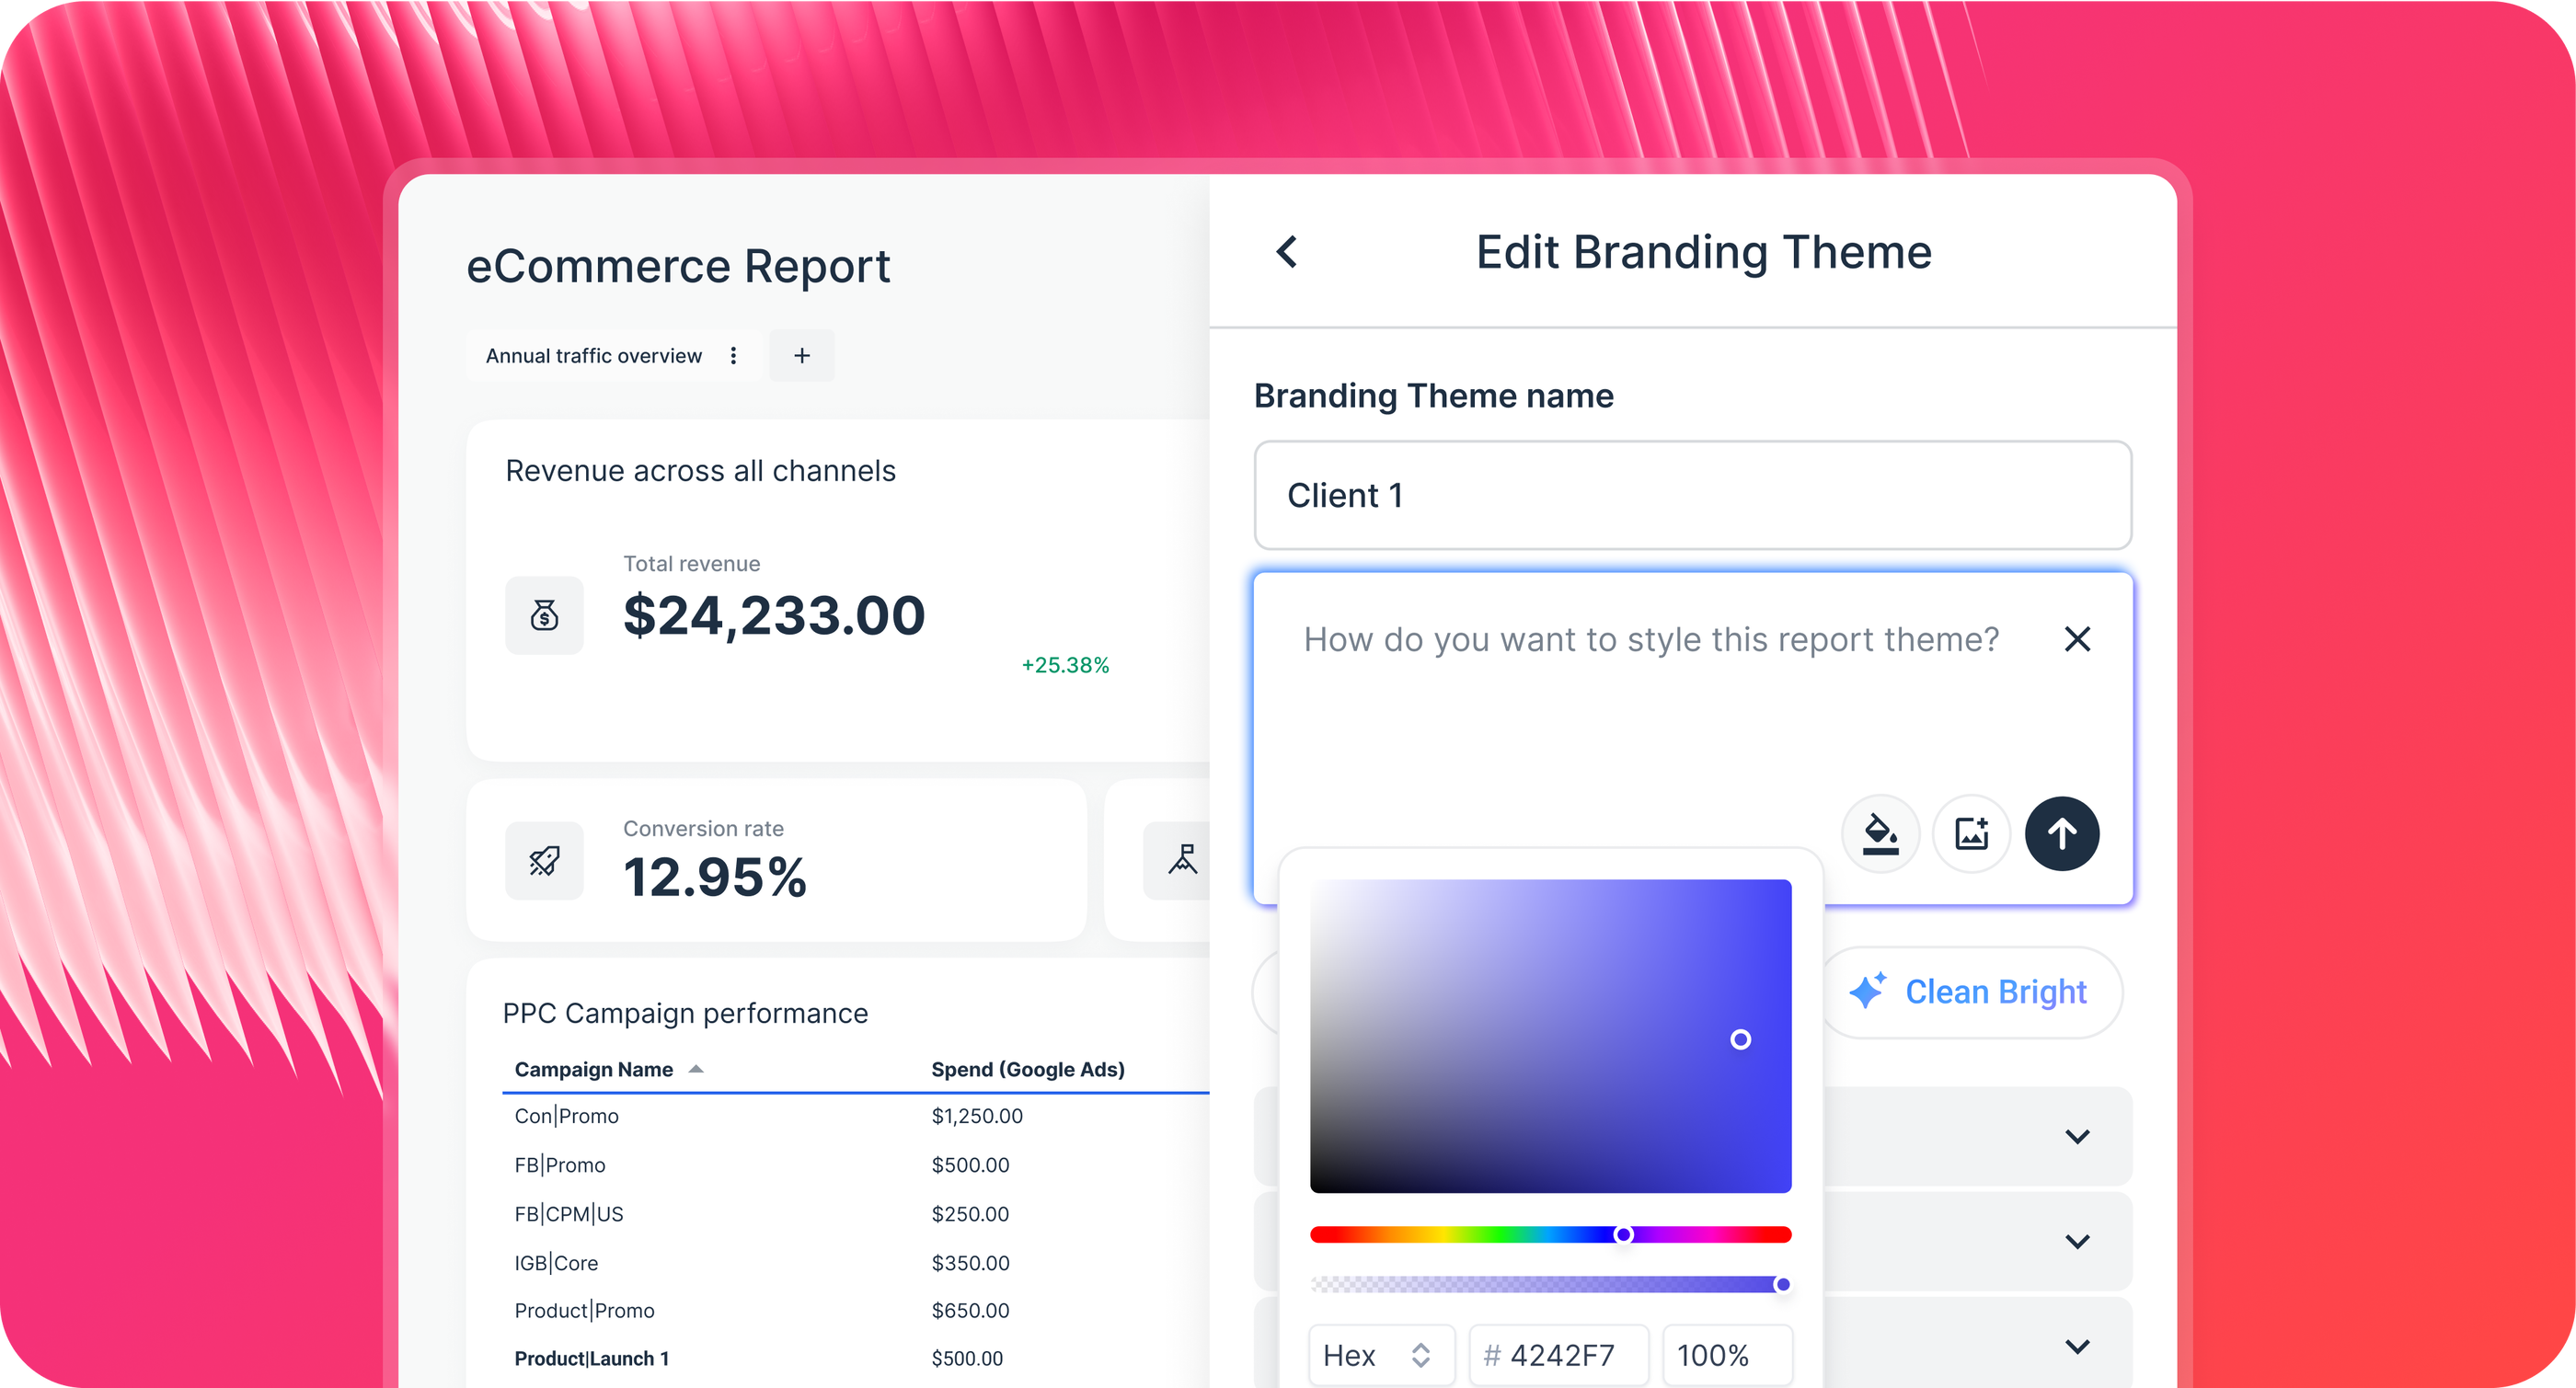
Whatagraph IQ makes customization effortless:
- Brand reports in seconds. Upload a logo, brandbook, or even just an image, and IQ instantly applies matching fonts, colors, and layouts.
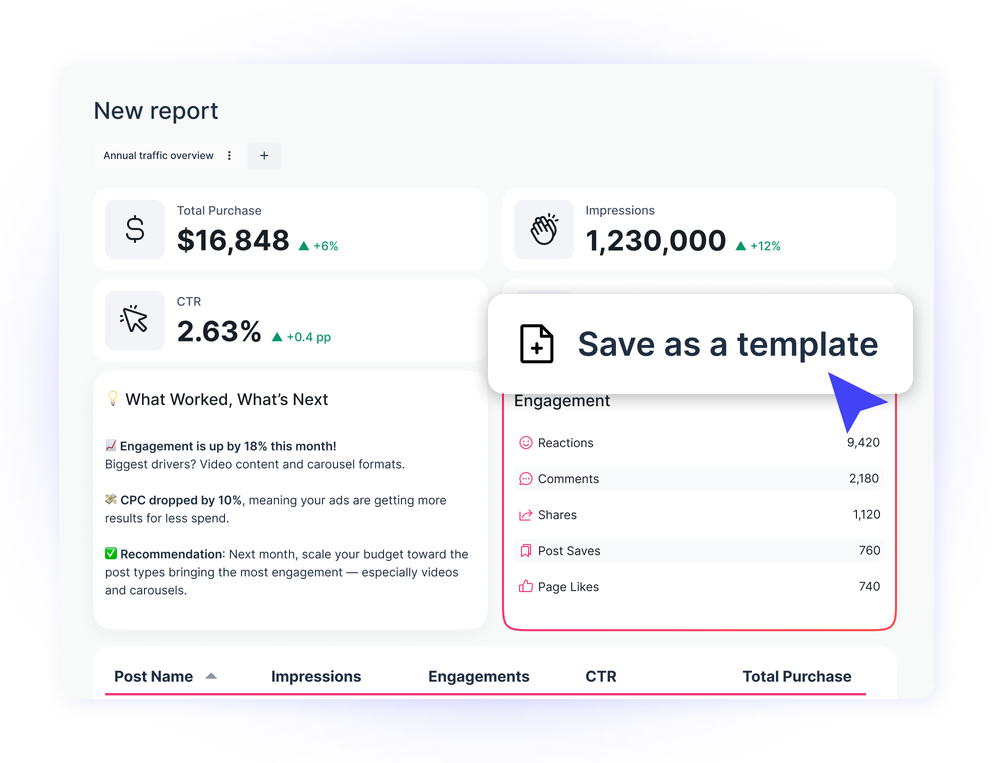
- Fine-tune the details. Adjust styles manually if you want full control, and save these as reusable themes.
- Share branded templates. Once a theme is created, turn it into a template you can roll out across clients—ensuring every report is consistent and on-brand.
With IQ Themes, you spend less time designing and more time delivering insights—while every report looks polished, professional, and ready to share.
#6. Customer support
No matter how intuitive your marketing analytics tool is, there will always be moments where you need help—whether it’s migrating data, connecting a tricky source, or troubleshooting something unexpected.
Too many platforms leave you stranded with slow ticket systems, minimal documentation, or no dedicated support at all.
Kim Strickland from Peak Seven experienced this when her team relied on Looker Studio. Whenever something broke, there was no one to call. Reports stalled, data had to be triple-checked manually, and clients were left waiting.
That's why reliable, responsive support is critical when choosing a marketing agency reporting tool. If your team is stuck waiting days for answers, reporting becomes a bottleneck—and client trust suffers.
With Whatagraph, you’re never left on your own:
- Live chat on all plans: Our support team replies in under 4 minutes and resolves most issues within 4 hours.
- Dedicated Customer Success Managers: On advanced plans, a CSM personally guides you through onboarding, migrations, integrations, and even helps create your first reports.
- Proactive follow-ups: Complex issues are tracked until resolution, with daily updates so you’re always in the loop.
This level of support is why agencies like Dtch. Digitals rave about the experience. As Stef Oosterik, Quality Manager, shared:
The support team is very responsive. This makes it easy for us to give feedback, think of solutions, and get the right data visible for clients quickly. 9 out of 10 cases get resolved, and most are fixed within a day.
And Kim told us:
I’ve joked about this often—with Whatagraph, we’re not paying for a reporting system. We’re paying for customer support. There’s a level of dedication from the Whatagraph team that you don’t often experience anywhere else.
For marketers, this means peace of mind. Whether you’re launching your first campaign dashboard or scaling to hundreds of clients, help is always a message away.
#7. Data security
When you’re handling client or company data, security isn’t optional.
Marketing data includes budgets, performance metrics, and customer insights, and even a small leak can damage trust permanently. Too many reporting platforms overlook this, leaving gaps in access controls, uptime monitoring, or compliance.
Agencies and in-house teams alike know how sensitive this issue is. Clients demand not only accurate reporting, but also confidence that their data is safe, compliant, and available whenever they need it. If your reporting tool can’t guarantee that, the risk outweighs any convenience.
Whatagraph takes security seriously at every level:
- Single Sign-On (SSO). Available on advanced plans, SSO keeps user access centralized and secure, reducing the risks of shared logins or weak passwords.
- GDPR compliant, All data is processed under strict GDPR regulations, so you and your clients stay compliant automatically.
- Data hosting & encryption. Marketing data is encrypted in transit and at rest, and securely hosted in EU-based servers with strict access controls.
- ISO 27001 certified. Whatagraph follows international best practices for information security management, with strict policies for data protection, risk management, and compliance.
For agencies, this means peace of mind when handling multiple client accounts. For in-house teams, it means you can connect, store, and report on sensitive marketing data without exposing it to unnecessary risk.
How to report on performance in digital marketing
The easiest way to report on marketing performance is to use a dedicated reporting tool. For example, in Whatagraph, you can start tracking and reporting performance in four simple steps:
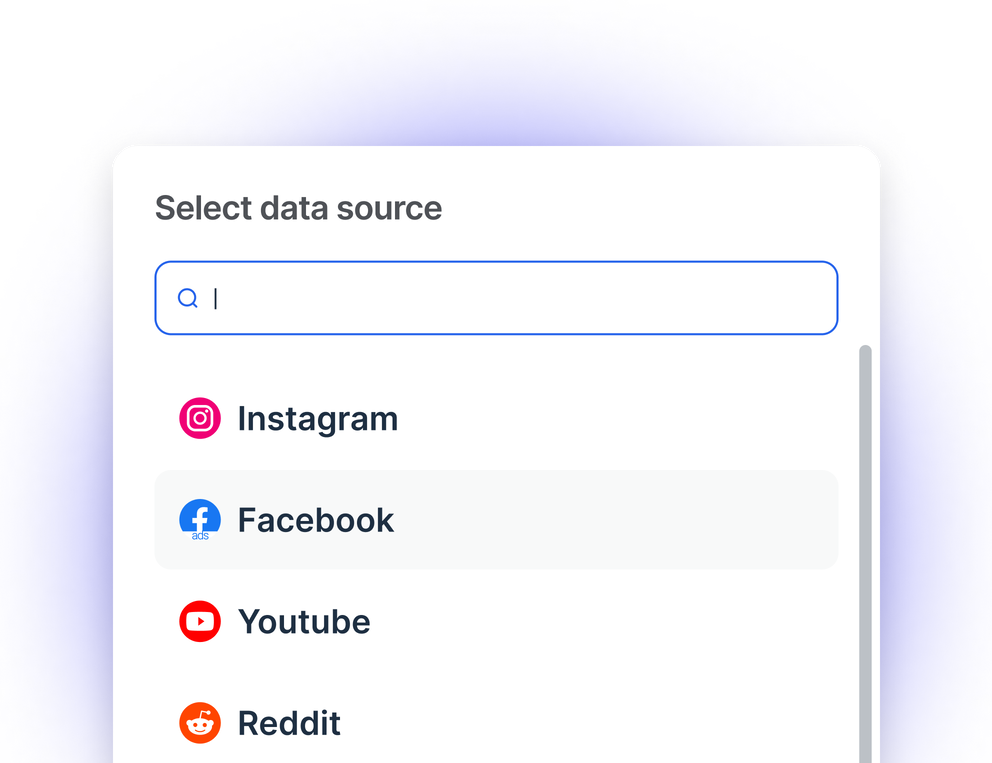
Step 1. Connect your data sources.
Start by connecting the digital marketing channels from which you want to pull data. You can do this in a few clicks.
If you want to connect data from a custom source or niche platform, you can build a custom integration easily using our Custom API.
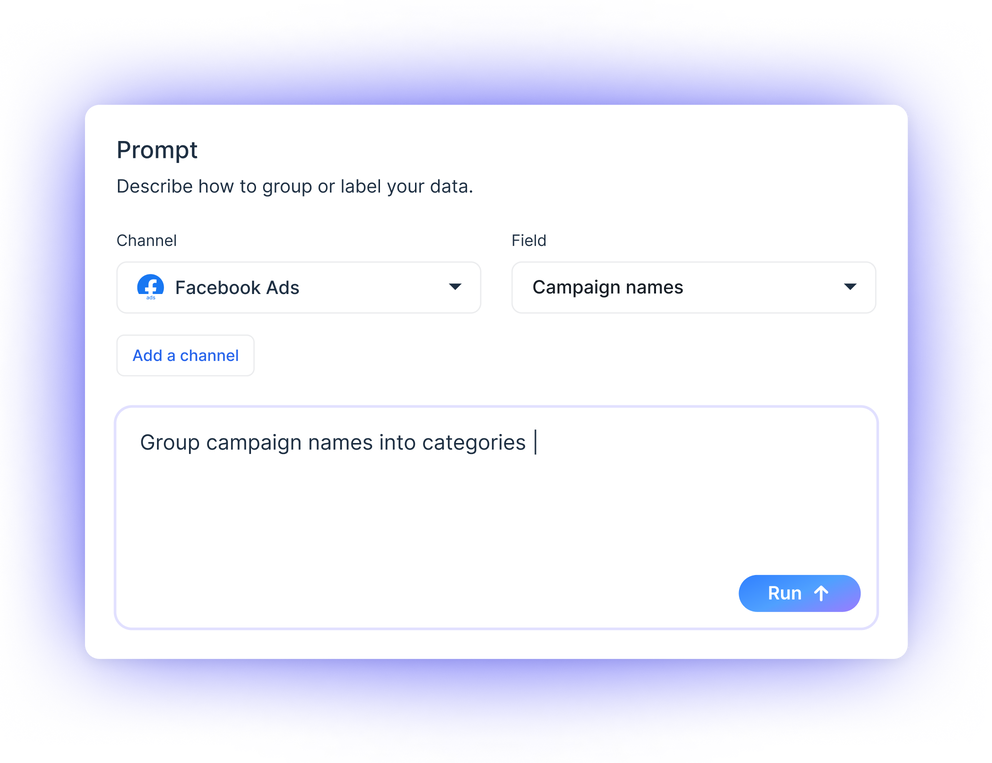
Step 2. Organize your data.
Once your data sources are connected, you can organize the data so it’s easy for your team and clients to digest.
Whatagraph’s no-code Organize workflow helps you:
- Create data blends from different sources
- Unify metric and dimension names
- Standardize campaign names
- Segment data by specific demographics or geographics
As a result, you get standardized, unified marketing dashboards that both your teammates and clients can easily understand. The benefits are:
- More comprehensive performance view
- Fewer data discrepancies
- Fewer questions from clients or your team about the data on reports
Step 3. Visualize the data.
Turning raw numbers into clear, actionable insights is often the hardest part of reporting. Most tools force you to drag widgets, manually style layouts, or spend hours formatting charts just to make data client-ready.
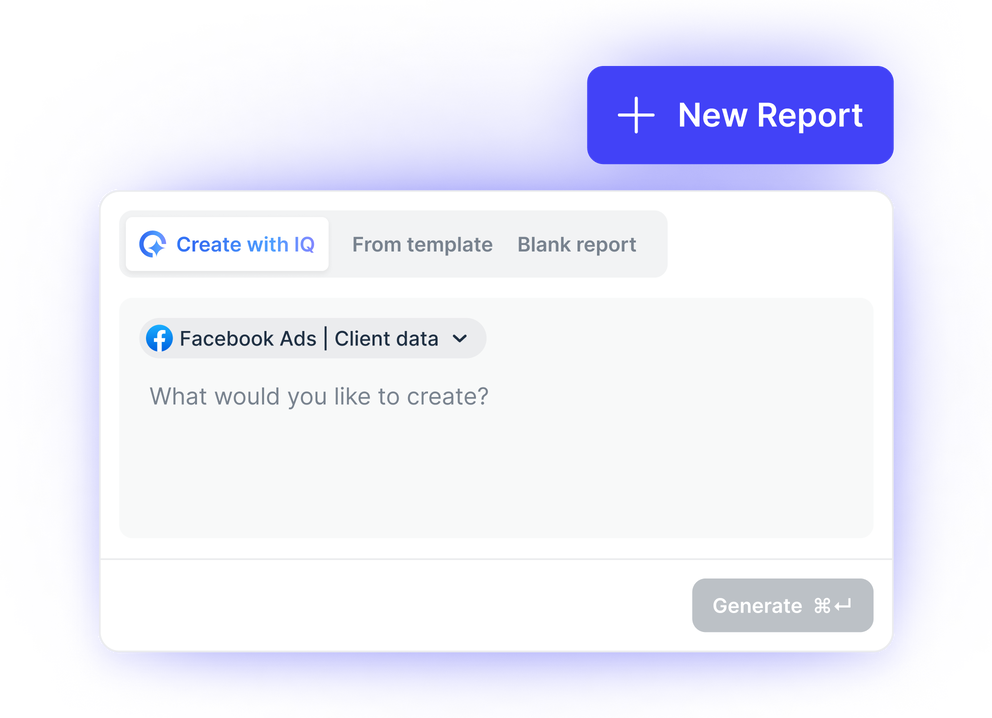
With Whatagraph IQ, this step is completely automated.
- Create full reports with a single prompt. Just ask IQ to build a report, and it generates charts, tables, and widgets instantly—no templates, no manual setup.
- Add and edit on the fly. Need another tab or different visualization? Simply type it in, and IQ updates your report in seconds.
- Brand reports automatically. Upload a logo, brandbook, or image, and IQ Themes apply matching fonts, colors, and layouts so every report looks polished and on-brand.
Instead of wrestling with widgets or formatting, you get ready-to-share reports that are accurate, professional, and customized for your audience—created in minutes, not hours.
Step 4. Share the reports.
The last step is to share your reports with your clients or team.
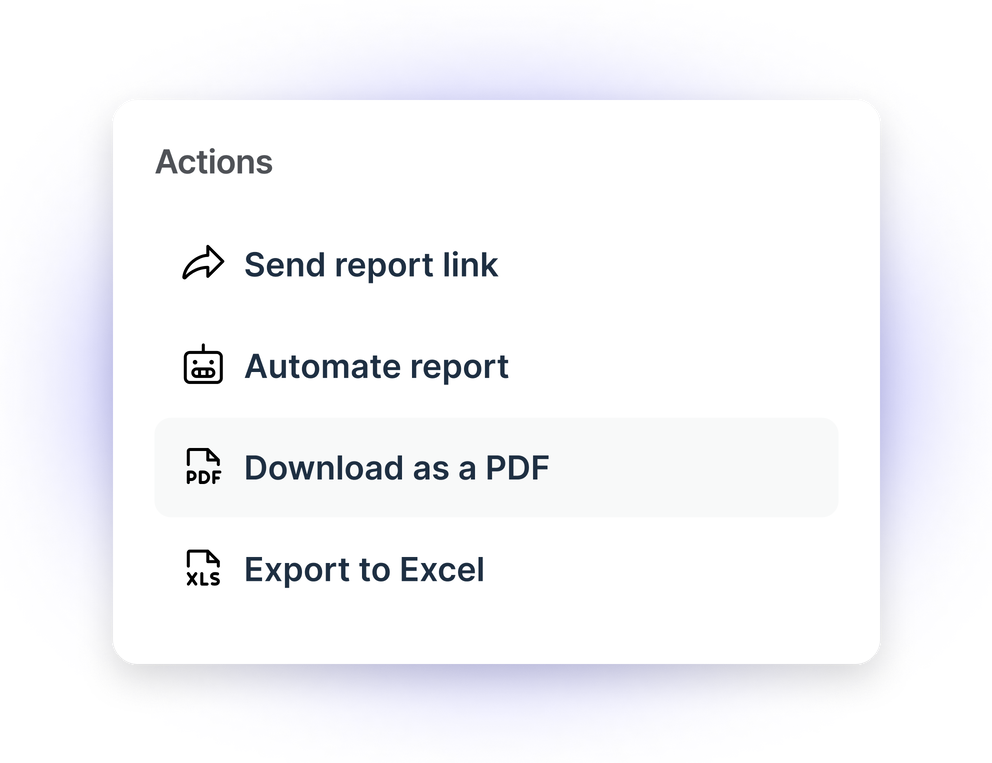
You can do this in Whatagraph in three main ways:
- Share report links with anyone you’d like.
- Send white-labeled, automated emails at a regular interval (e.g. every week or month).
- Export as Excel or CSV — a great option if you want to run the data through your business intelligence tool.
You can also transfer data to BigQuery or push it to Looker Studio.