


TL:DR
Geckoboard is a lightweight dashboard tool designed for quick internal data visualization. It’s easy to use and integrates with 90+ channels, but lacks data blending and deep customization needed for advanced marketing reporting.
Who it’s best for:
Small teams and businesses that need to display simple metrics for internal use, not agencies with complex, cross-channel reporting needs.
Key features at a glance:
| Feature | Geckoboard |
| Integrations | ~90+ integrations, but lacks SEO and niche tools |
| Stable connections | Relatively stable |
| Ease of use | Easy for basic reporting |
| Data blending and custom calculations | Not supported |
| Internal dashboards | Included |
| Customizable reports | Limited customization |
| Report sharing & automation | Email, Slack, link sharing, white-label PDFs available |
| Security | HTTPS encryption, GDPR compliance, SSO (Enterprise only), role-based access control |
Pros ✅
- Easy to connect data sources
- Clean UI with ready-made widgets
- TV/dashboard sharing built-in
- Good for internal metric displays
Cons ❌
- No data blending or custom metrics
- Limited dashboard and widget customization
- Templates and AI insights missing
- Extra users and dashboards add up fast
Geckoboard Pricing
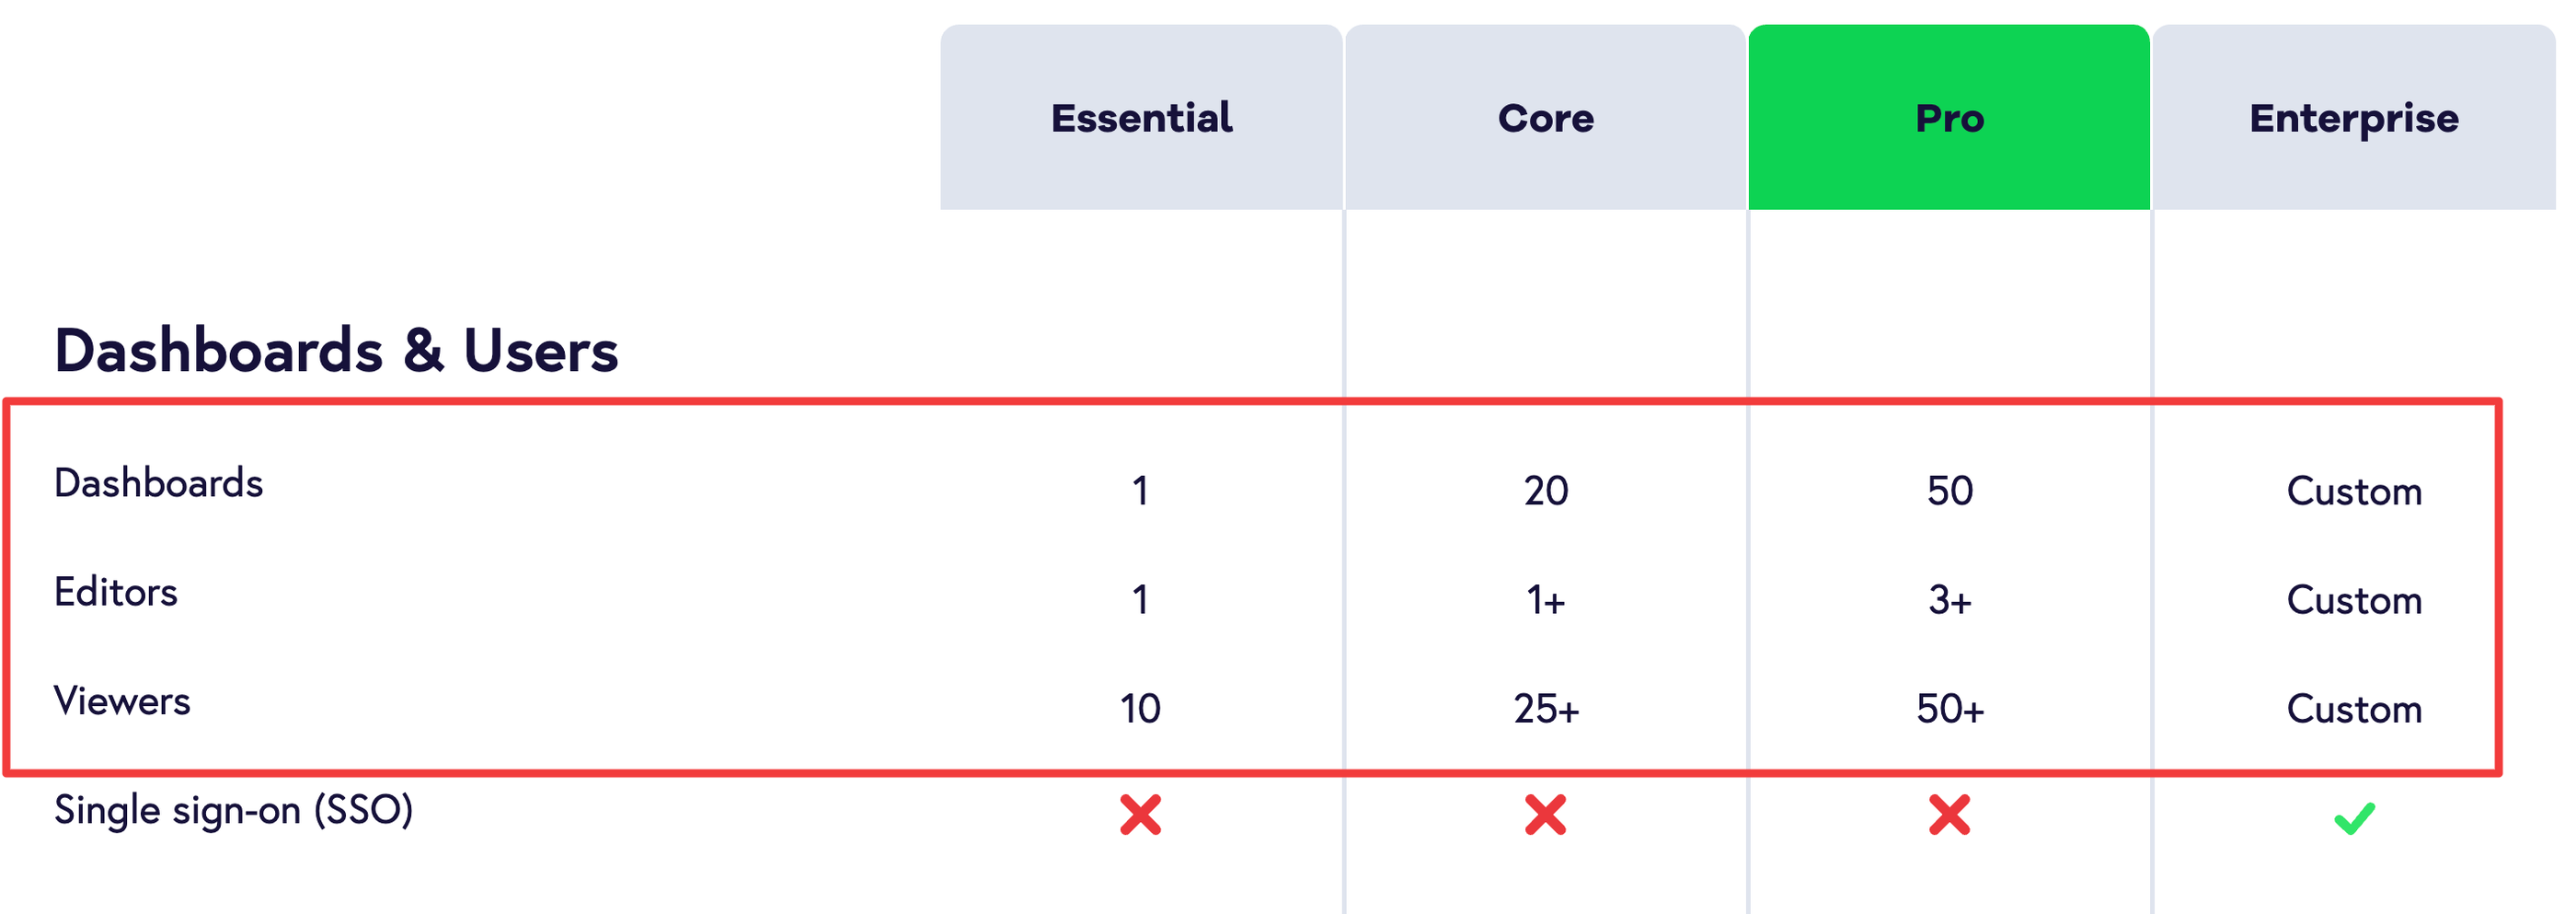
Geckoboard’s pricing is based on the number of dashboards, editors, and viewers you need.
If that sounds a bit technical, here’s what these terms mean:
- Dashboards - The number of dashboards you can create for displaying marketing metrics for clients.
- Editors - Team members who have access to create and modify the dashboards.
- Viewers - People (often clients or team members) who can view the dashboards but can’t make any changes to them.
Each plan has a set number of dashboards, editors, and viewers.
For a more detailed look into the pricing plans, we created an overview table below, based on the information available in May 2025:
| Plan | Price (Monthly) | What’s Included: |
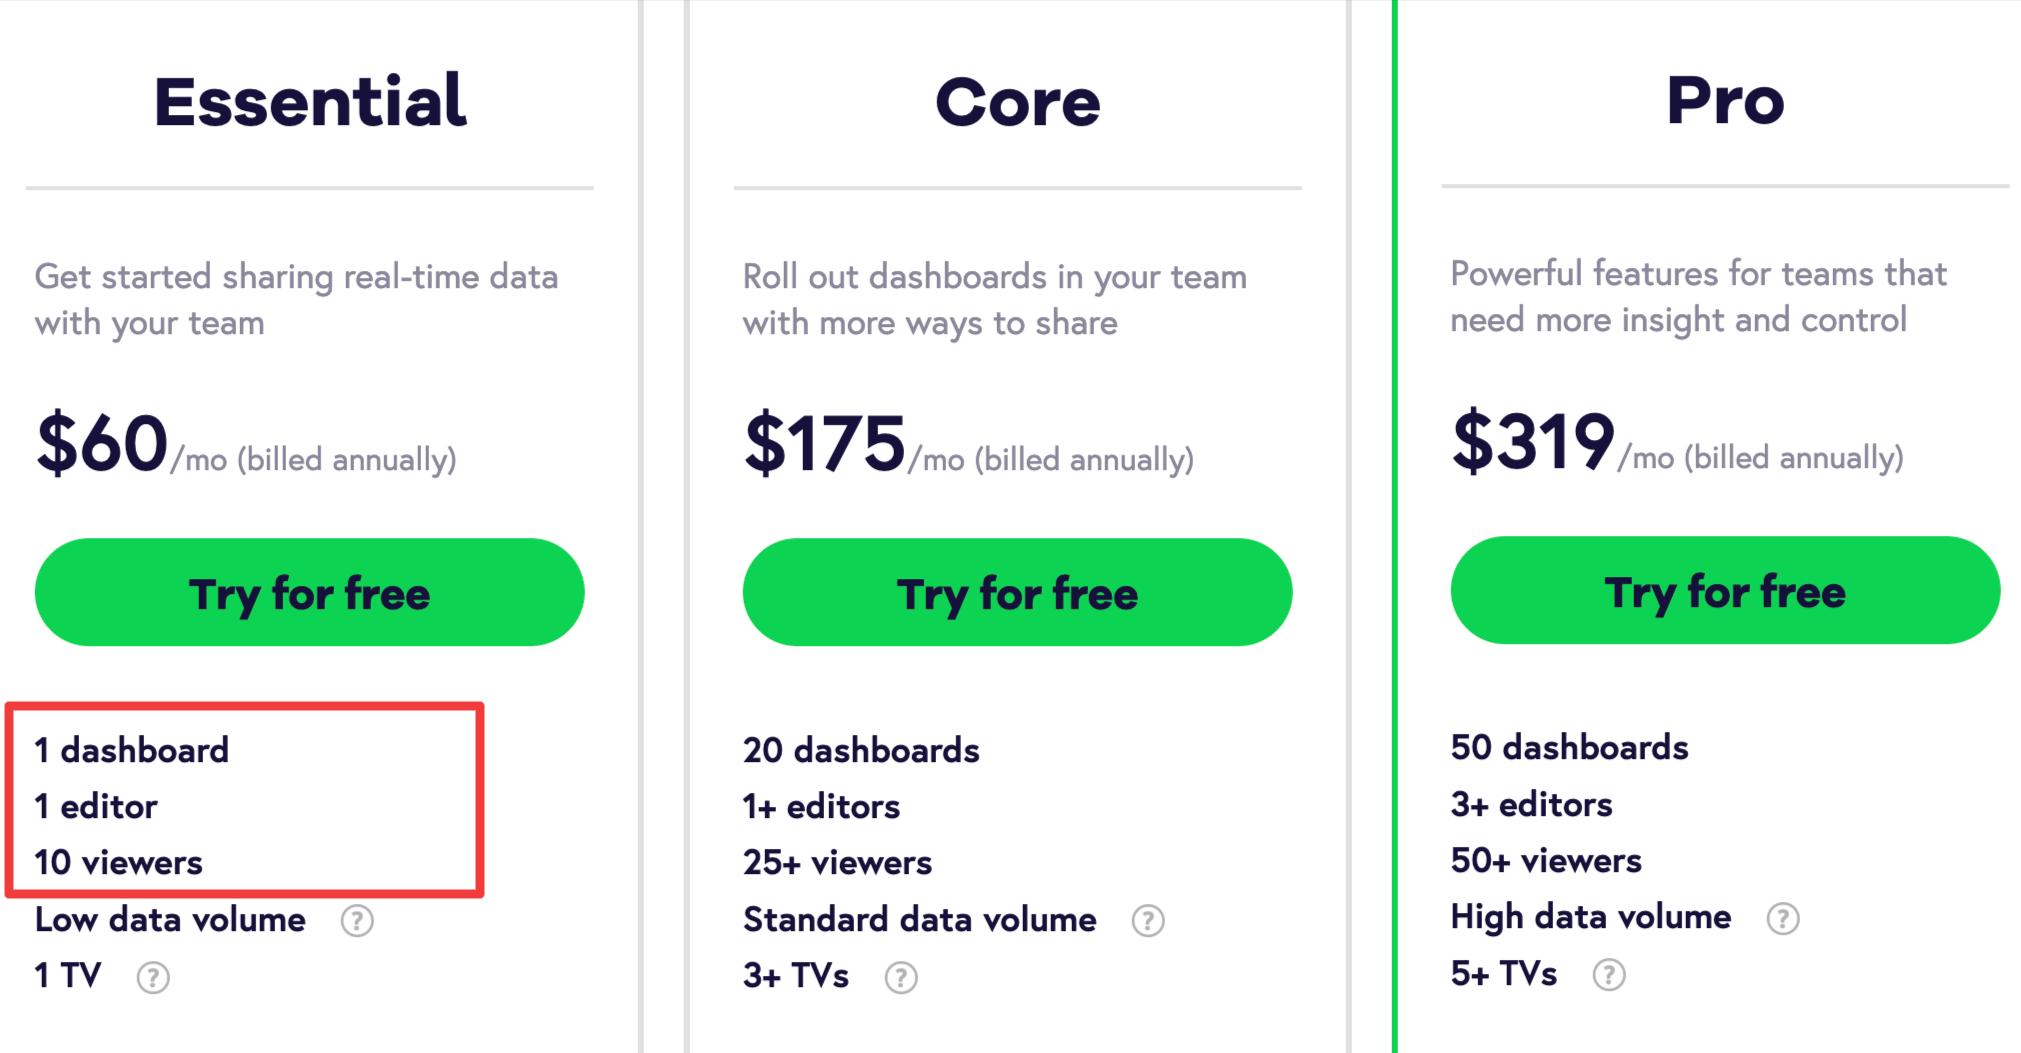
| Essential | $75/month, or $60/month annually |
|
| Core | $219/month, or $175/month annually |
|
| Pro | $399/month, or $319/month annually |
|
| Enterprise | Custom pricing available |
|
Heads-up: If you pass the set amount of dashboards, editors, viewers, or Send to TVs for your plan, you’ll either need to pay extra or upgrade your plan.
Unfortunately, Geckoboard doesn’t share any information publicly on how much each additional dashboard, editor, or viewer costs.
But, we asked their support about the costs, and this is what they said:

This means, each extra editor, viewer, or dashboard adds an additional $25/month cost.
So, while Geckoboard can seem affordable on the surface, the total cost can add up fast— especially if you need to create 10’s of dashboards to visualize your client’s data.
Real User Reviews: What are Customers Saying About Geckoboard?
It’s difficult to get an unbiased opinion of a platform without hearing from real users. So, we looked for Geckoboard feedback on review platforms, like Reddit, G2, and Capterra.
We wanted to understand Geckoboard pros and cons and hear what’s working and what’s not.
| Overall G2 Geckoboard Rating | 4.3 out of 5.0 stars (40+ reviews) |
| Overall Capterra Geckoboard Rating | 4.6 out of 5.0 stars (100+ reviews) |
Geckoboard pros: What real users love
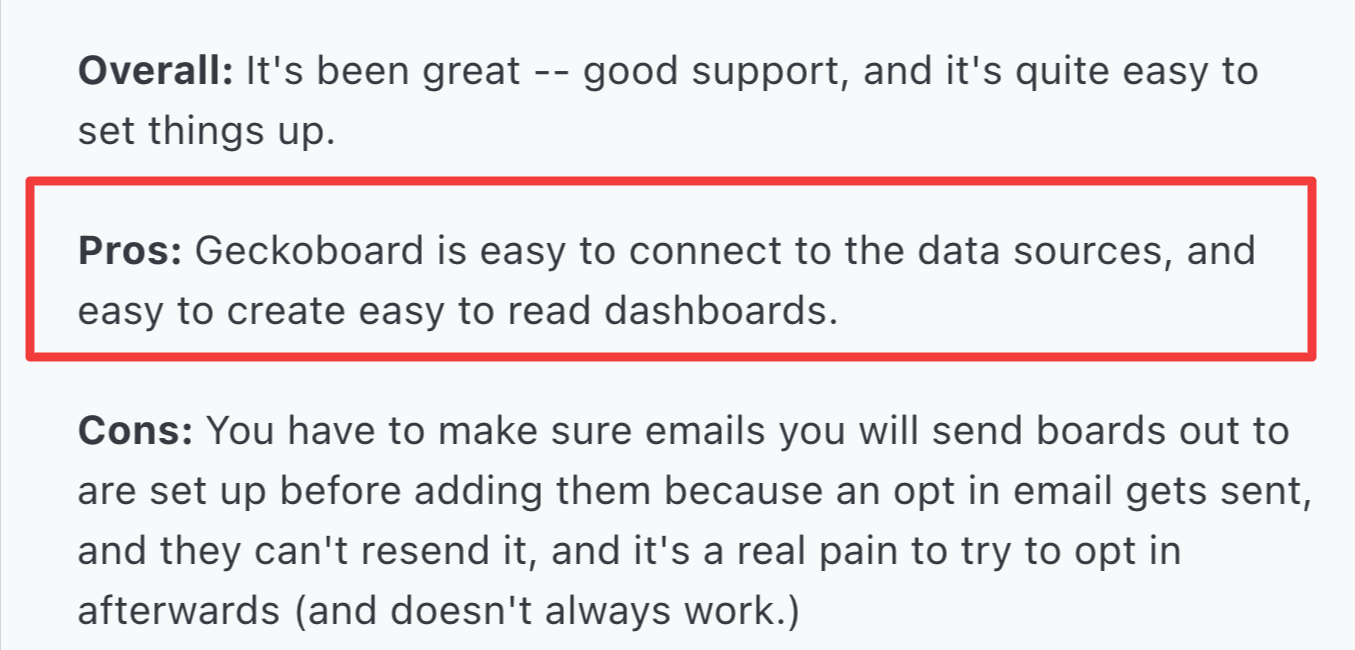
✅ Connecting data sources is easy
As part of the Geckoboard dashboard setup, the first thing you’re asked to do is to connect your data sources. Many Geckoboard reviews from users like Aaron P. say this process is easy.
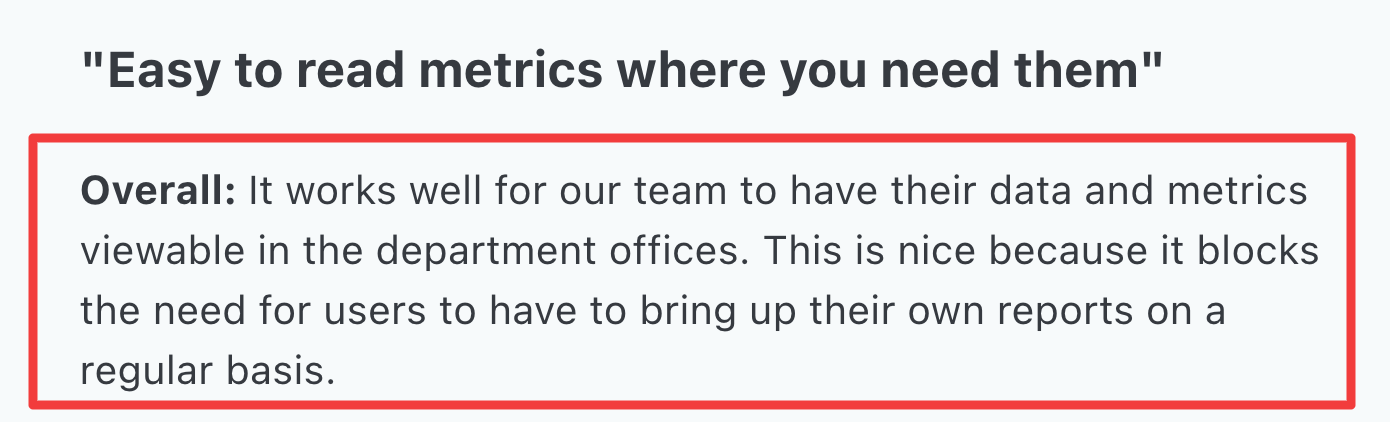
✅ Data for internal teams
This is one of Geckoboard’s main value propositions. Businesses who want to solely track their internal teams key metrics can benefit from it.
One Capterra user specifically said, “It works well for our team to have data and metrics viewable in the department offices.”
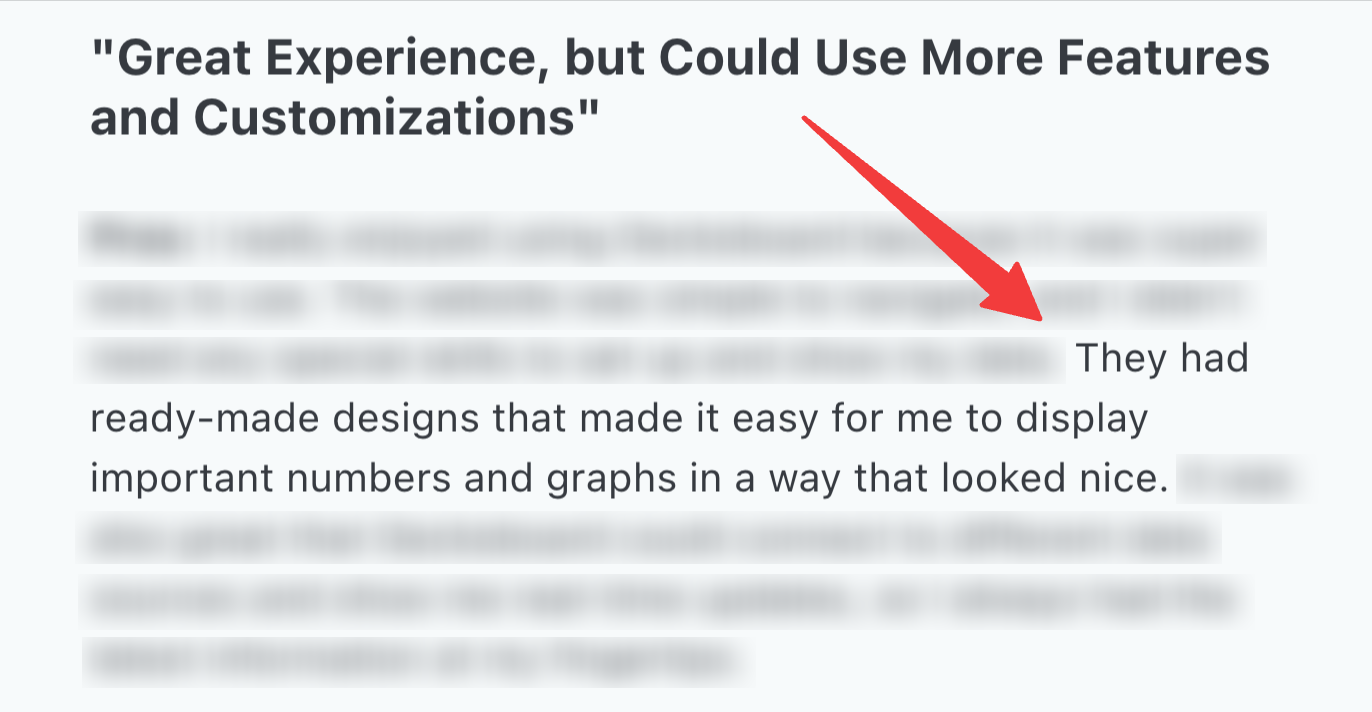
✅ Ready-to-made designs (widgets)
While basically an industry-standard, Geckoboard user reviews said the available widgets are useful for data visualization. Nitin M. on Capterra said, “They help to display important numbers and graphs.”
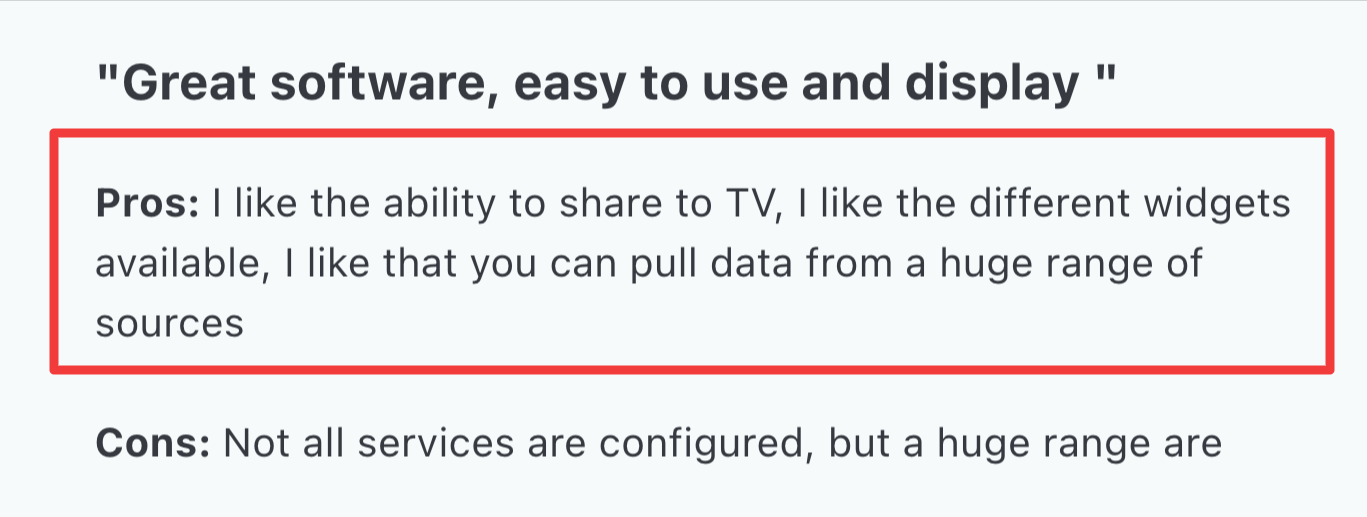
✅ Ability to share on TV
This is a feature many users appreciated. One of the ways to share a Geckoboard dashboard is to share it on a big screen/TV, which reviewers say “helps to improve team performance.”
With that said, let’s look at Geckoboard complaints - things users weren’t satisfied with.
Geckoboard cons: What real users find limiting
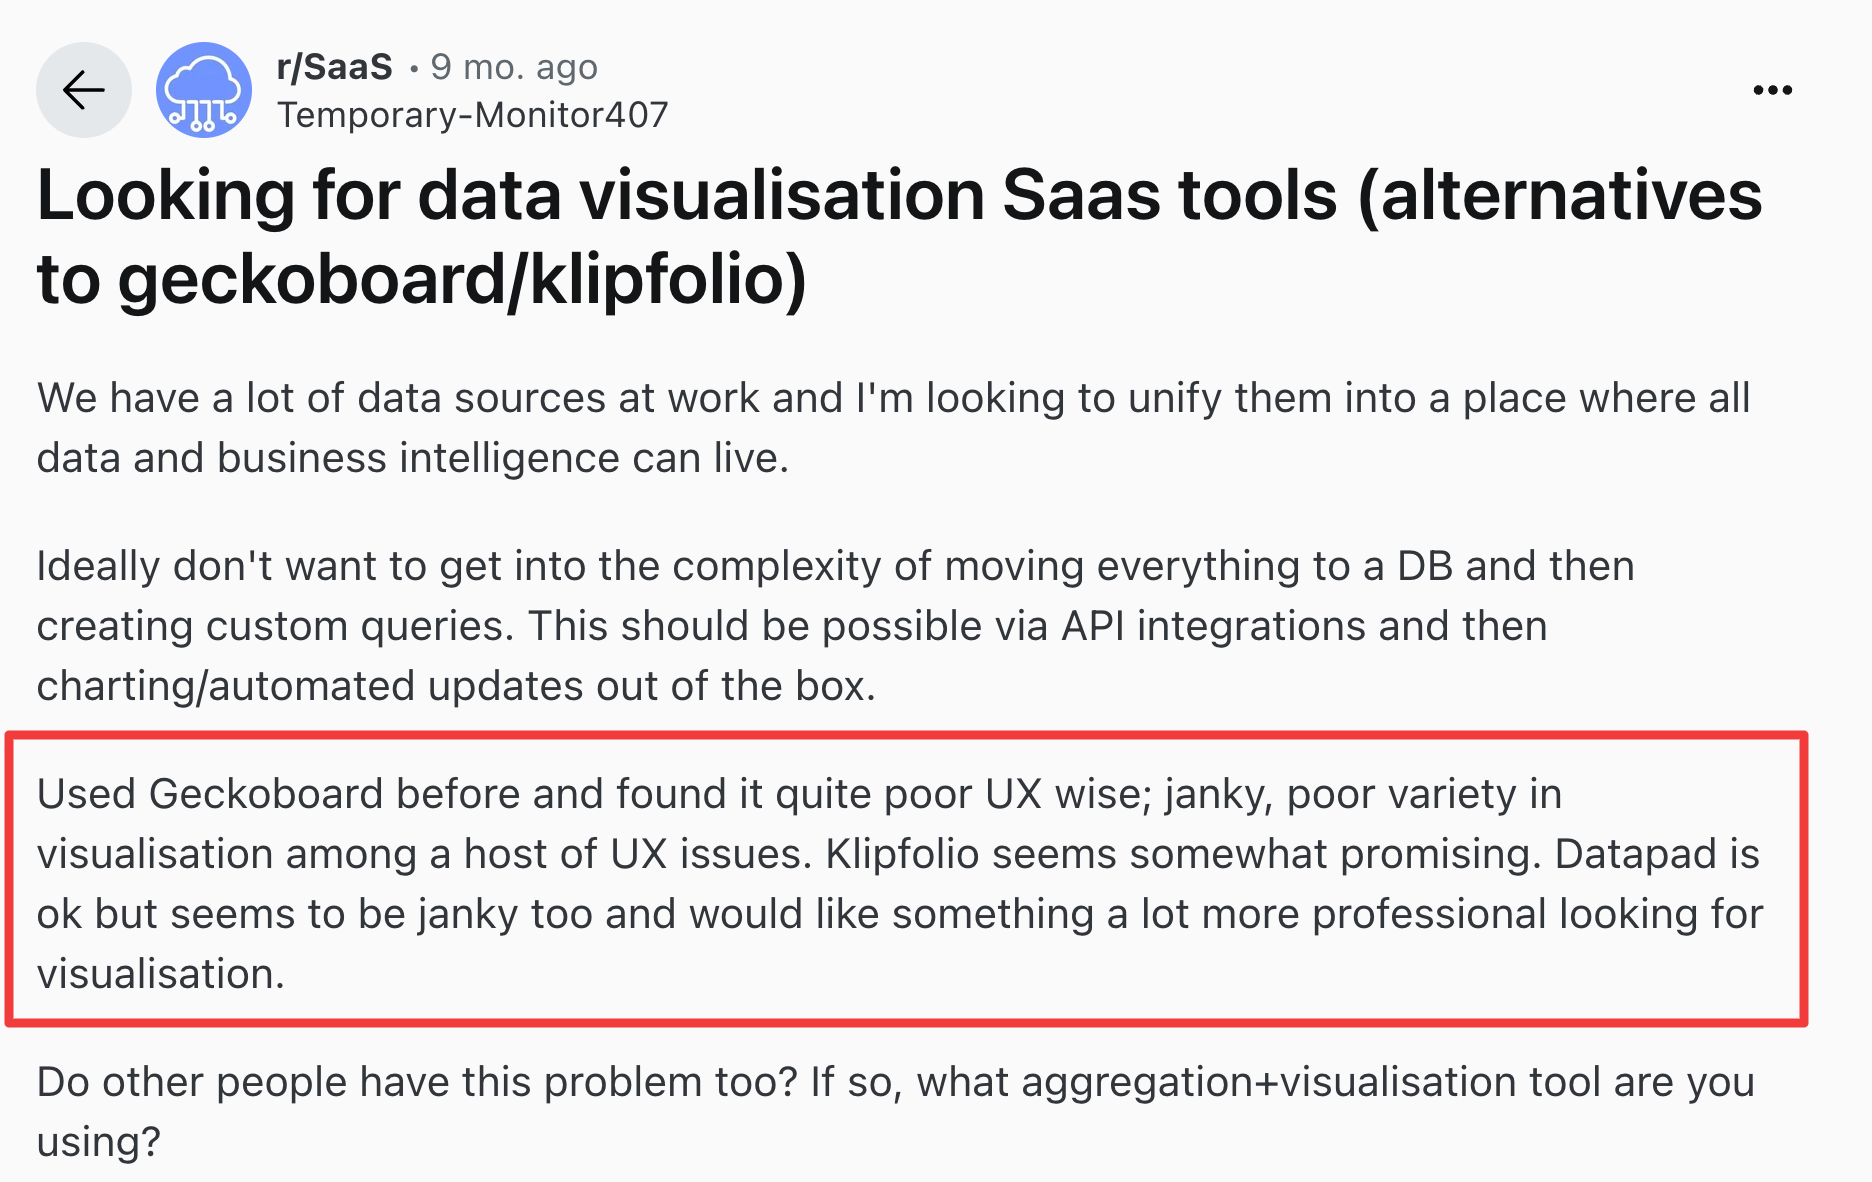
❌ Visually static
This came up often. Geckoboard users say the platform customization is limited and there are a host of UX issues. For example, you can't fully modify your own colour schemes, resize columns within the tables, or drag and drop widgets anywhere you want.
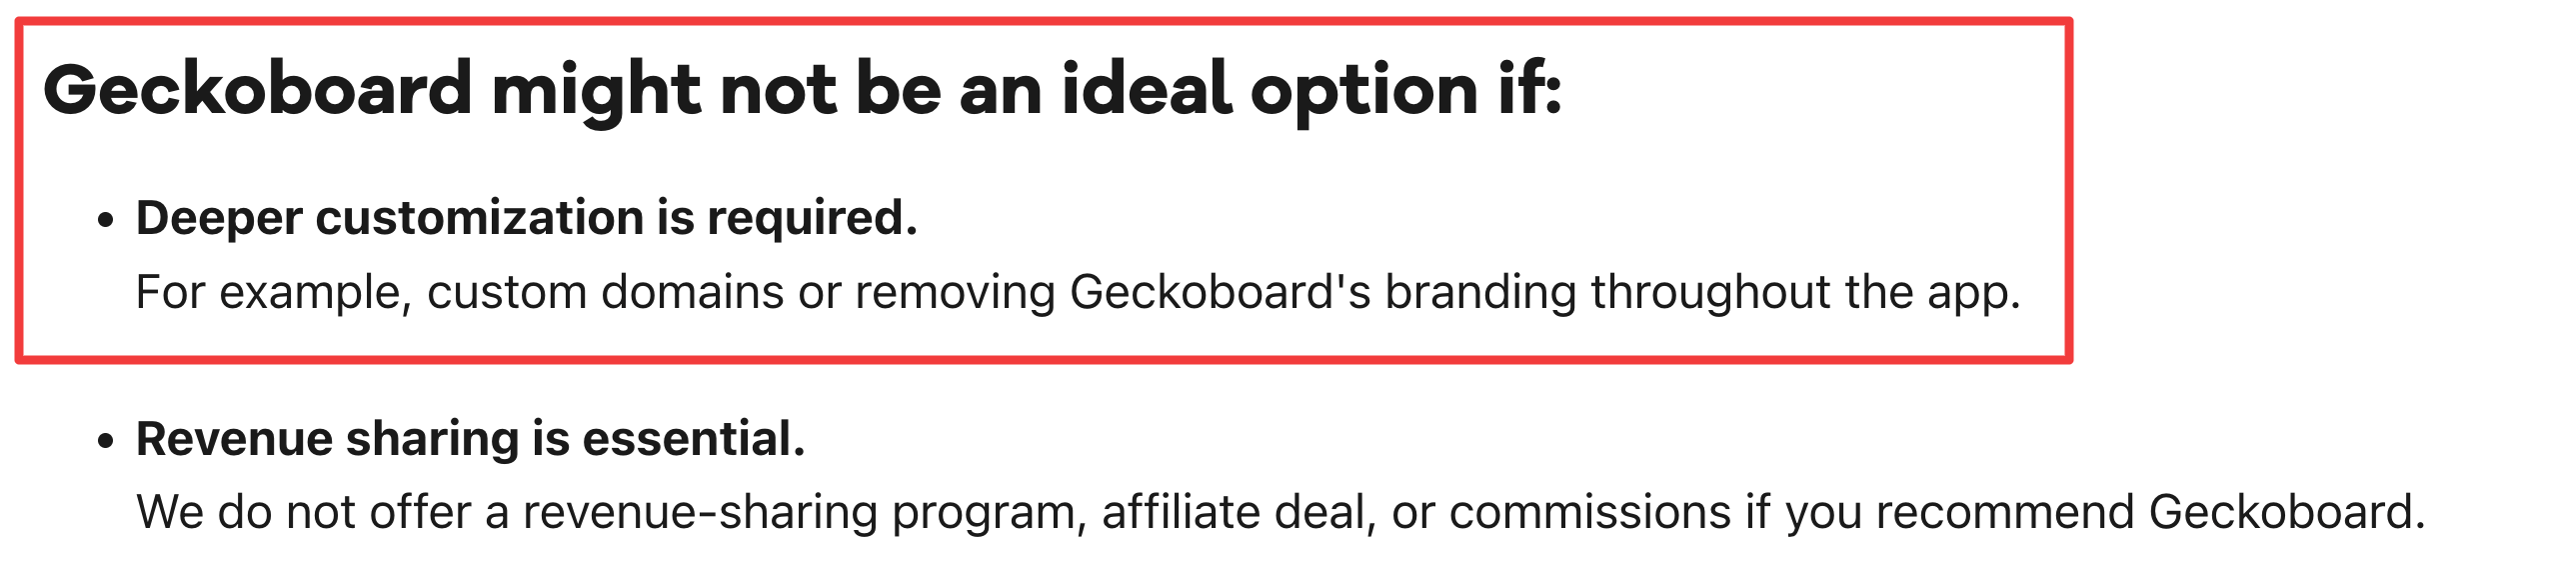
❌ Limited white-labeling
Even on the most expensive plan, Geckoboard’s white-labeling is limited to adding your own logo and selecting your colour theme.
It’s also not possible to remove their branding or add your custom domains, which even Geckoboard says is a limitation.
 ❌ Adding more dashboards can get pricey
We already touched upon this a bit. If you need to add more dashboards, editors, or visitors to Gackoboard, it can get expensive—quickly.
Each extra dashboard, editor, and visitor adds an extra $25/month, and for instance, with the Essential plan, you only get one dashboard and one editor.
 ❌ Lacks functionalities other platforms have
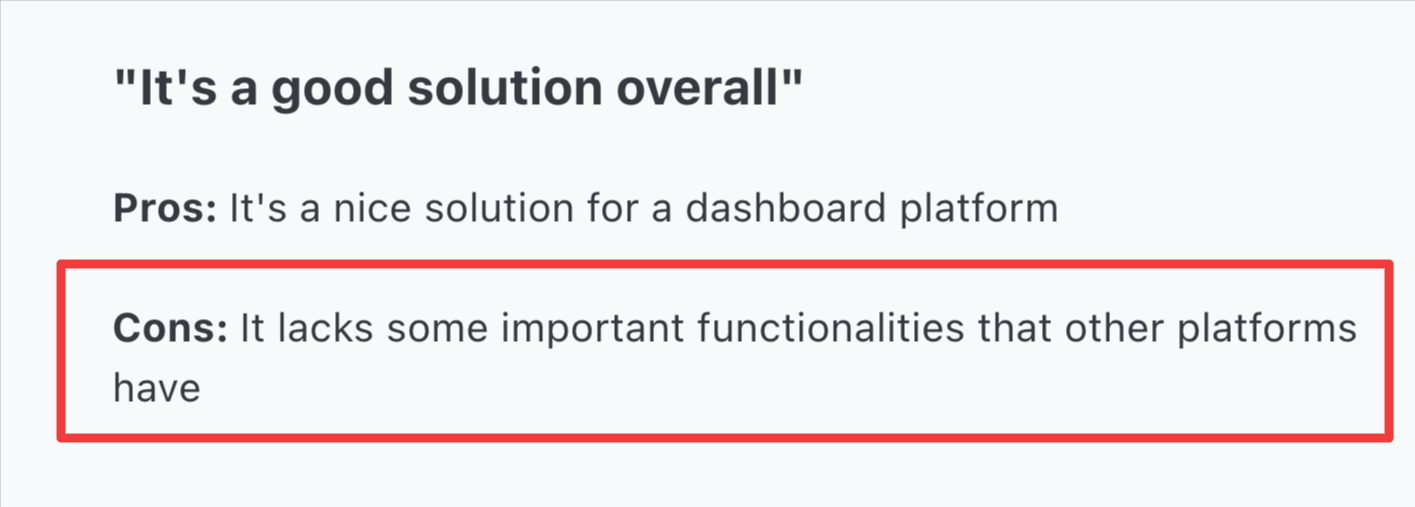
Capterra users like Pedro L. kept the feedback broad and just said, “Geckoboard lacks some important functionalities other platforms have.”
If you want to quickly summarize campaign performance with AI insights, create custom formulas, or transfer data to third-party platforms, Geckoboard isn’t suitable.
 ❌ No data blending
As one Capterra user put it, “the customization for creating complicated charts and special calculations is limited."
Geckoboard is made for simple data visualization, which can work for quick insights—but falls short for more advanced cross-channel data blending.
The only way to compare metrics is to place them side-by-side on your dashboard.
For example, if you want to report the average conversion rate across social media channels, you’d need to create separate metrics, like “Facebook Ads conversion rate,” “Instagram conversion rate,” and “Google Ads conversion rate.”
Feature Deep Dive #1: Geckoboard Ease of Use
When it comes to ease of use, Geckoboard’s reviews are a bit mixed. Some say creating dashboards is simple, others report UI issues and feature limitations.
So, we tested Geckoboard ourselves, to see what’s working, and what’s not.
- G2 Ease of Use: 4.3/5
- Capterra Ease of Use: 4.6/5
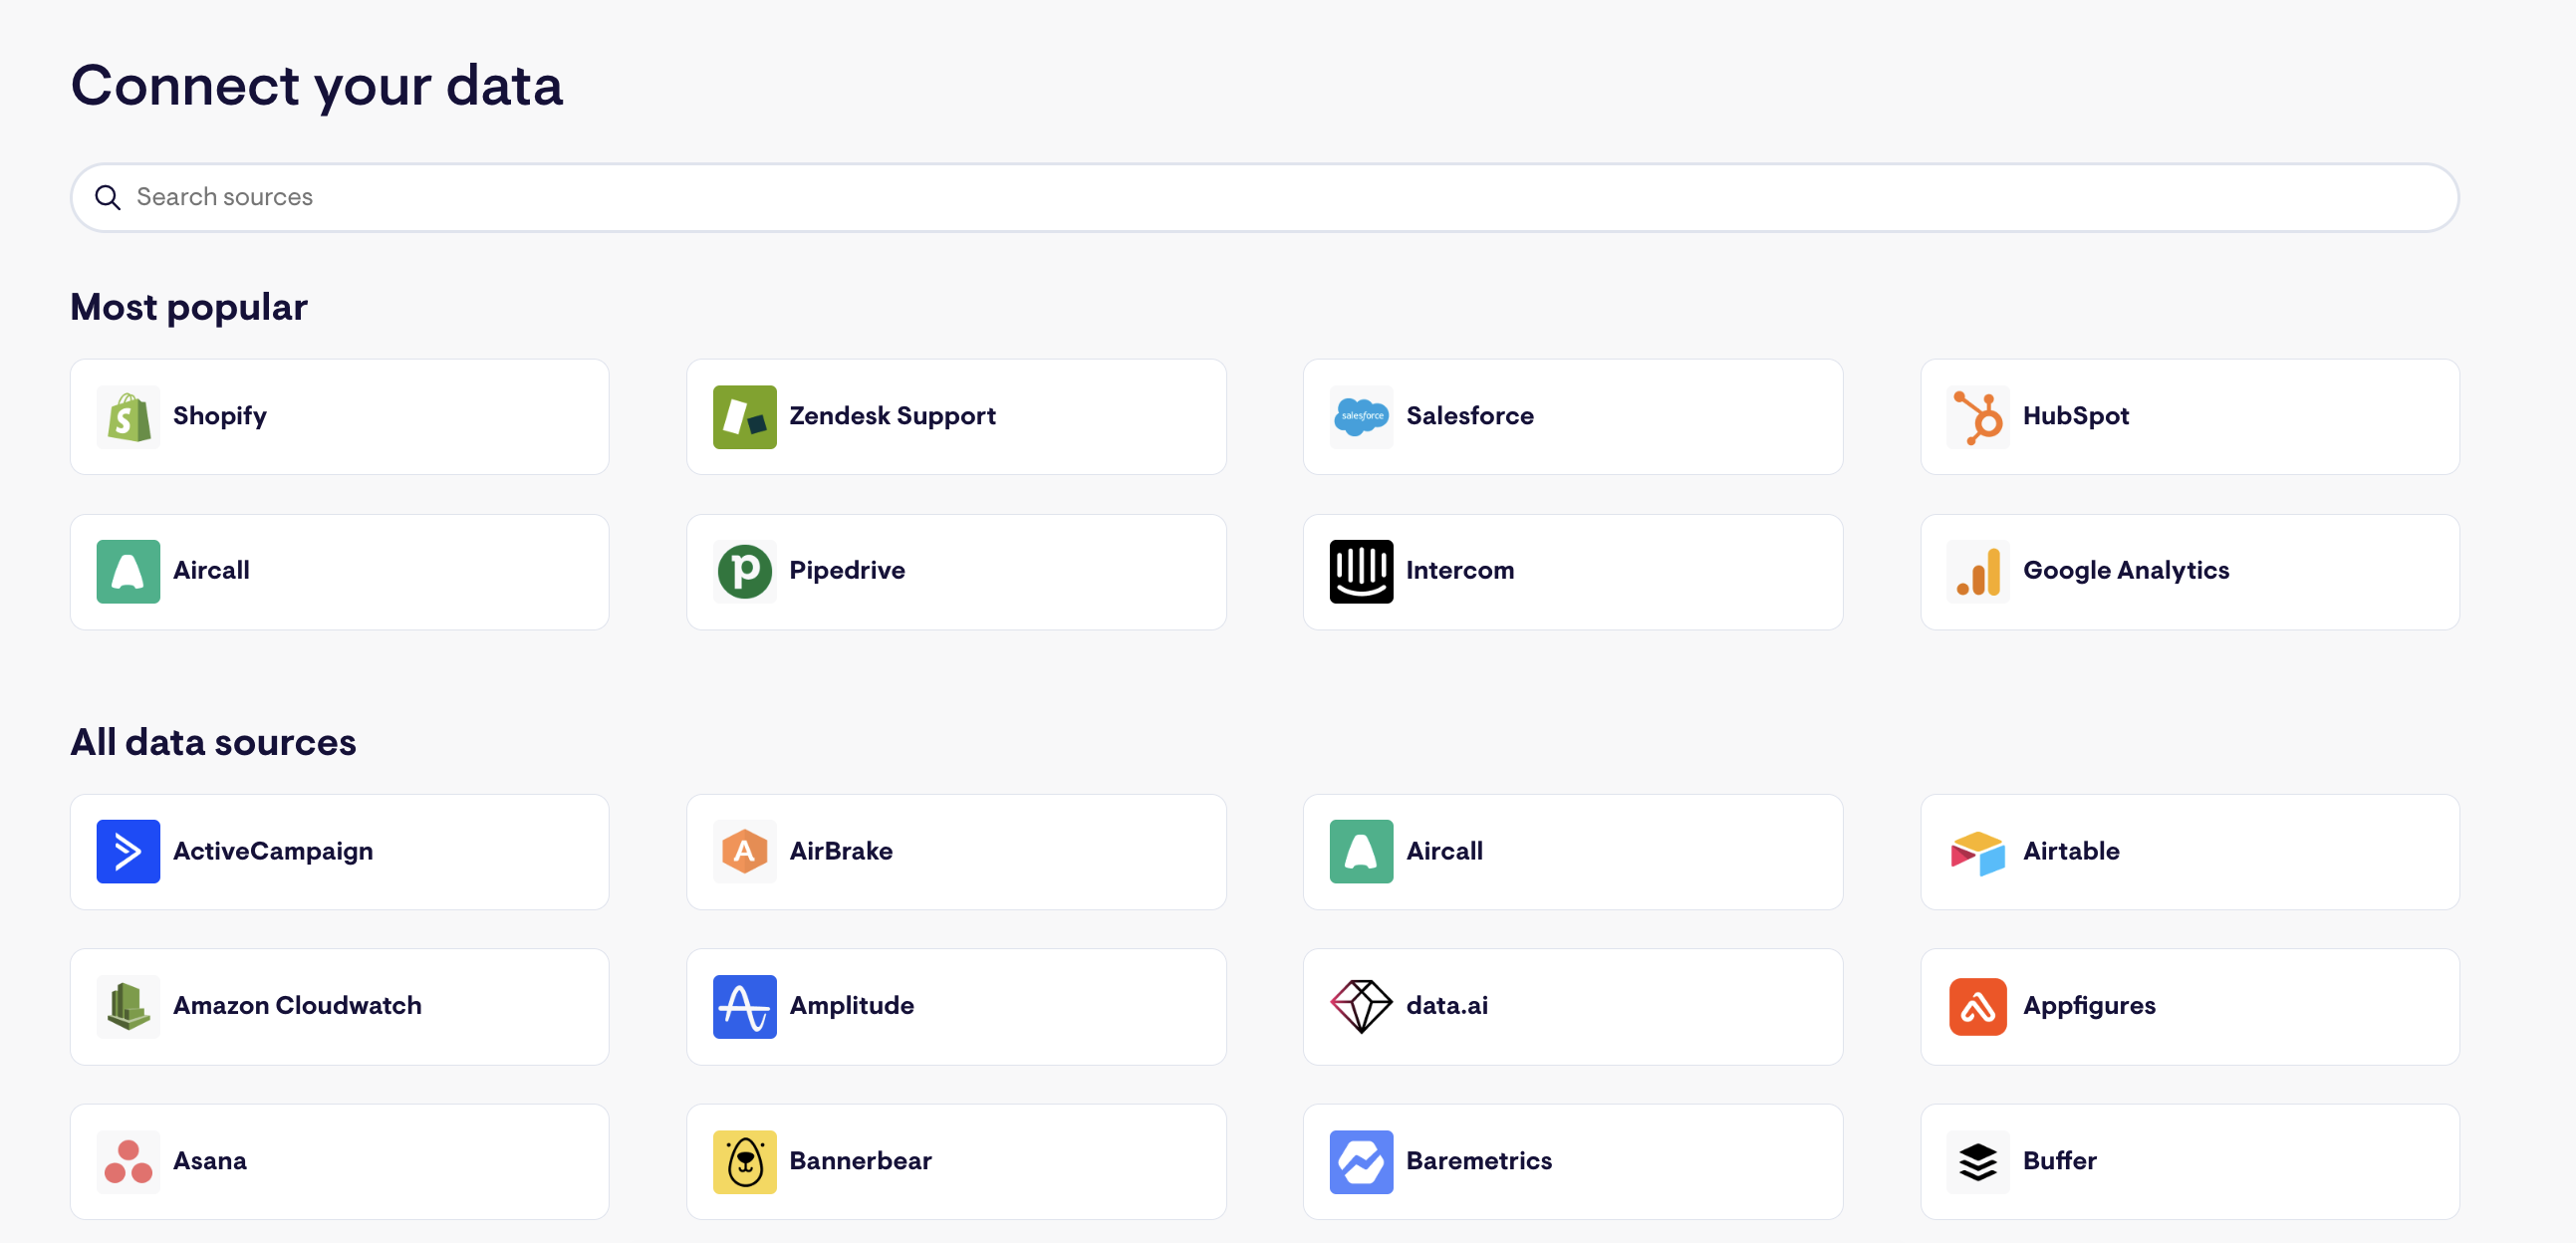
How easy is it to connect your data to Geckoboard?
This is the first thing we wanted to try—connecting data into Geckoboard.
Upon creating your dashboard, you can click on the platforms you want to connect:
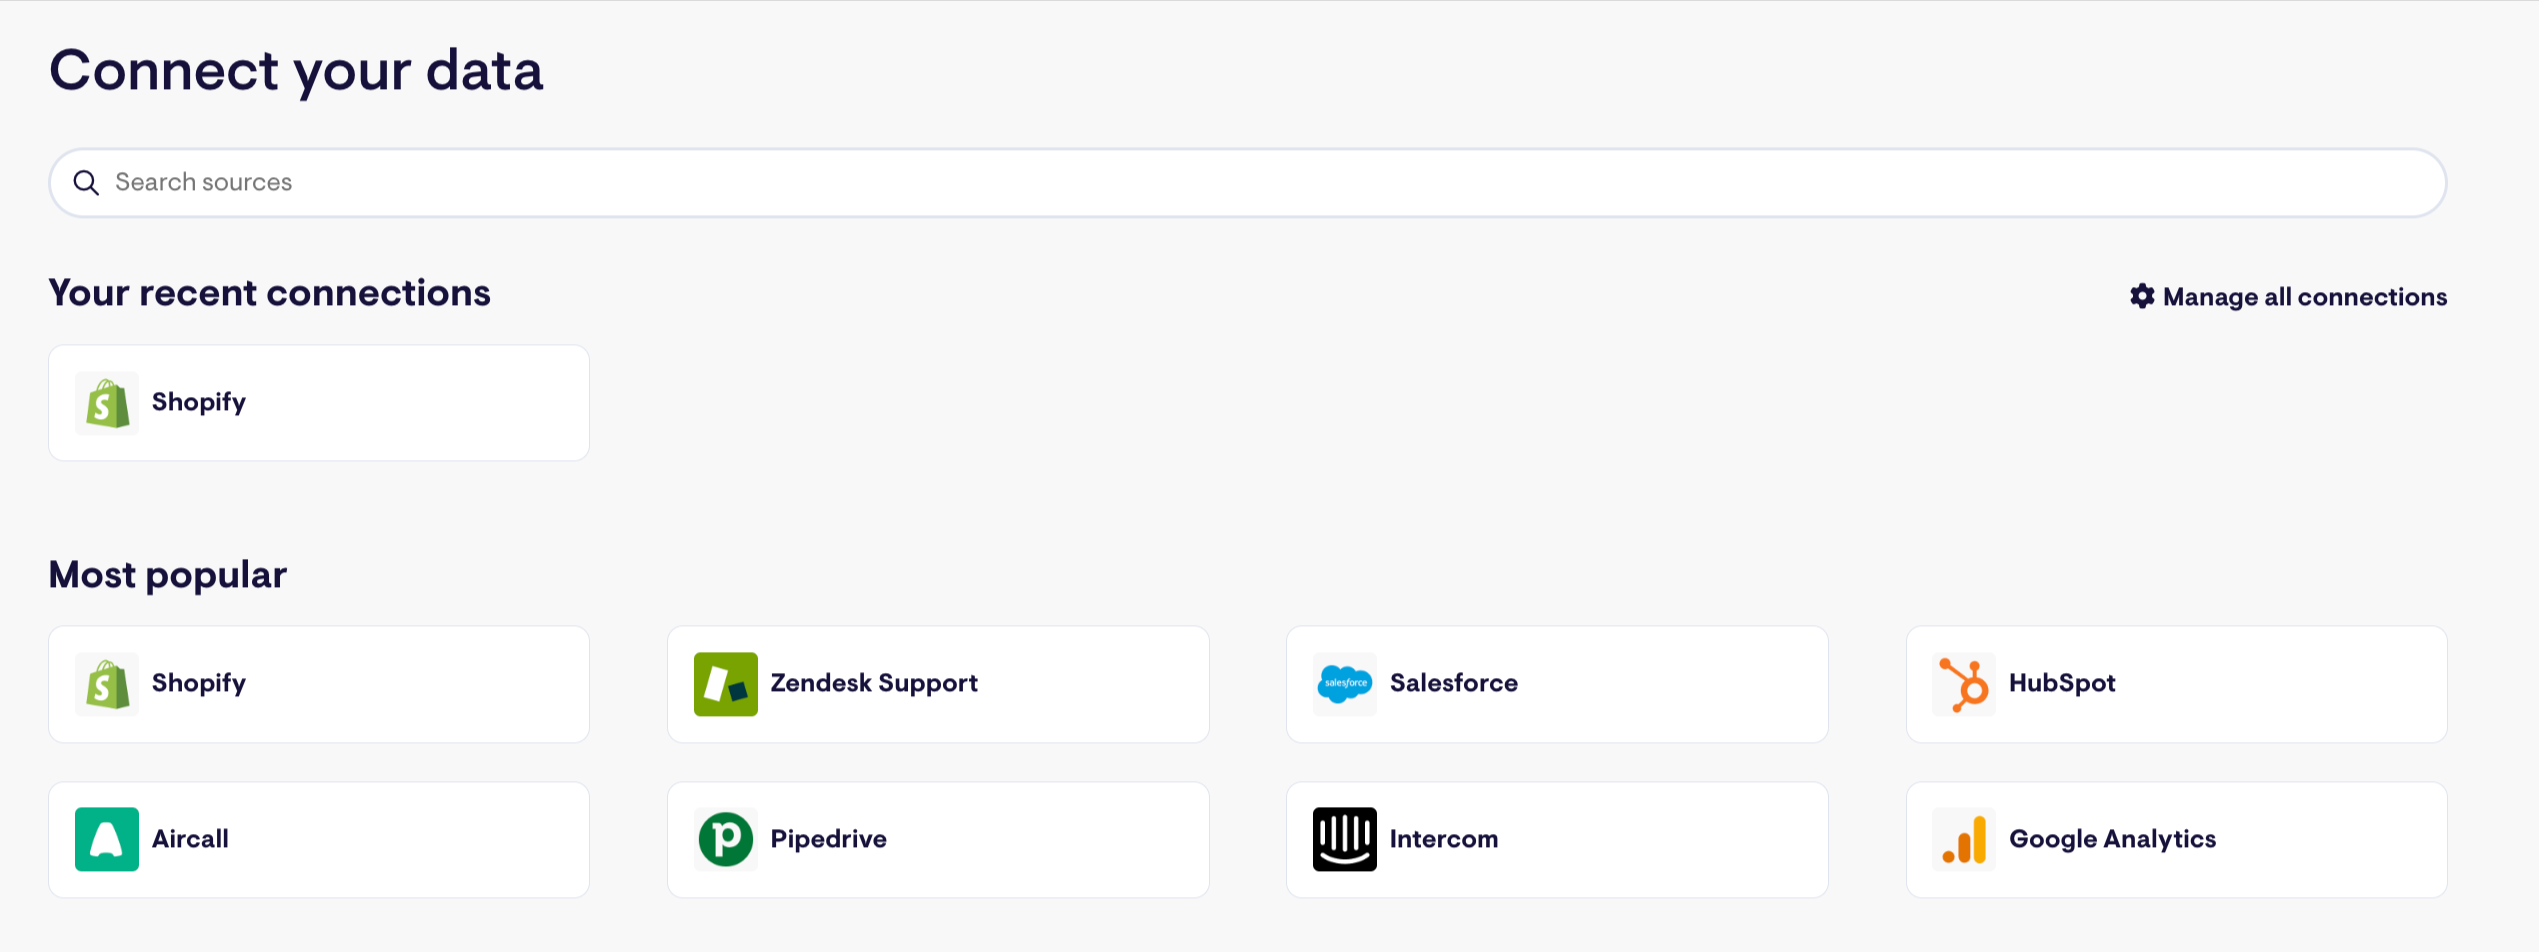 We wanted to try the integration process and created a test Shopify account.
After clicking on “Shopify”, we were directed to our Shopify store to install Geckoboard’s Shopify app and finalize the integration.
The process was simple, and is perhaps the main reason users say “it’s easy to get started with Geckoboard.”
Are there ready-to-use templates?
Geckoboard doesn’t offer ready-to-use templates. There are examples of dashboards on Geckoboard’s website, but there is no way to copy and apply them to your own account.
This is unfortunate, as alternatives like Whatagraph, offer 40+ report and dashboard templates, which make it quick and easy to get started.
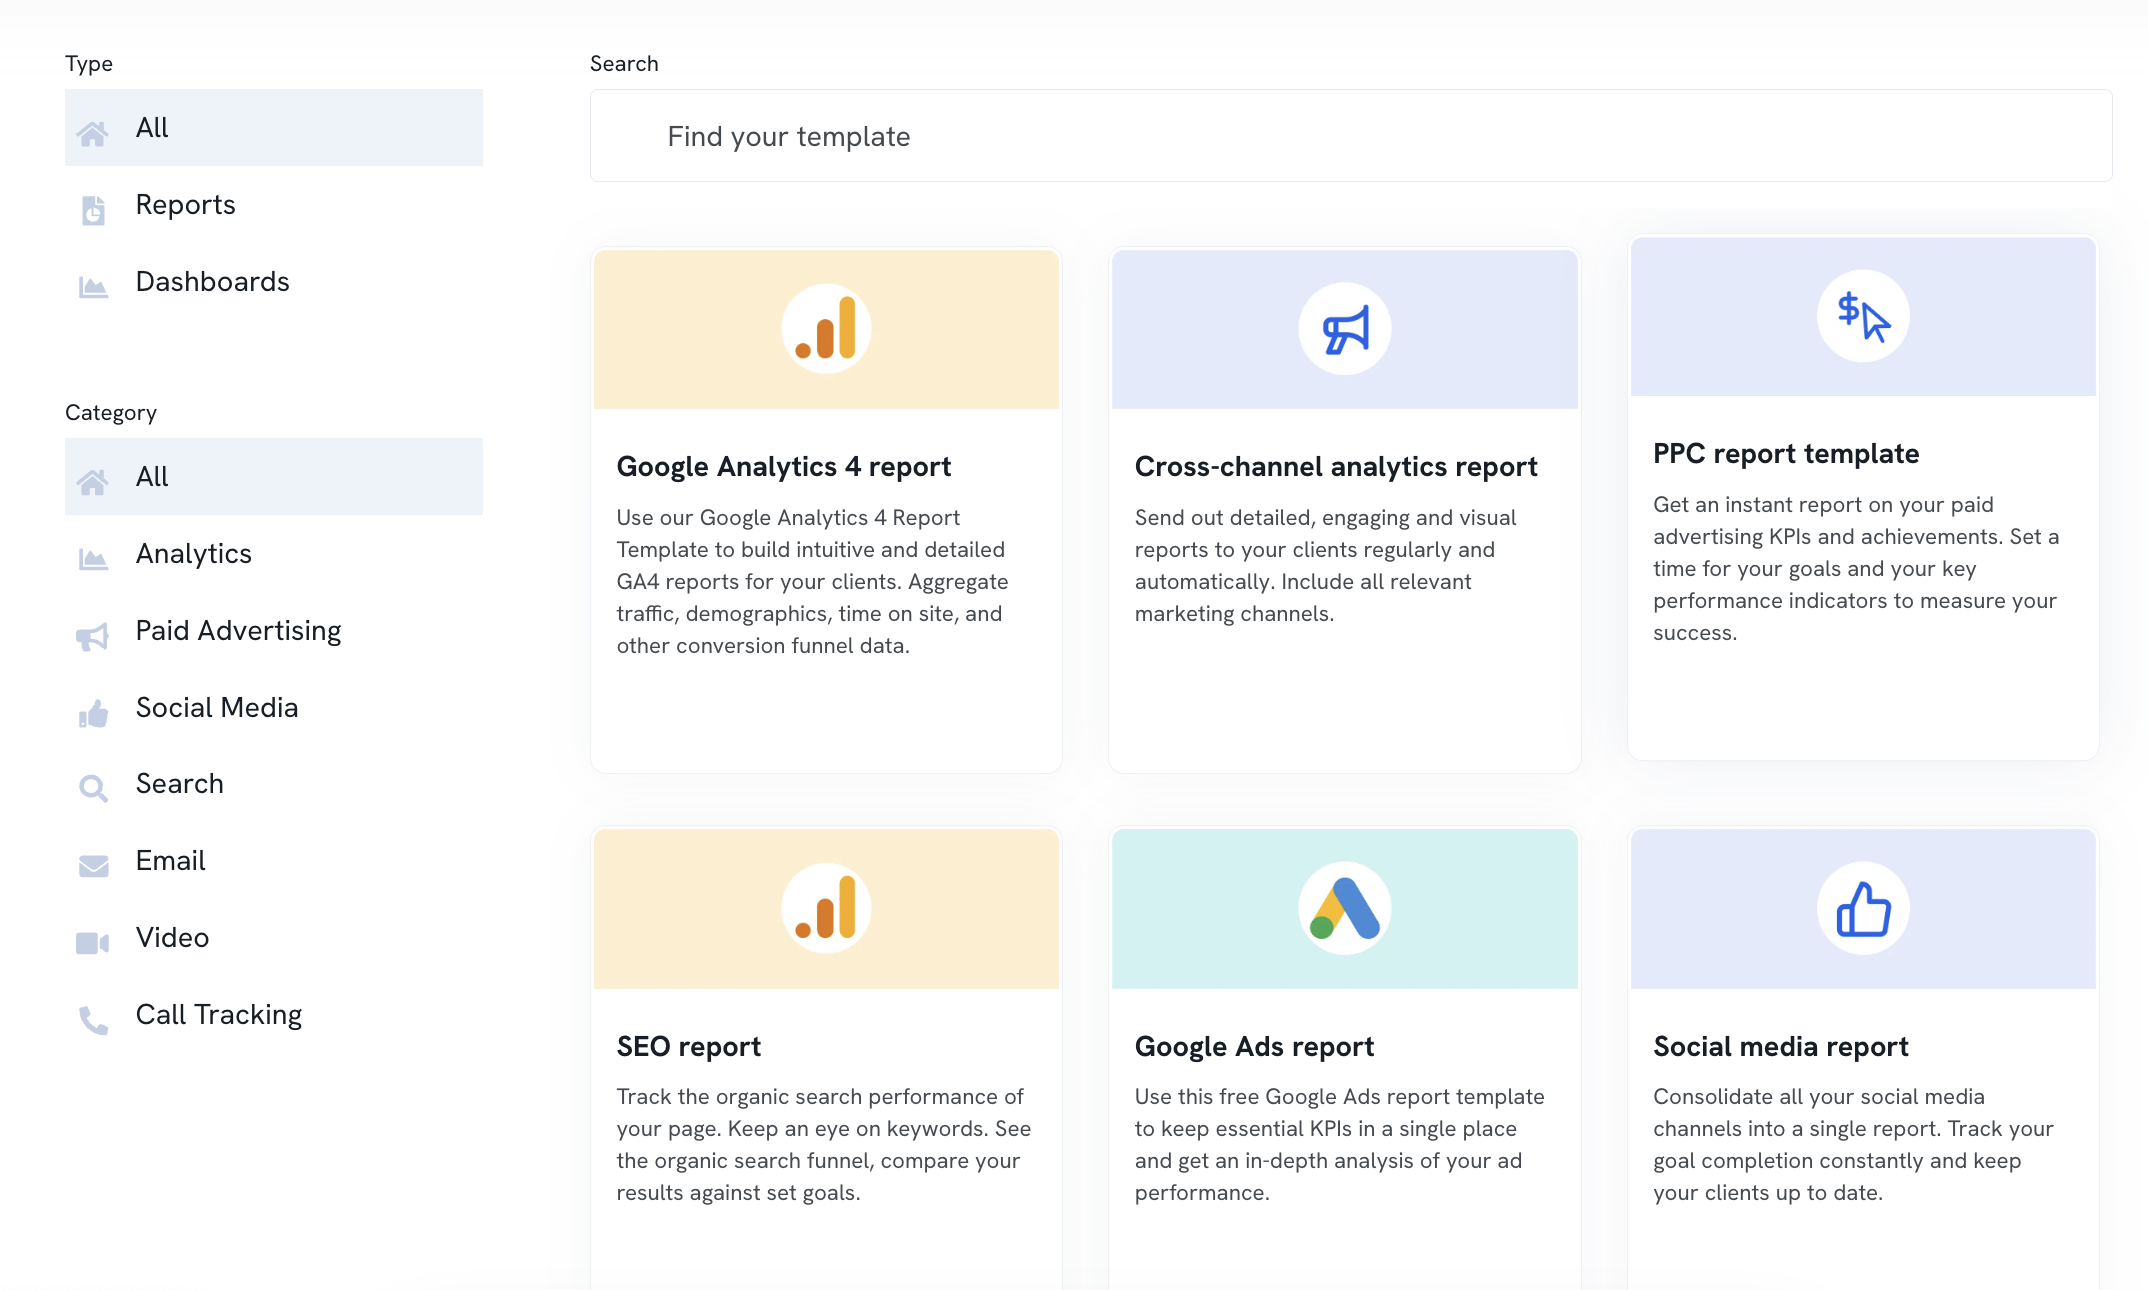
Whatagraph’s reports are divided into different categories, such as paid ad, analytics, social media, search, email, and call tracking, so choosing the right one is easy:
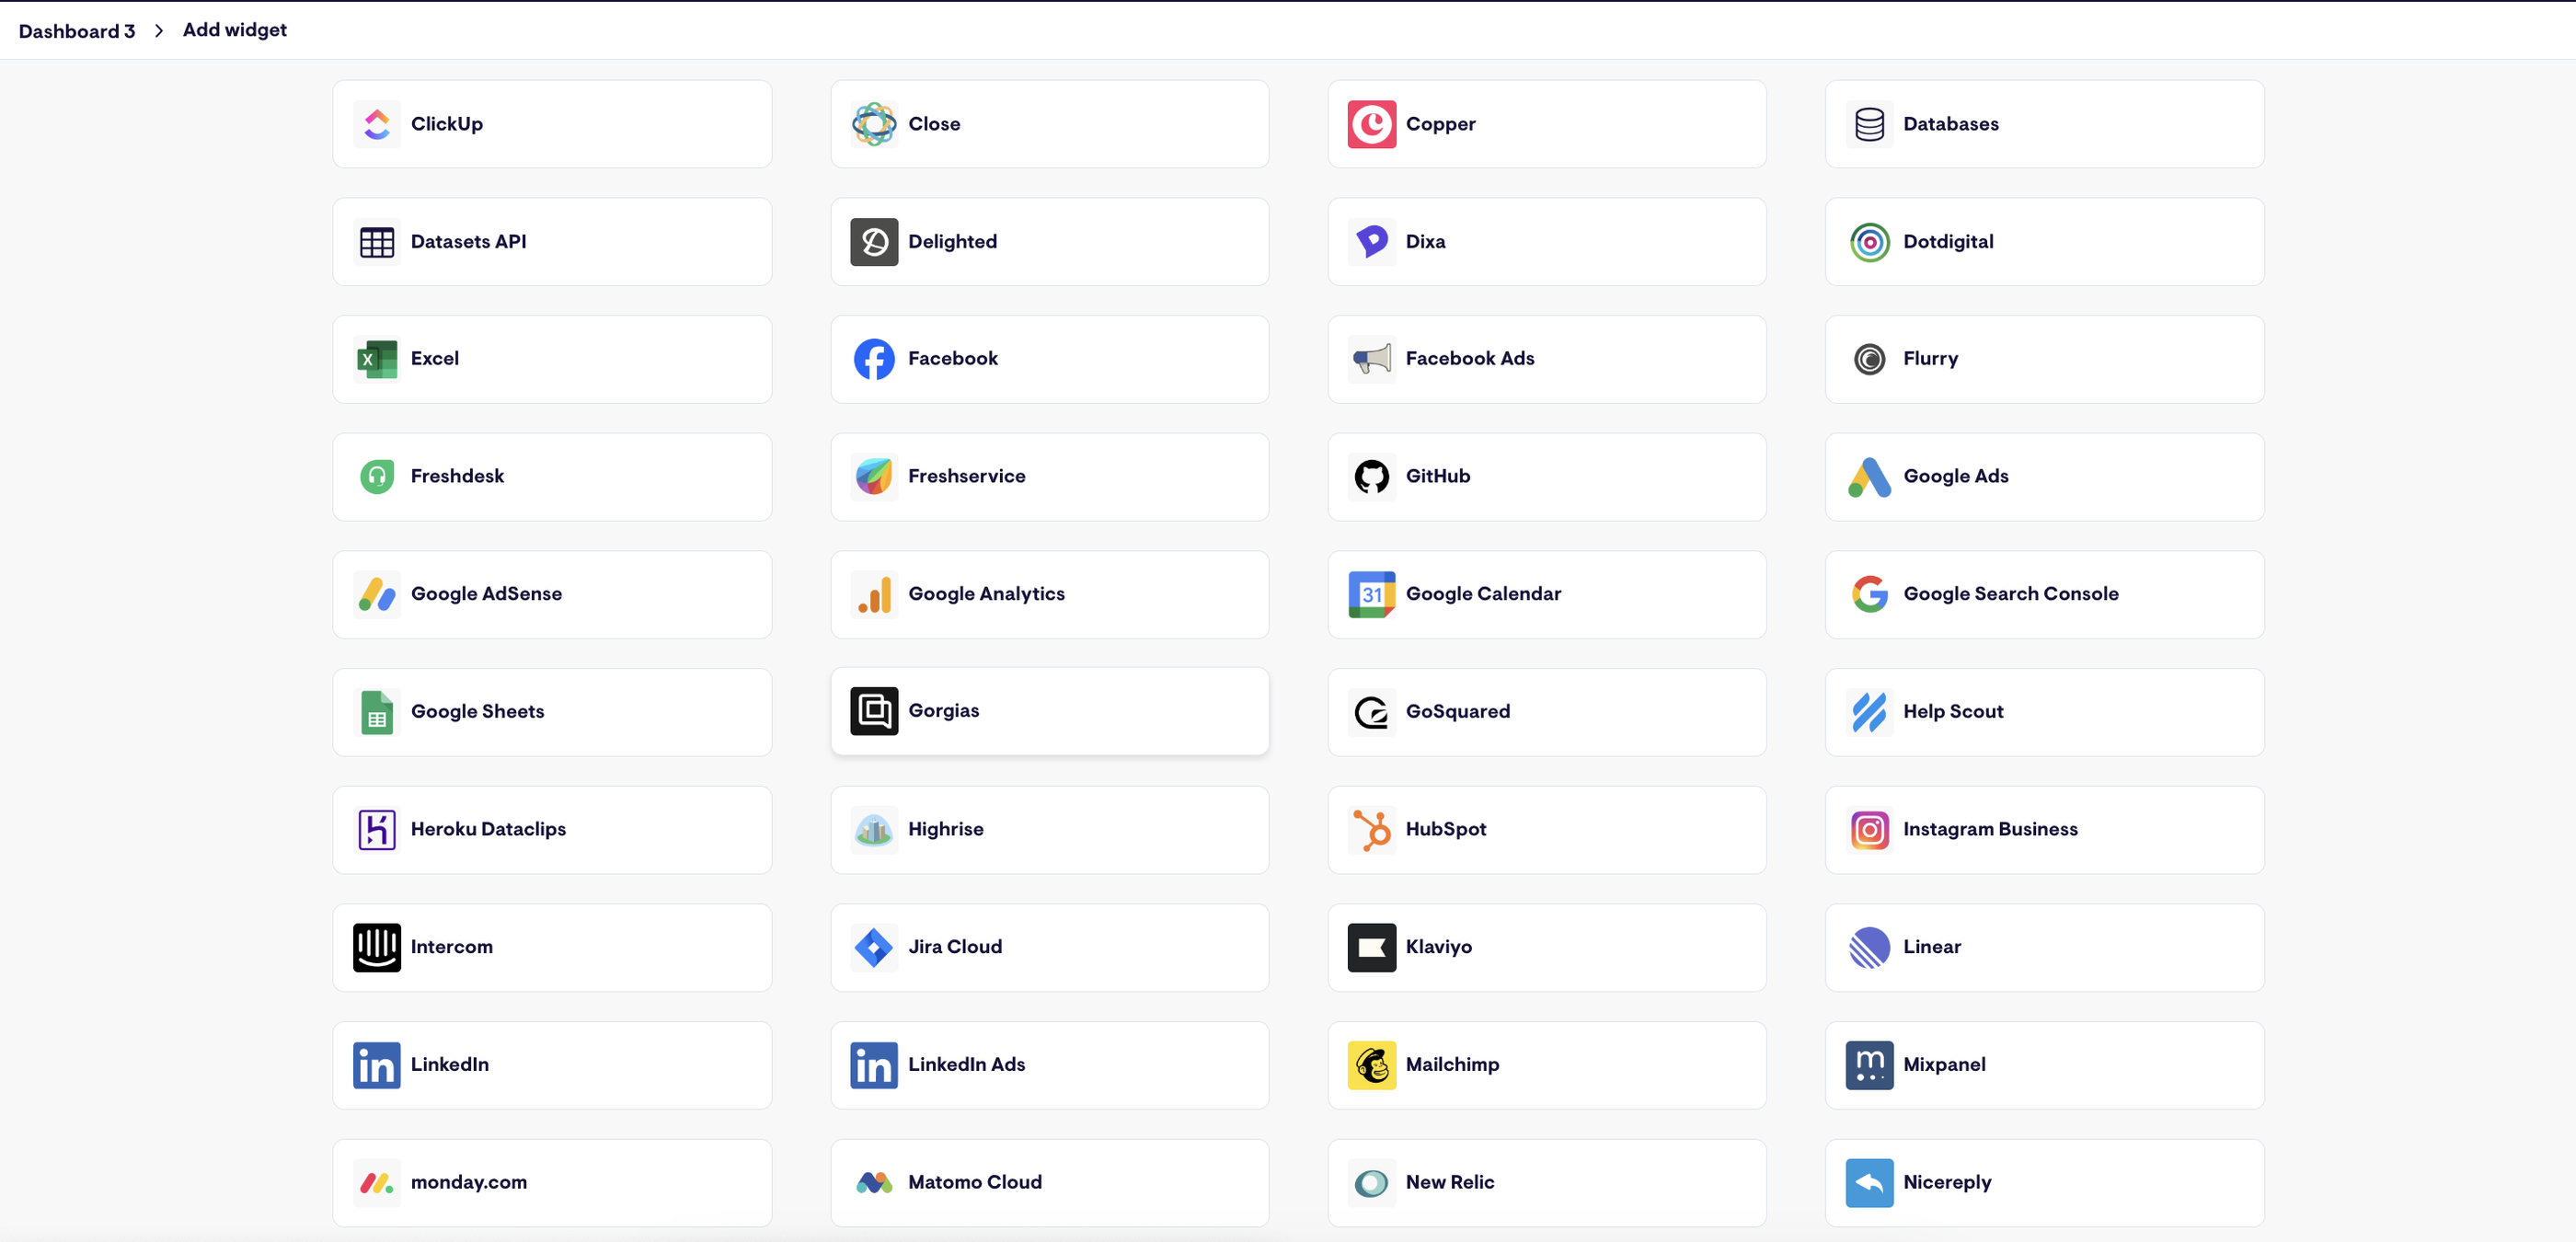
How easy is it to add widgets to dashboards?
The ease of adding widgets can make or break reporting tools' usability. Let’s see how it works with Geckoboard.
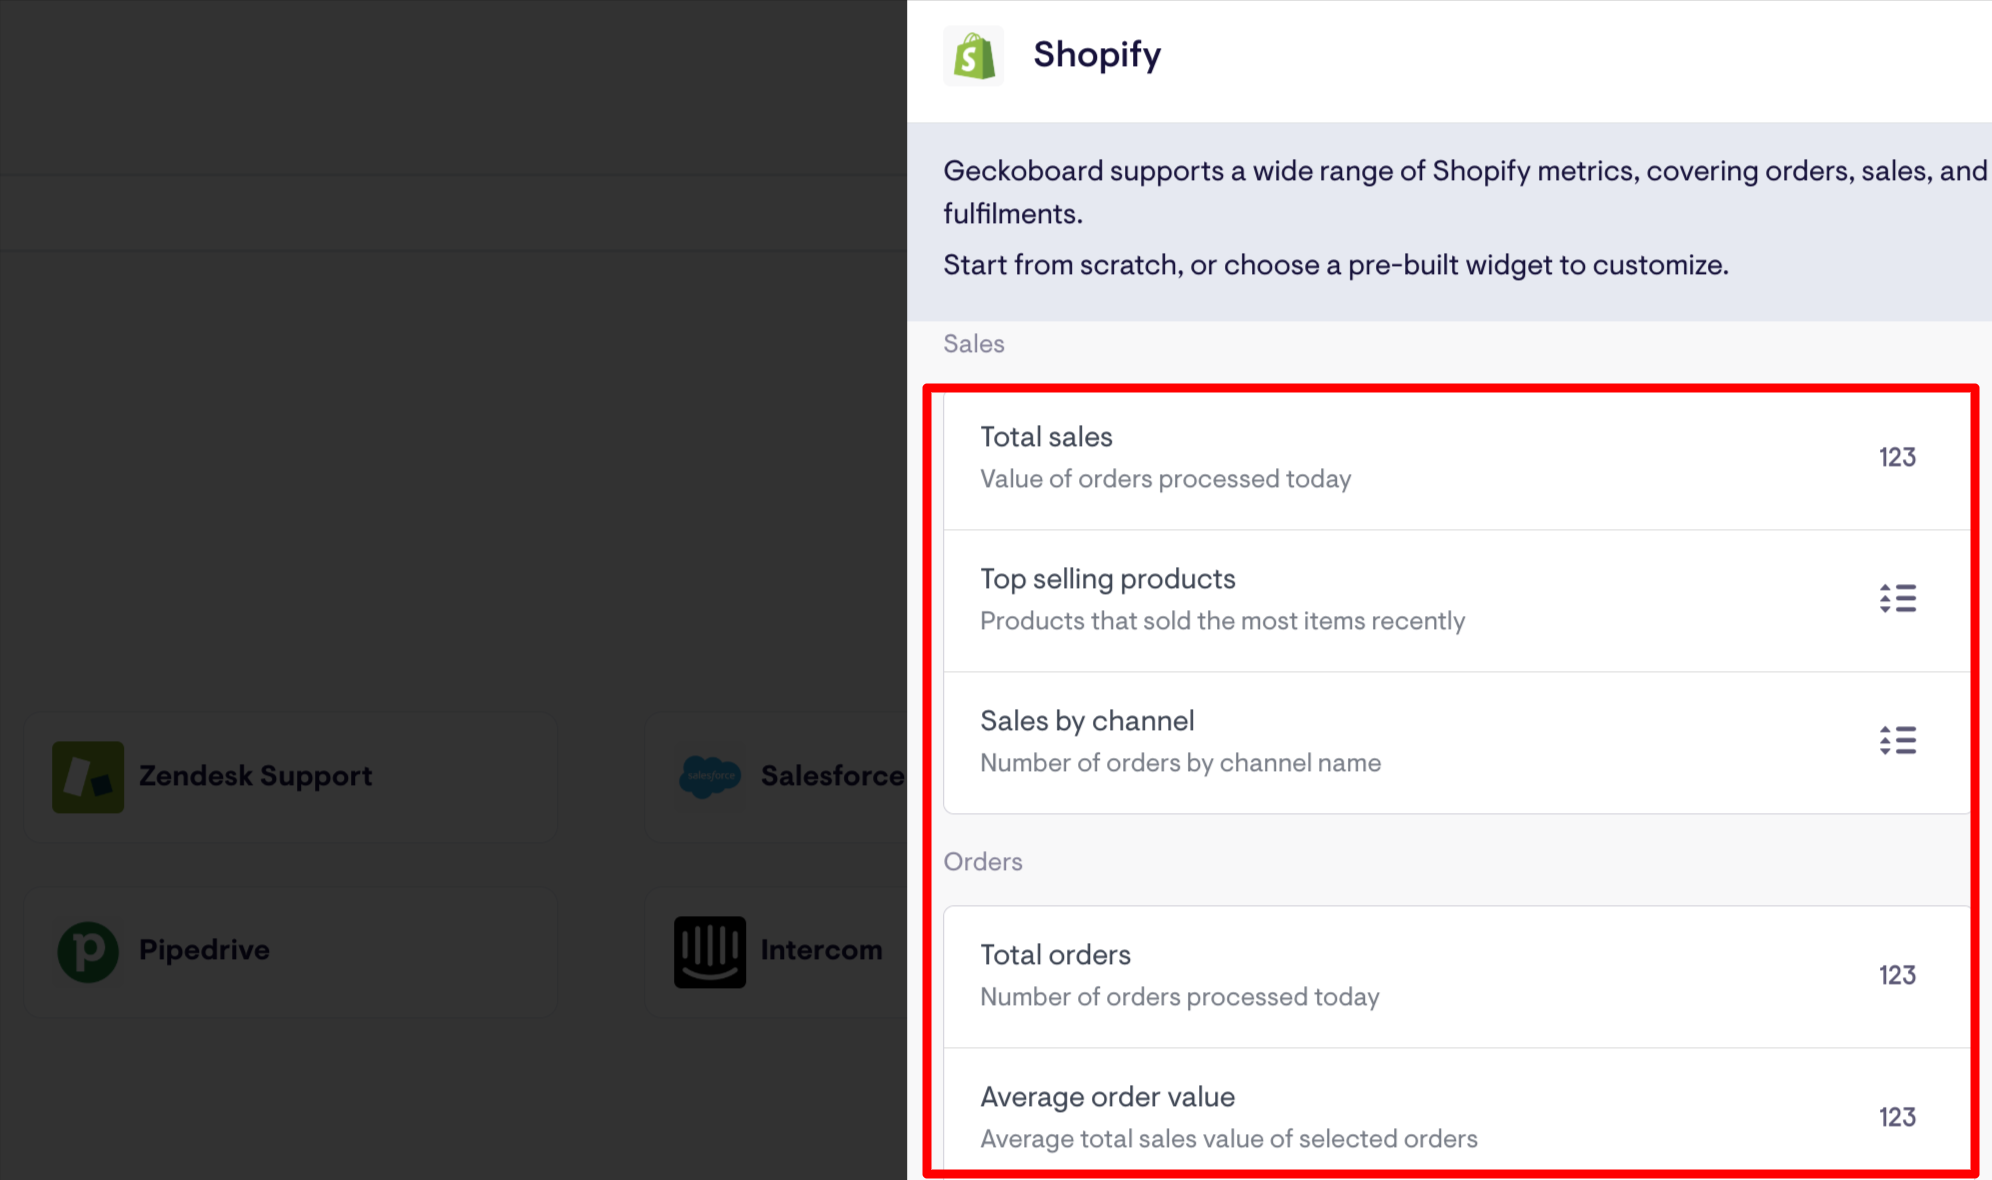
To add widgets, you need to click on the “Add widget” button on the dashboard. You’ll be directed to the integration page, where you can select your data source and the widget you want to add:
You can do basic widget modifications, such as changing the visual look, time period, minimum and maximum, and formatting.
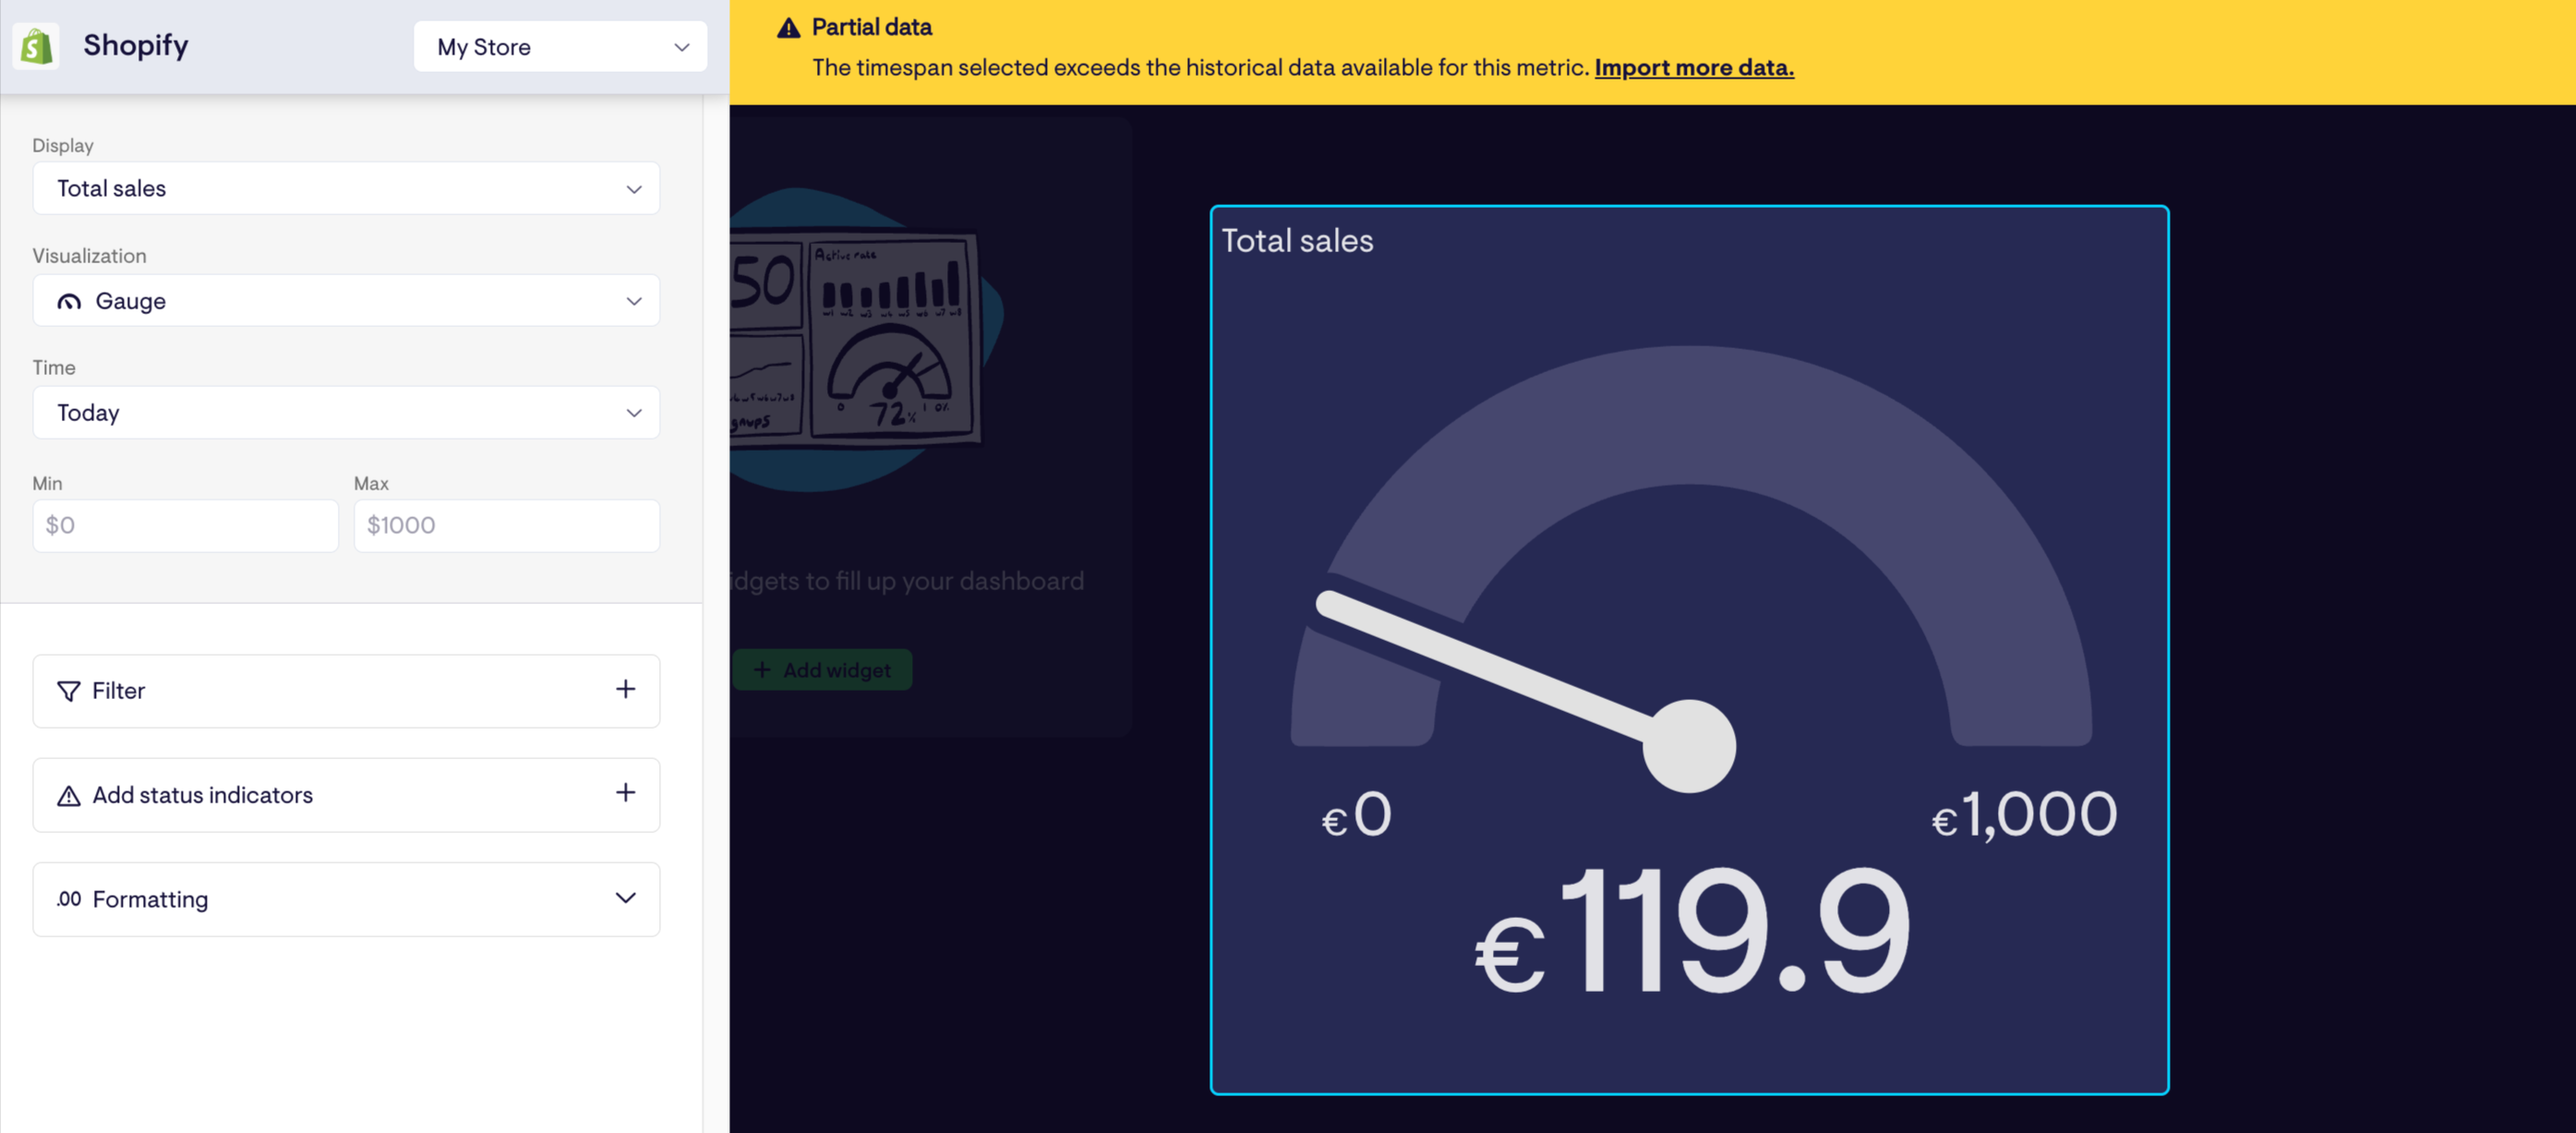
If you want to resize or move widgets, you can drag a corner to adjust the size or click and drag the entire widget to reposition it:
Our first impression was that working with the widgets is time consuming—there is no way to just drag-and-drop widgets into the dashboard.
Each time you want to add a widget, you need to go through the integrations page.
Truthfully, we believe this process could be so much easier.
For example, with Whatagraph, you can drag-and-drop widgets onto the canvas—all from a single page.
 Also, on Whatagraph, you can create folders for each client, Account Manager, or campaign, and organize all the relevant templates underneath each, perfect for agencies.
Another feature that makes a huge difference with Whatagraph is our Linked reports.
On Geckoboard, there is no way to make changes to multiple dashboards simultaneously. This is fine if you’re editing an individual dashboard, but becomes super messy if you’re editing 10+.
On Whatagraph, you have one Master template and any changes you make to it will automatically affect all linked reports. This means, if you want to apply changes to 10+ dashboards, you only need to modify the Master template.
Using our Linked templates isn’t obviously a must, but it’s a huge time-saving feature for agencies.
It’s easy and fast to connect to channels on Geckoboard, but the lack of templates and drag-and-drop widget slows down building dashboards.
Feature Deep Dive #2: Geckoboard Integrations
We want to give Geckoboard credit where it's due—one of which is its broad integrations with general business tools.
If you need to pull data from social media, CRM, email, project management, or analytics tools, it generally has you covered.
In total, there are 90+ integrations available:
Some of the popular integrations include Google Analytics, Salesforce, HubSpot, Zendesk, Shopify, and Pipedrive.
Outside of the more “general integrations”, we believe there should be integrations with more niche platforms like Reddit and Pinterest.
Plus, Geckoboard doesn’t integrate with SEO tools, and the ecommerce category is limited to Shopify.
This can be a dealbreaker—especially for agencies managing a diverse pool of clients using various platforms.
Also, when Geckoboard asks to connect your data, the integrations are just displayed in a long list with no real categories:
Because of this, it’s hard to get a clear picture of what’s available—or find the tools that matter for your case.
Conversely, Whatagraph offers 55+ integrations with both popular and niche marketing platforms, including with different social media, paid advertising, email marketing, analytics, SEO, and ecommerce platforms.
The integrations are displayed in different categories, so finding the right ones for you is easy: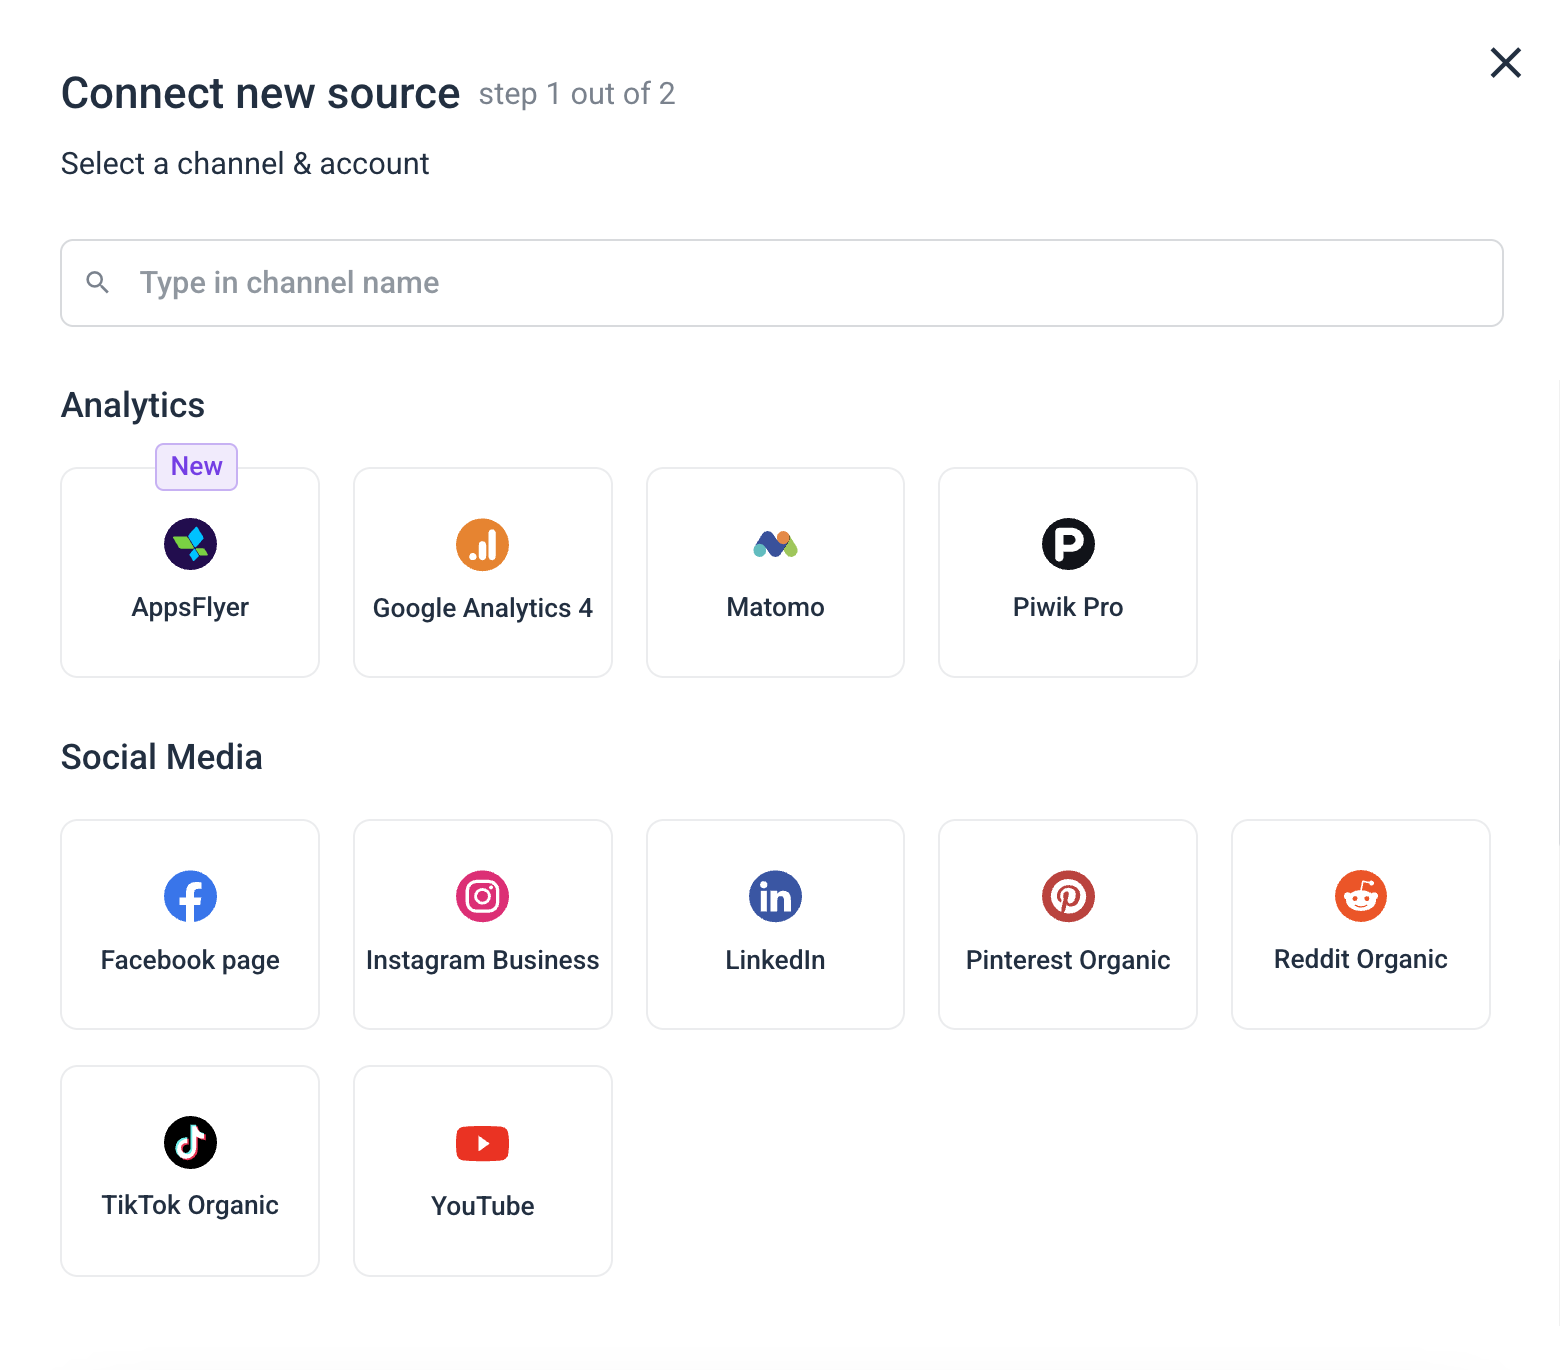
Are custom API and offline data imports available?
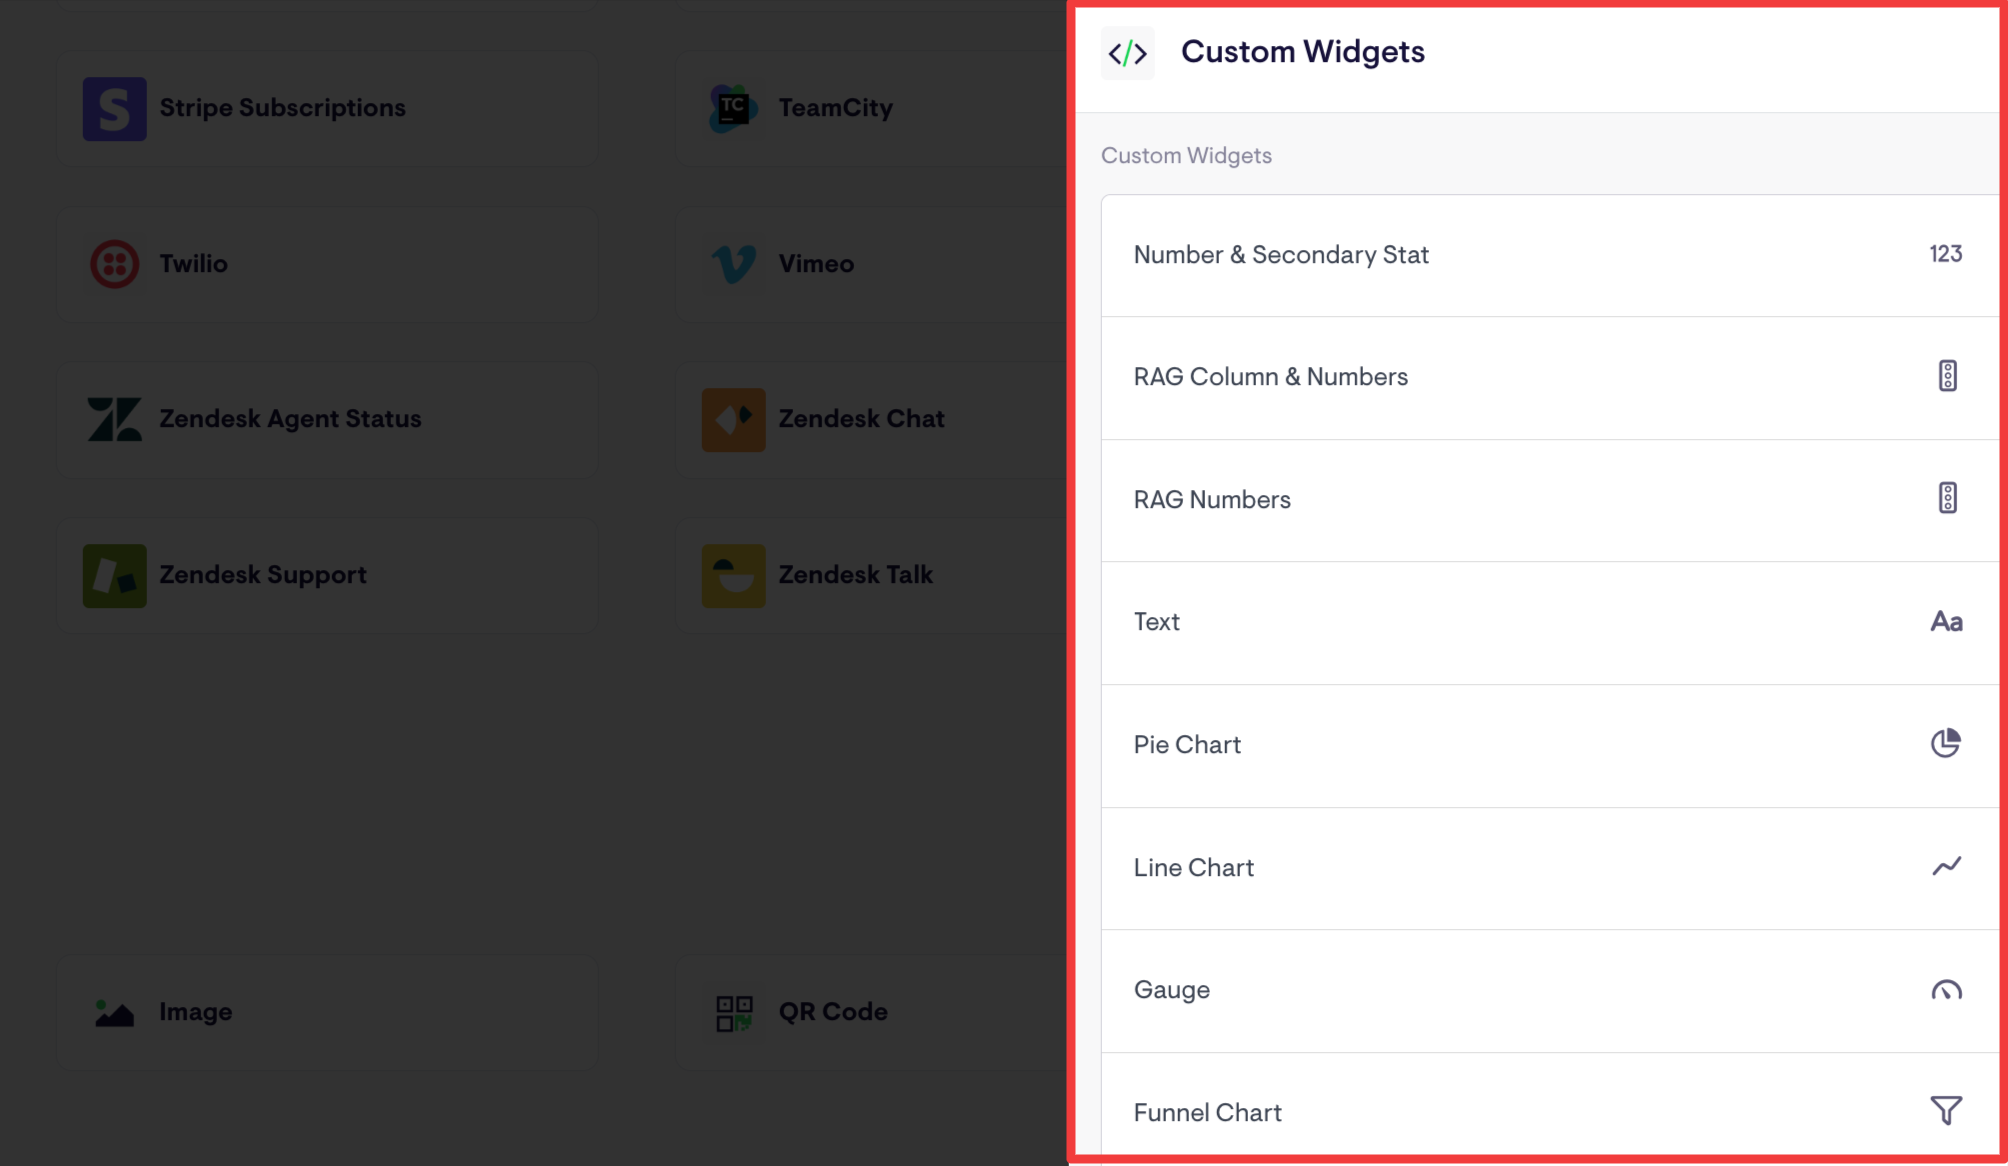
Geckoboard has a custom API, which lets you pull data through Zapier or by connecting a data source through a script.
There are 10+ widgets available for displaying the custom API data:
While a custom API is available, Geckoboard doesn’t support offline data importing—meaning you can’t enter data from your offline sources into the dashboard.
This is unfortunate, as with Whatagraph, you can enter offline data into your reports.
In Whatagraph’s editor, you can find an “Offline Data” menu with pre-designed widgets:
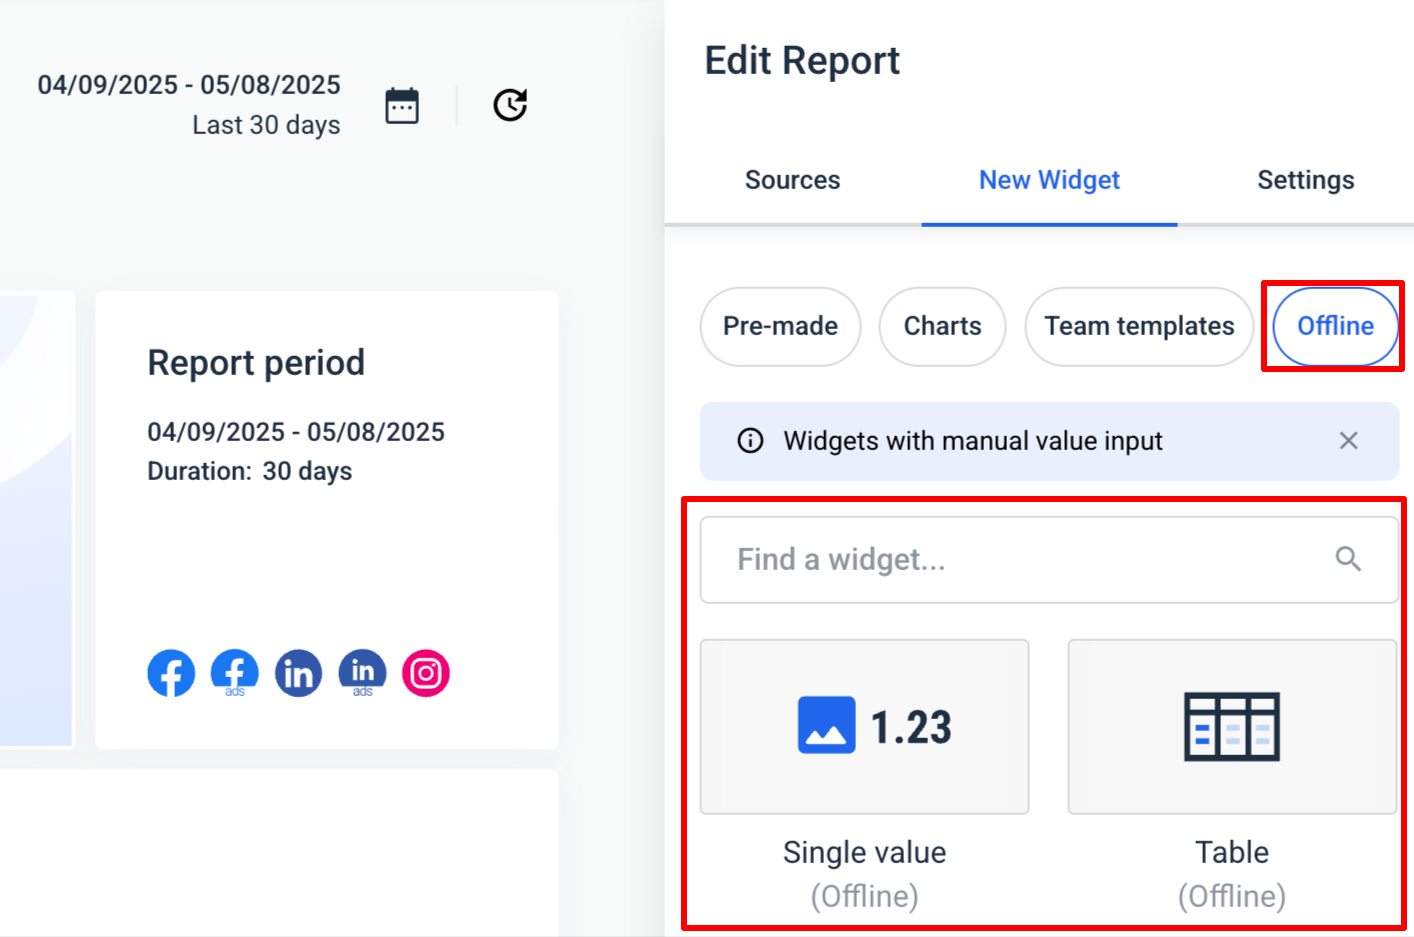
After dragging the widget into your report, you can click on it to go to its editing mode and enter your data manually.
Geckoboard's 90+ integrations cover general business tools, but agencies may find the lack of SEO, ecommerce, and niche integrations limiting.
Feature Deep Dive #3: Data Blending, Custom Metrics & Dimensions on Geckoboard
This is where Geckoboard really starts to show its limitations—especially for growing marketing teams and agencies.
Let’s break it down.
Can you blend data from different sources in Geckoboard?
Geckoboard doesn’t support data blending, according to this documentation.
If you want to combine metrics like Google Ads spend + Meta Ads spend to get a unified view of your PPC budget, you’re out of luck. The only way you can do this is to visualize these metrics side by side and do the math yourself.
Can you create custom metrics or formulas?
No, Geckoboard doesn’t let you create calculated fields or apply custom formulas. You’re stuck with whatever default metrics are available through its native widgets.
Want to clean up inflated conversion numbers from Meta and Google? Want to define your own ROAS formula? You’ll need to do that outside Geckoboard—in spreadsheets or a separate BI tool.
You can group widgets together visually on a dashboard to highlight relationships between them. But let’s be honest: that’s more of a visual fix than a functional solution. It doesn’t help with data consistency, accuracy, or cross-channel insights.
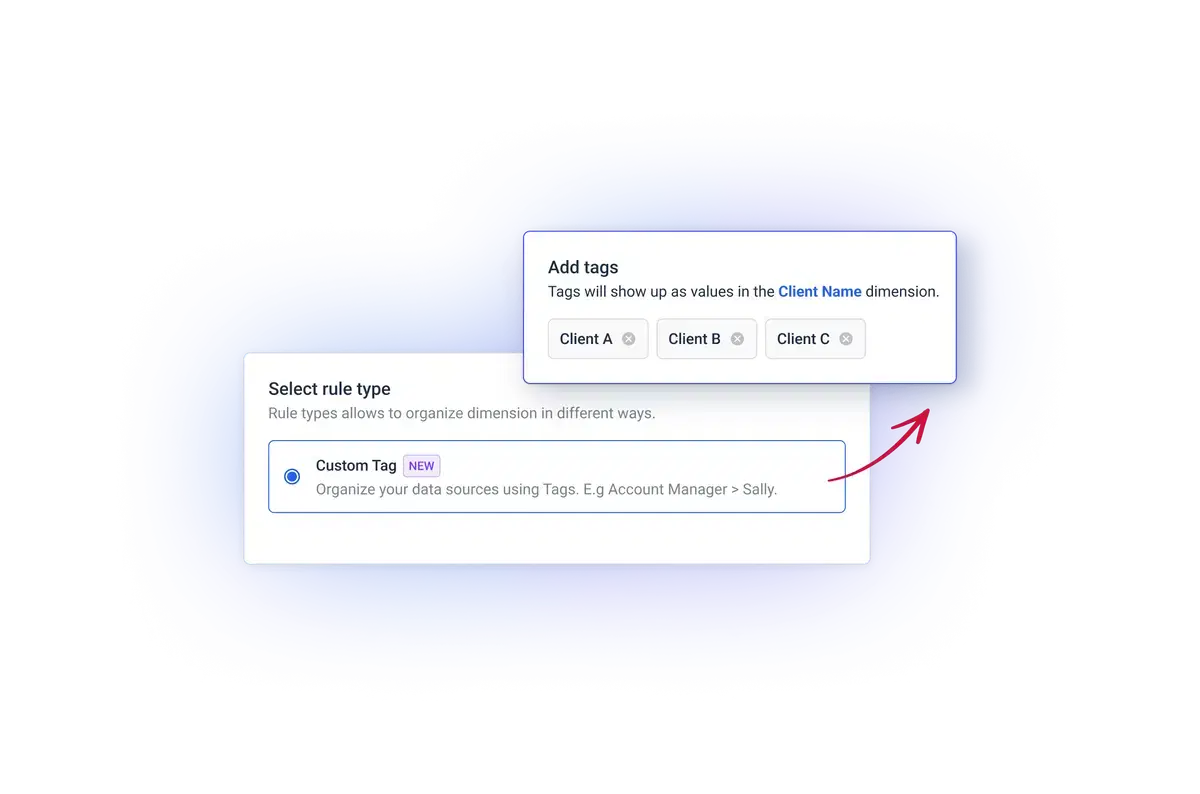
In Whatagraph, however, we have an entire dedicated space for data organization, aptly called “Organize” where you can:
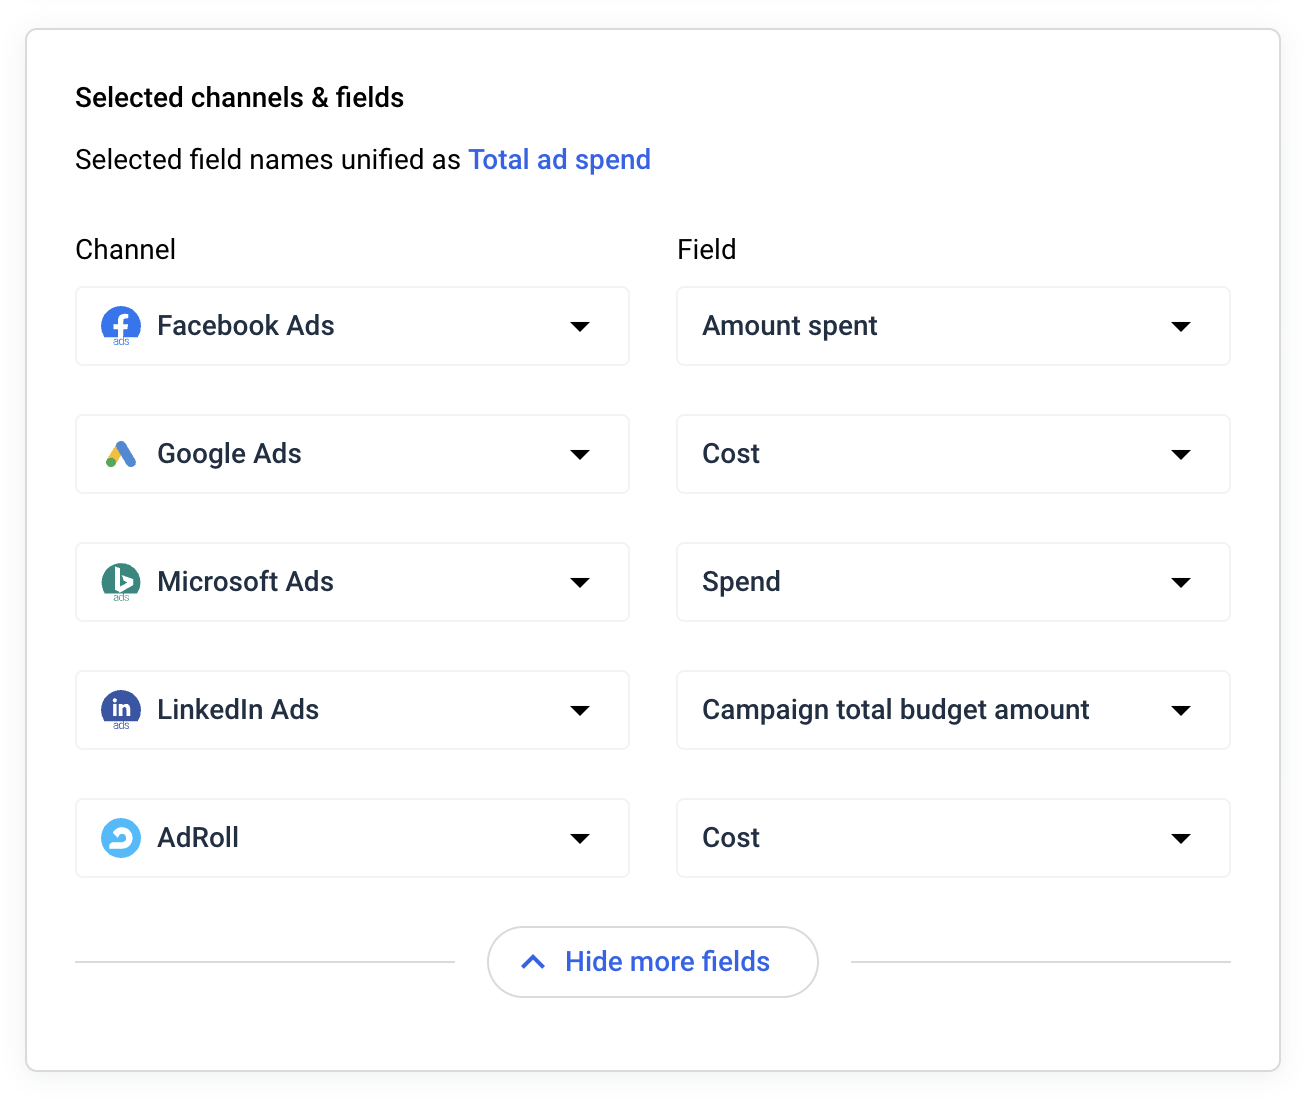
✅ Blend data across platforms. Want to show “Total Ad Spend” across all PPC channels? Easy. Just select your sources (Google Ads, Meta Ads, TikTok, etc.), choose your metrics, and blend them into a single custom metric.
✅ Create custom formulas. Whether you’re adjusting inflated conversions or creating a custom CPA calculation, Whatagraph lets you write your own formulas with the exact logic you need. Bonus: You can save these as templates for future use.
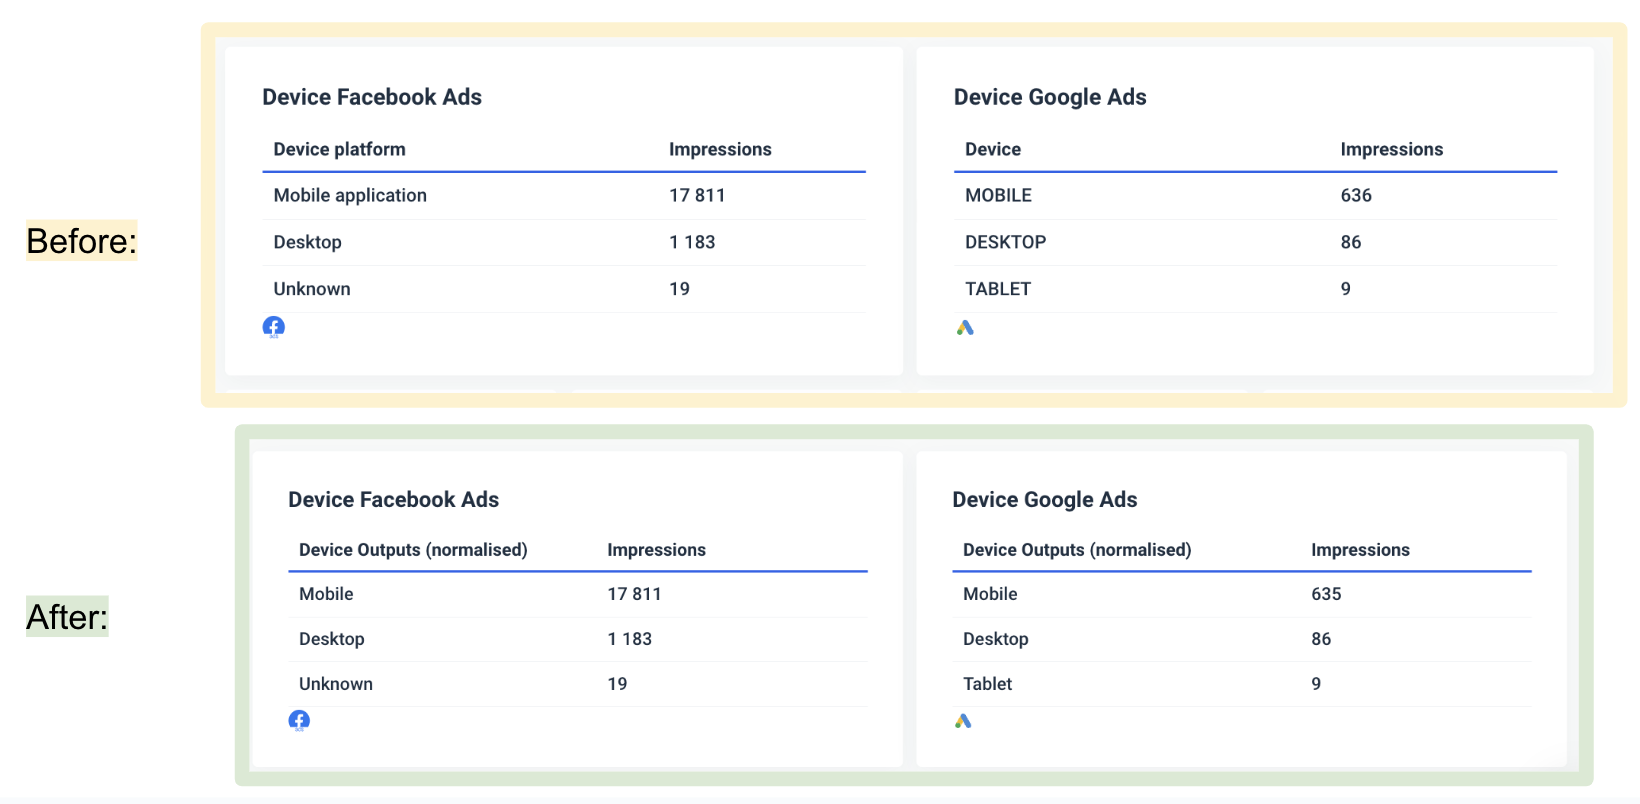
✅ Unify naming conventions. Have five campaign names that are just variations of “Retargeting”? Standardize them under one clean, unified label. Makes your tables easier to read and your reports easier to interpret.
✅ Use your custom data anywhere. Blended metrics and custom formulas aren’t locked in one place. You can drag them into reports, dashboards, or performance monitoring views without needing to recreate them each time.
✅ Tag and group by any dimension. Want to filter results by Account Manager, location, or business type? Just tag your data and create views based on what matters to you.
 If your agency needs accurate, reliable, and customizable reporting, especially across multiple channels, Whatagraph is the better choice.
You can’t blend data or create custom metrics and dimensions on Geckoboard. Whereas, Whatagraph gives you full control to blend, calculate, and customize your data exactly how you need.
Feature Deep Dive #4: Geckoboard Reports and Dashboards
This is an important one: Geckoboard features for customizing the dashboards and reports. Let’s see what is available.
How customizable are the dashboards?
Geckoboard is an entry-level data visualization tool and offers basic customization, including:
- Data source widgets: Geckoboard has a set of metrics for each data source, which you can use to display data.
- Data visualization graphs: To display your data, there are seven different visualization graphs available.
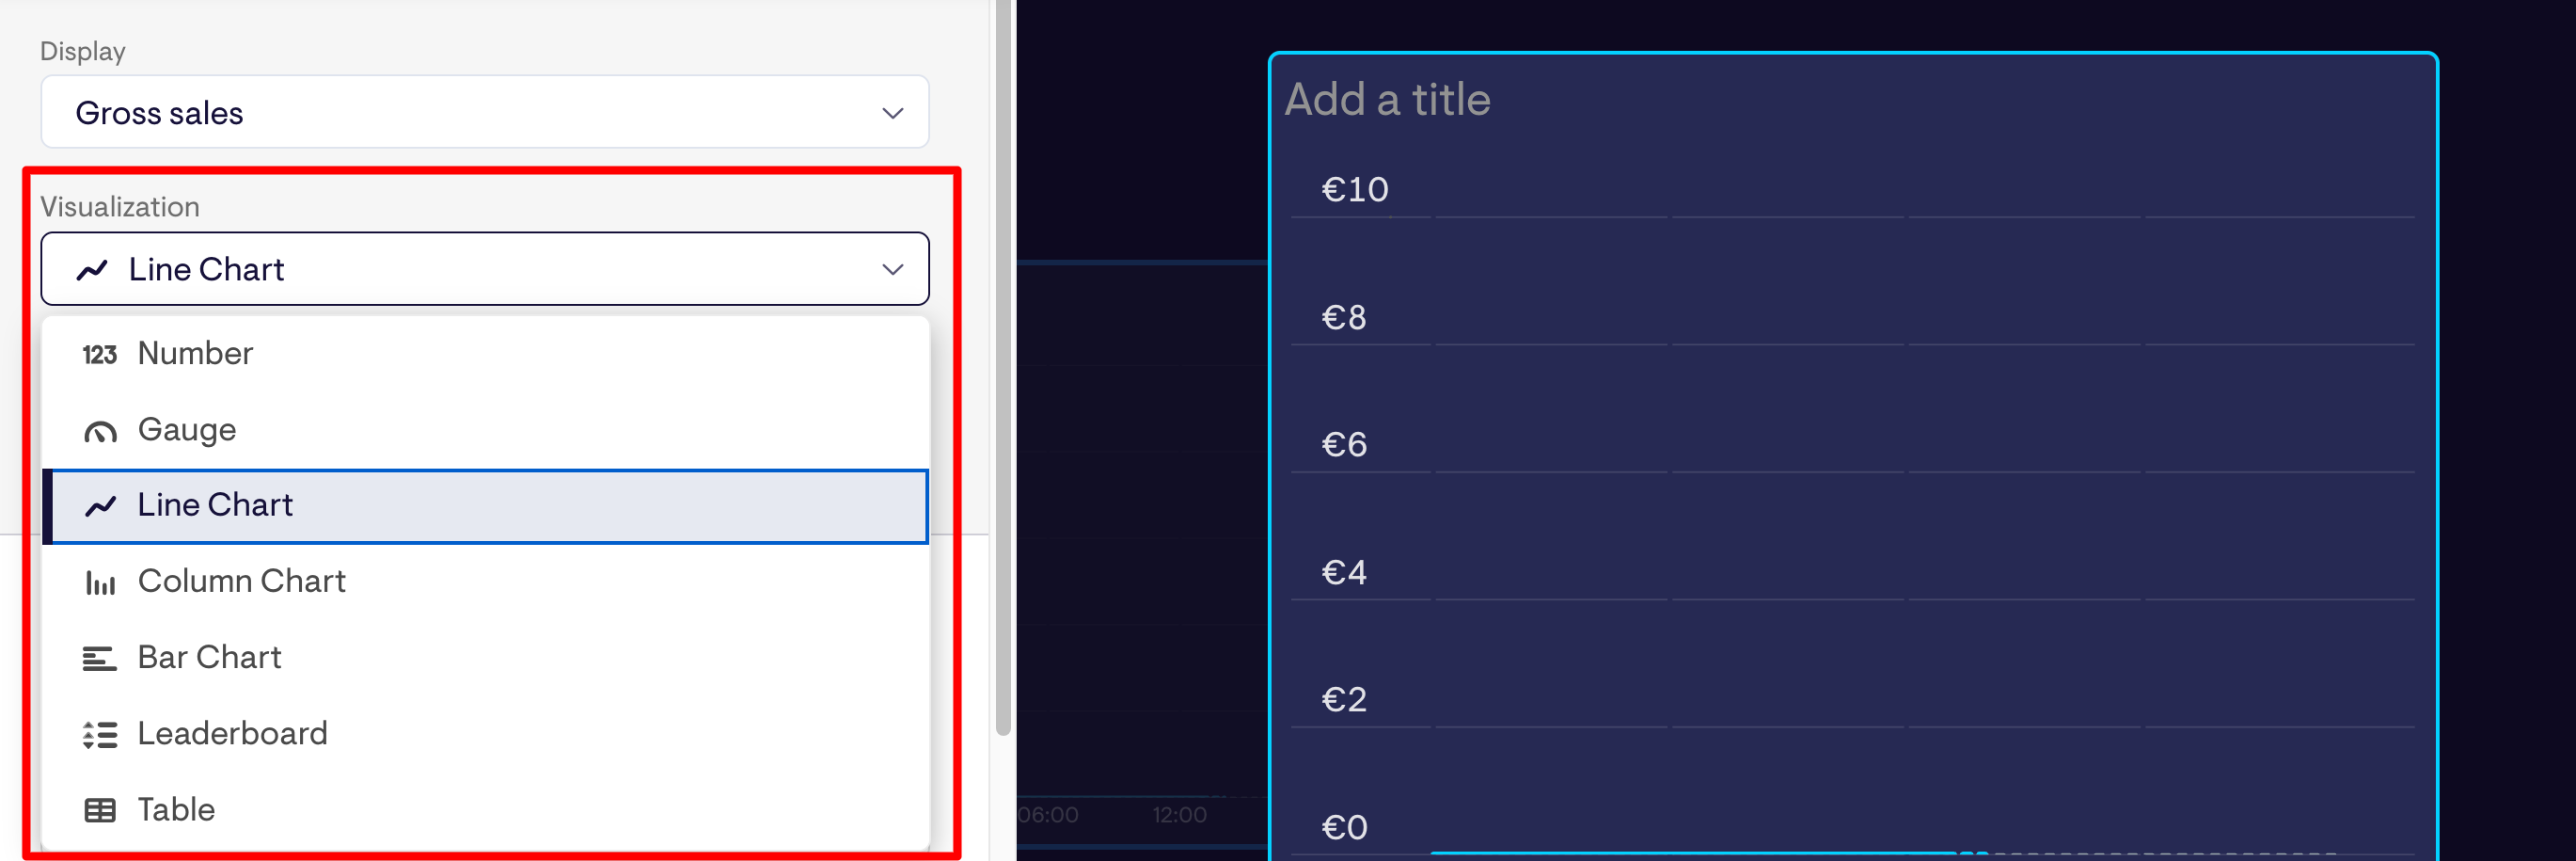
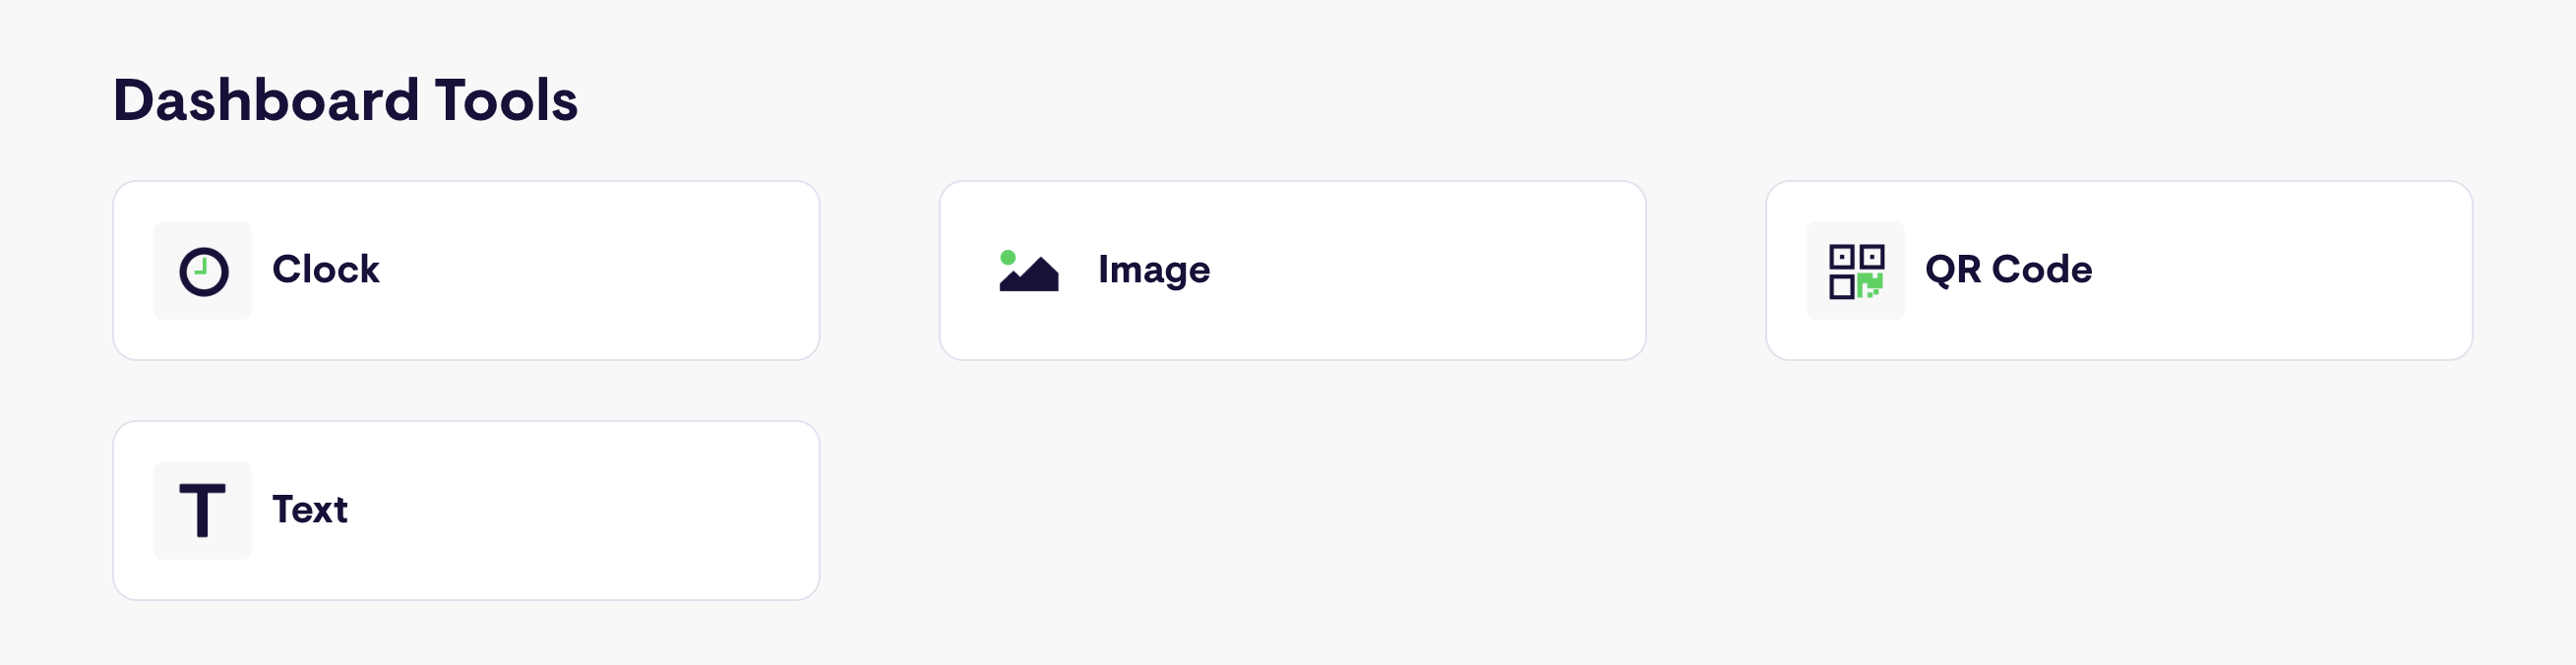
- Dashboard tools: Outside of data source widgets, Geckoboard has four general widgets/tools for displaying text, images, or icons.
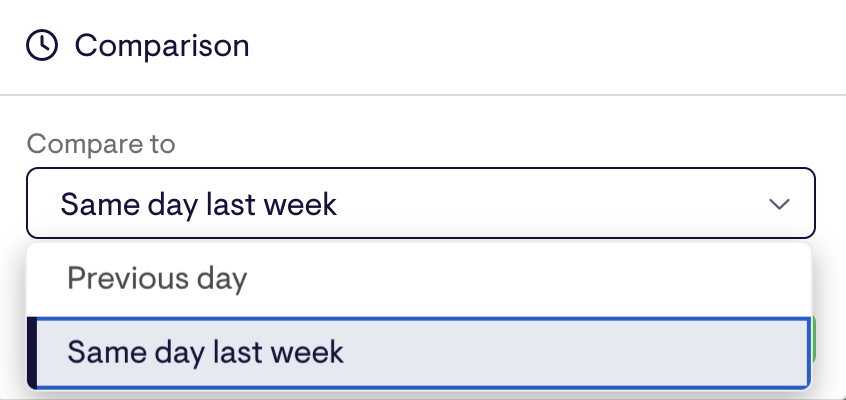
- Comparison period: You can select to compare your data to “Same day last week” or “Previous day.”
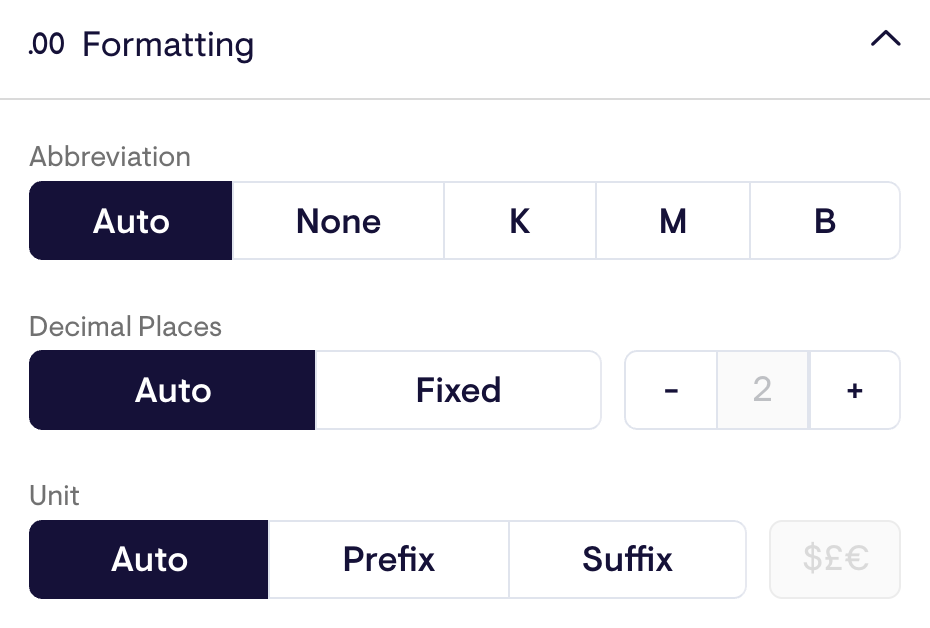
- Data formatting: There are simple data formatting options for changing abbreviations, decimal places, and units.
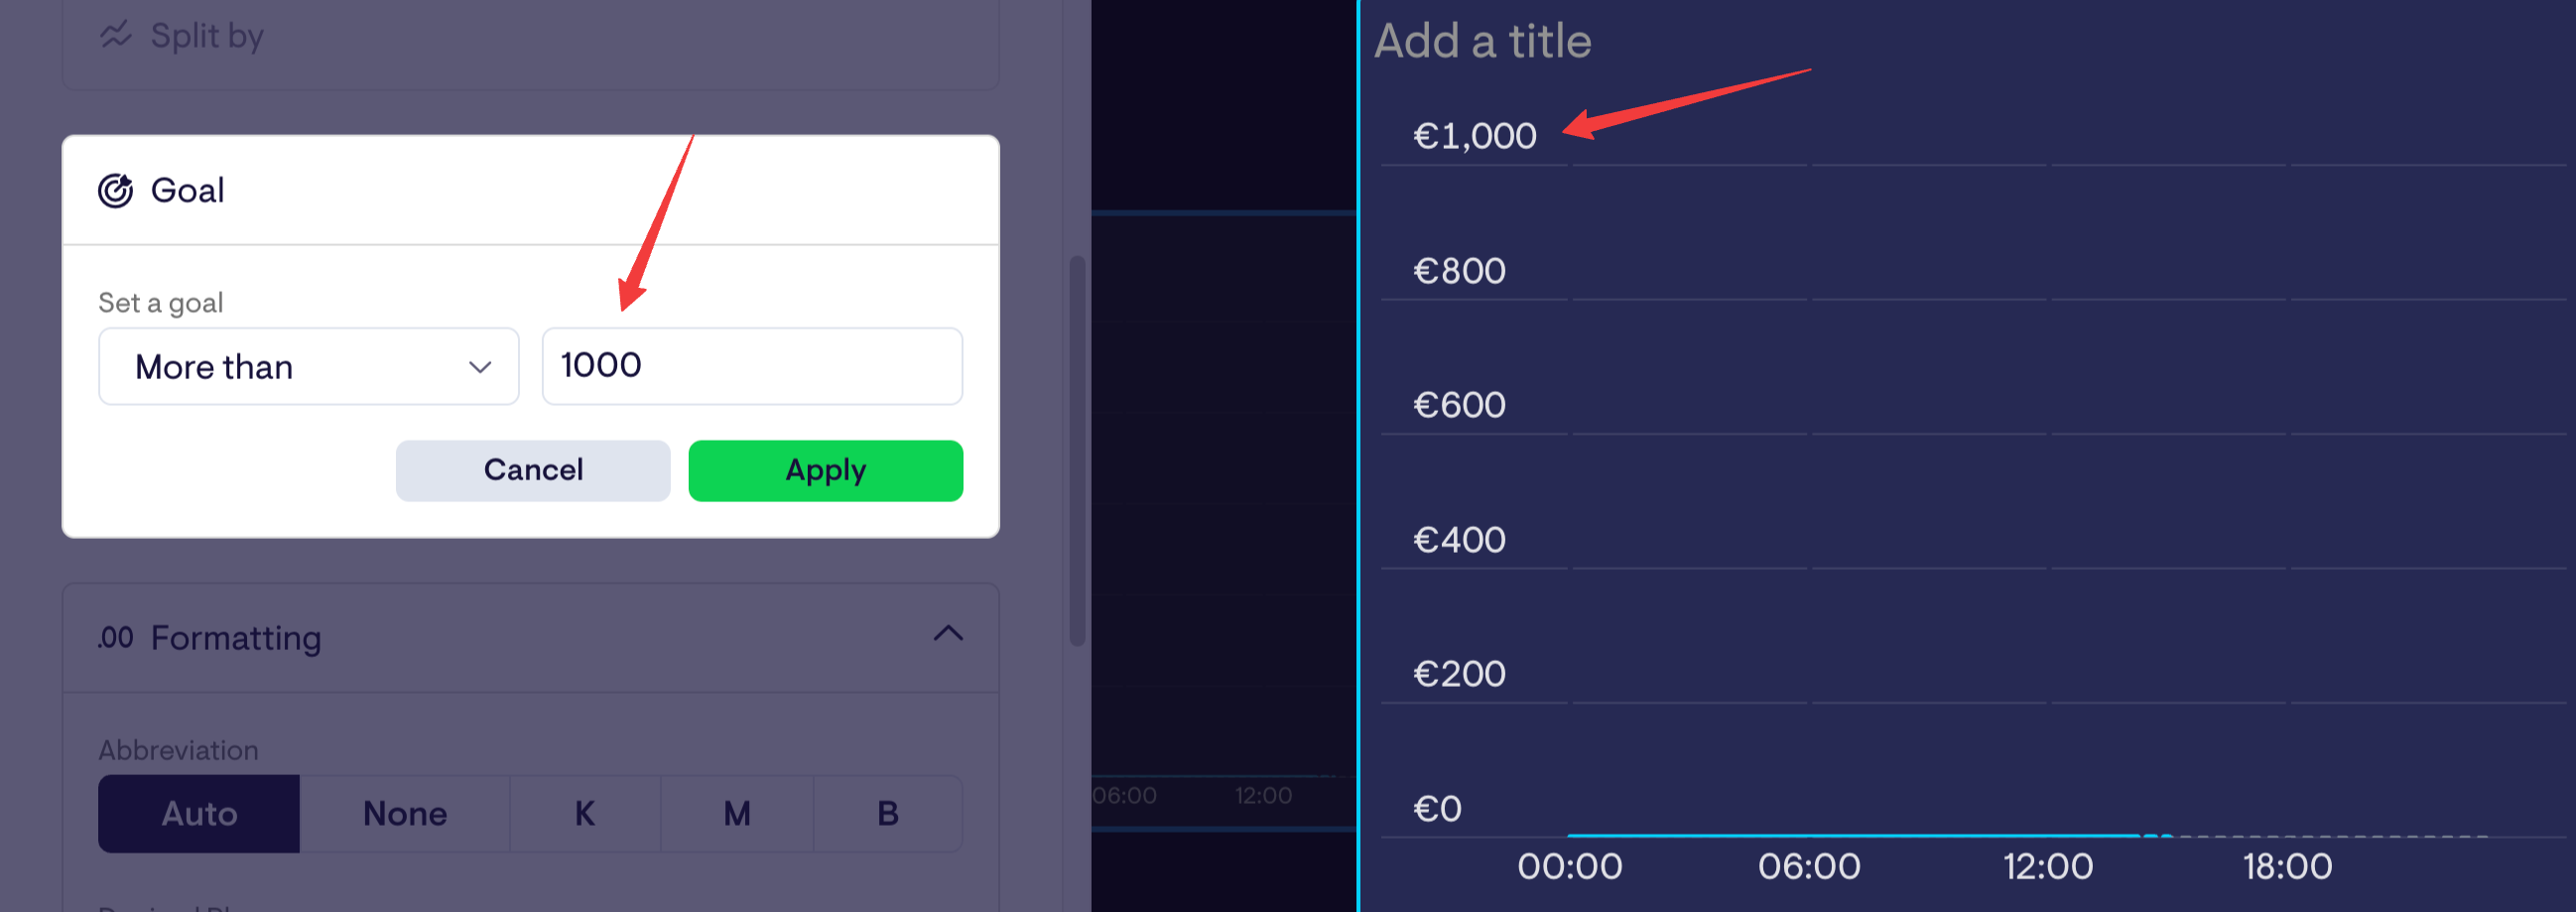
- Goals: As part of Geckoboard performance metrics, you can set numeric goals, which will show up in the dashboard.
This is where the dashboard customization ends, which is pretty limited when compared to most data visualization tools, like Whatagraph.
For instance, on Whatagraph, even each individual widget is customizable to the fullest. You can:
- Adjust or rename the metric
- Change or remove icons
- Apply custom formulas (e.g. data blends)
- Change date ranges and currencies
- Add or hide footers
- Customize the colors of each widget
If that’s not enough, you can also create custom widgets and save them as “templates” to re-use them the next time. These widgets are also fully-responsive. You can resize them however you want—horizontally and vertically.
Want to make your widgets “pop” more? You can add any icons you’d like from our icon library (this is similar to the Emoji library on Geckoboard):
![]()
Does Geckoboard offer white-labeling?
When it comes to white-labeling your reports, Geckoboard offers two features:
- Adding your custom logo: You can add your or your client’s logo, and it will display on the dashboard.
![]()
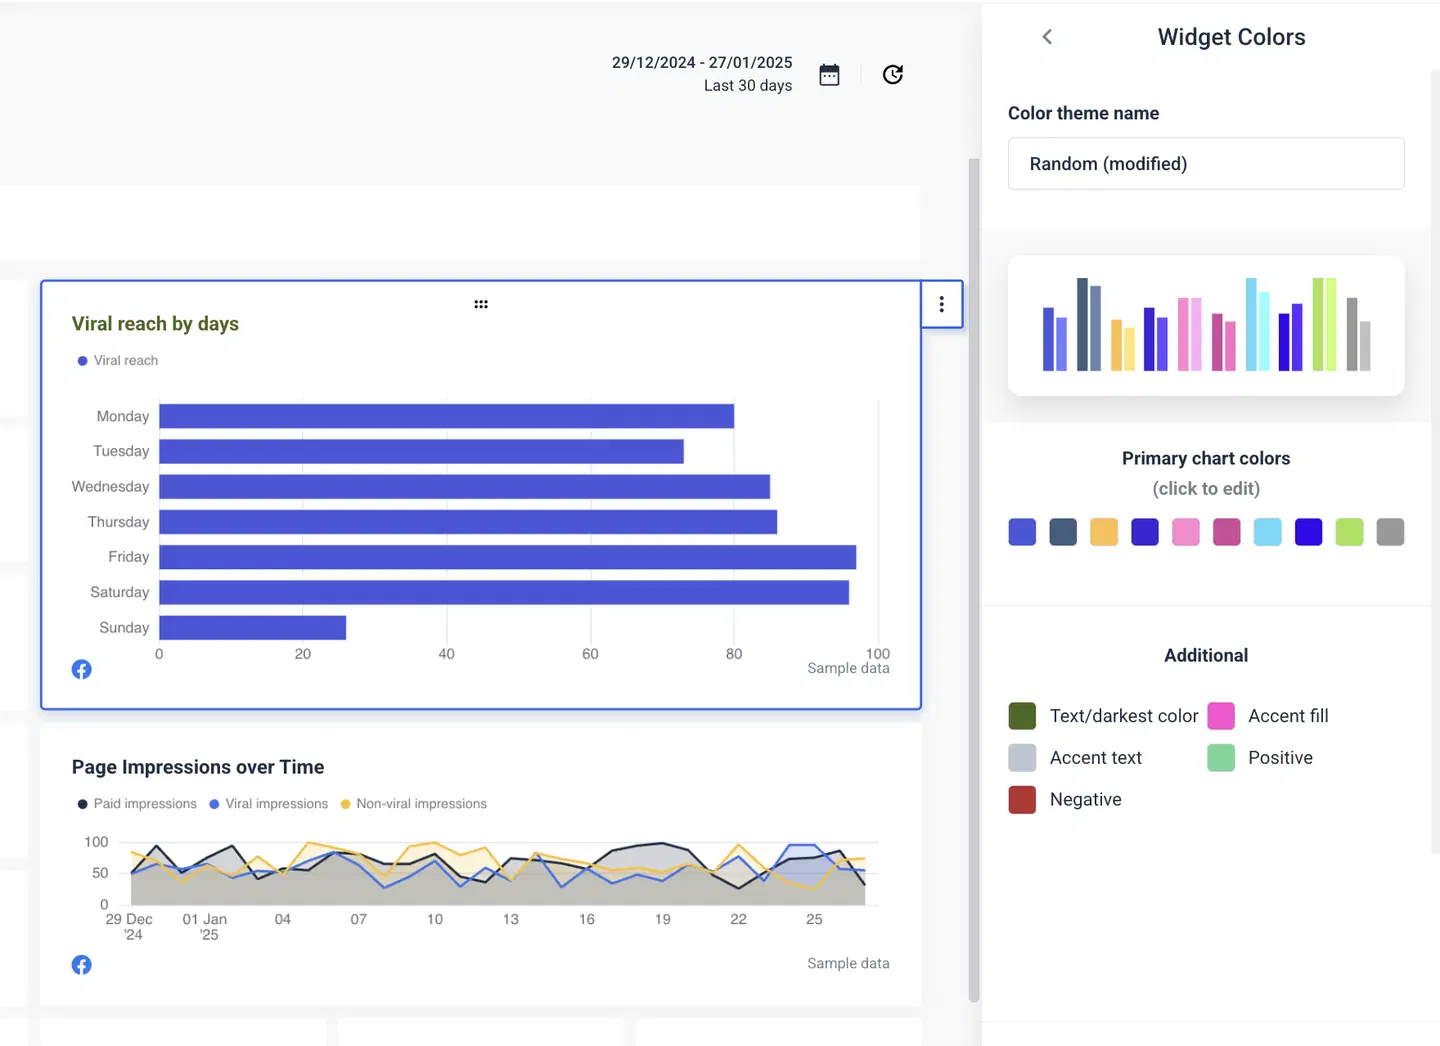
- Changing the colour theme: You can choose between the Dark and Light theme, or create your custom theme.
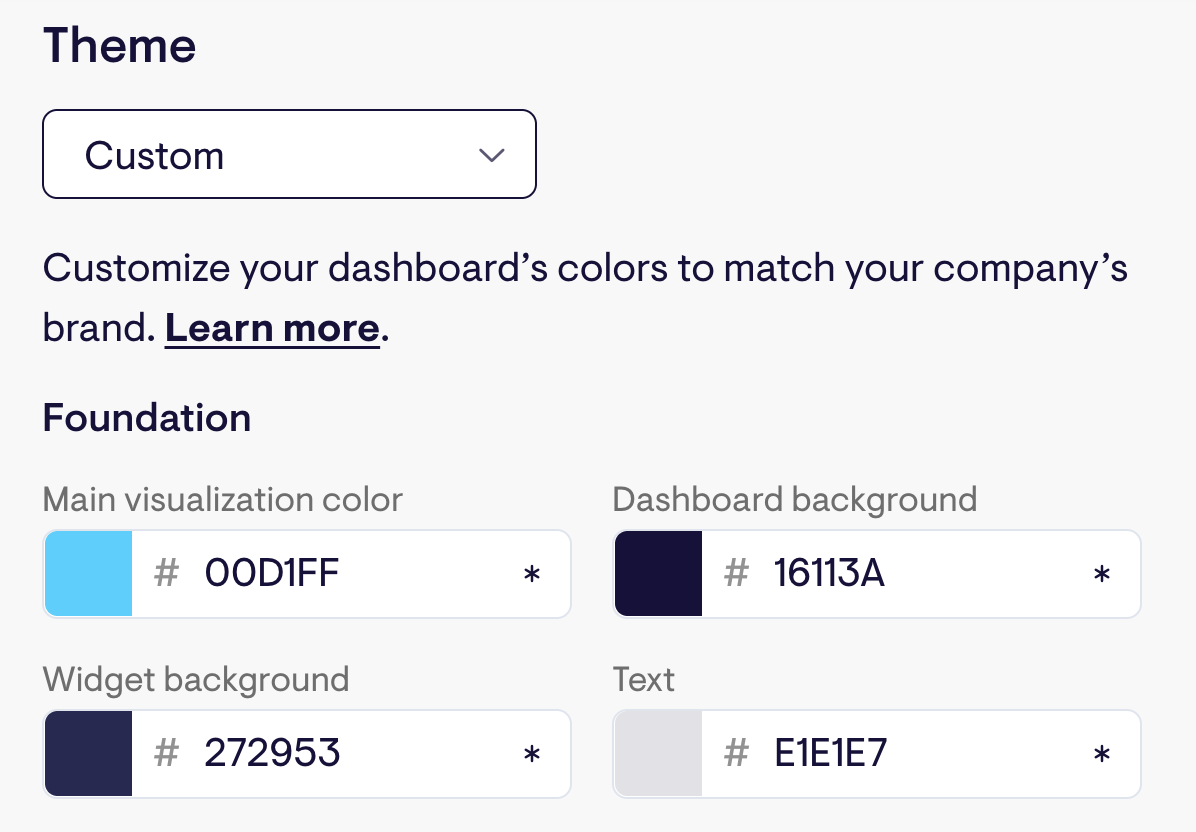 Other than these two, there isn’t any other white-labelling you can do.
Plus, the custom logo and advanced dashboard themes aren’t available on all plans, which is unfortunate for Geckoboard users.
Is there an AI insights feature available?
Geckoboard doesn’t have AI insights (or other AI) features available. This means you need to manually sum up the campaign performance, trends, potential issues, and so on.
Whatagraph solves this problem through two innovative AI features:
- AI chatbot: Our AI chatbot can answer any question you have about your connected sources.
For example: “What was our top-performing campaign on Facebook last month?”
- AI summaries: The AI report summaries feature automatically summarizes your data, and you can add it directly to your reports.
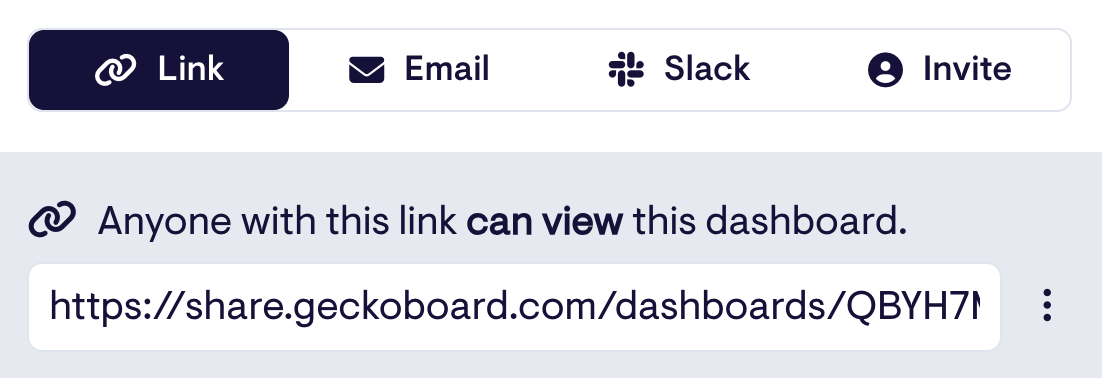
What sharing options are available?
Ready to send your reports? This is where sharing features come into play.
For Geckoboard, you can share your reports via link, email, Slack, TV, or by creating a viewer account.
Simple dashboard customization, white-labeling, and report sharing are available on Geckoboard, but it lacks in AI insights and deeper customization options.
Feature Deep Dive #5: Geckoboard Security
Security is critical for all users, and enterprises can benefit from more advanced security features, like single sign-on (SSO).
To see how Geckoboard stacks up in this area, we looked at key security areas:
How does Geckoboard approach data encryption?
Geckoboard says, "all communication between your computer and Geckoboard is encrypted using HTTPS (256-bit TLS)," which is the industry standard.
Are they covering GDPR basics?
Yes, Geckoboard’s Privacy Policy clearly focuses on GDPR guidelines. It says "your personal data and information is entirely private and secure on Geckoboard," and that "all subprocessors are GDPR compliant as well."
Can you control access to dashboards (role-based access control)
Geckoboard offers a role-based access control feature. There are two categories of users: editors and viewers.
Editors can view, edit, and manage all dashboards, manage user roles, and invite new members, while viewers can view the dashboards they’re invited to.
Remember, though, if you exceed your plan’s editor and viewer limit—each extra one incurs a $25/month additional fee.
What about single sign-on (SSO)?
SSO permits a user to use one set of login credentials (e.g. password) to access multiple applications. Geckoboard has an SSO available for the most expensive Enterprise plan.
So, where does it fall short for enterprise teams?
There are two areas where Geckoboard’s security may fall short for enterprises:
1. The lack of a single sign-on (SSO) feature on all plans, and;
2. Extra costs for inviting new editors or viewers into your dashboards
The extra cost is especially a drawback—since Whatagraph lets users invite unlimited team members and viewers onto dashboards and reports.
Geckoboard takes care of GDPR and data encryption. Single sign-on (SSO) is available for the Enterprise plan and role-based access control for all plans, though it can involve extra costs.
Feature Deep Dive #6: Geckoboard Customer Support
This is an important one. How’s the customer support team for Geckoboard?
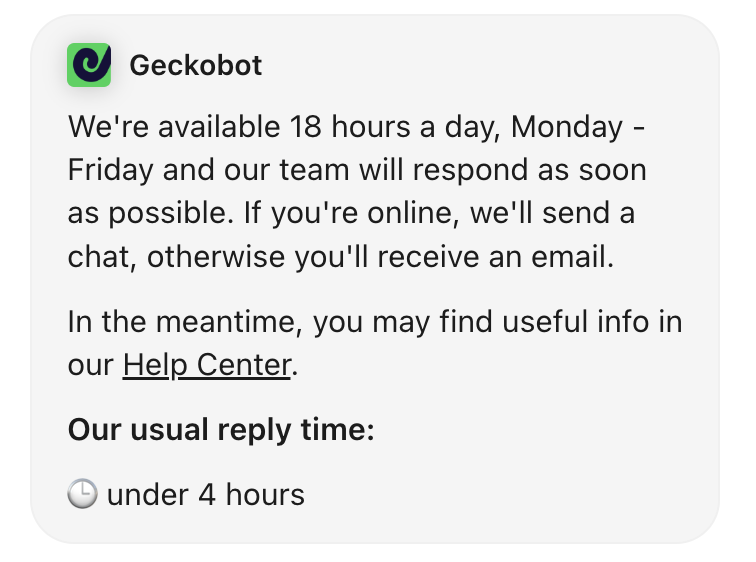
All Geckoboard users have access to a basic live chat and email support, which is available Monday to Friday—18 hours a day.
Geckoboard promises “an usual reply time of under 4 hours.”
We tested the live chat support ourselves and found it generally helpful. We got a response in under an hour, which most users would agree is an acceptable response time.
But on Whatagraph, our amazing Customer Support team replies to messages under 4 minutes during working hours (18 hours a day, CET), and resolves most issues within 4 hours.
So, compared to Geckoboard, 4 hours is our standard for resolving issues, not just for replying to messages.
This is what Kim Strickland, Digital Marketing Specialist at Peak Seven, loves about Whatagraph. She says:
I've joked about this often—with Whatagraph, we're not paying for a reporting system. We're paying for customer support. There's a level of dedication from the Whatagraph team that you don't often experience anywhere else.
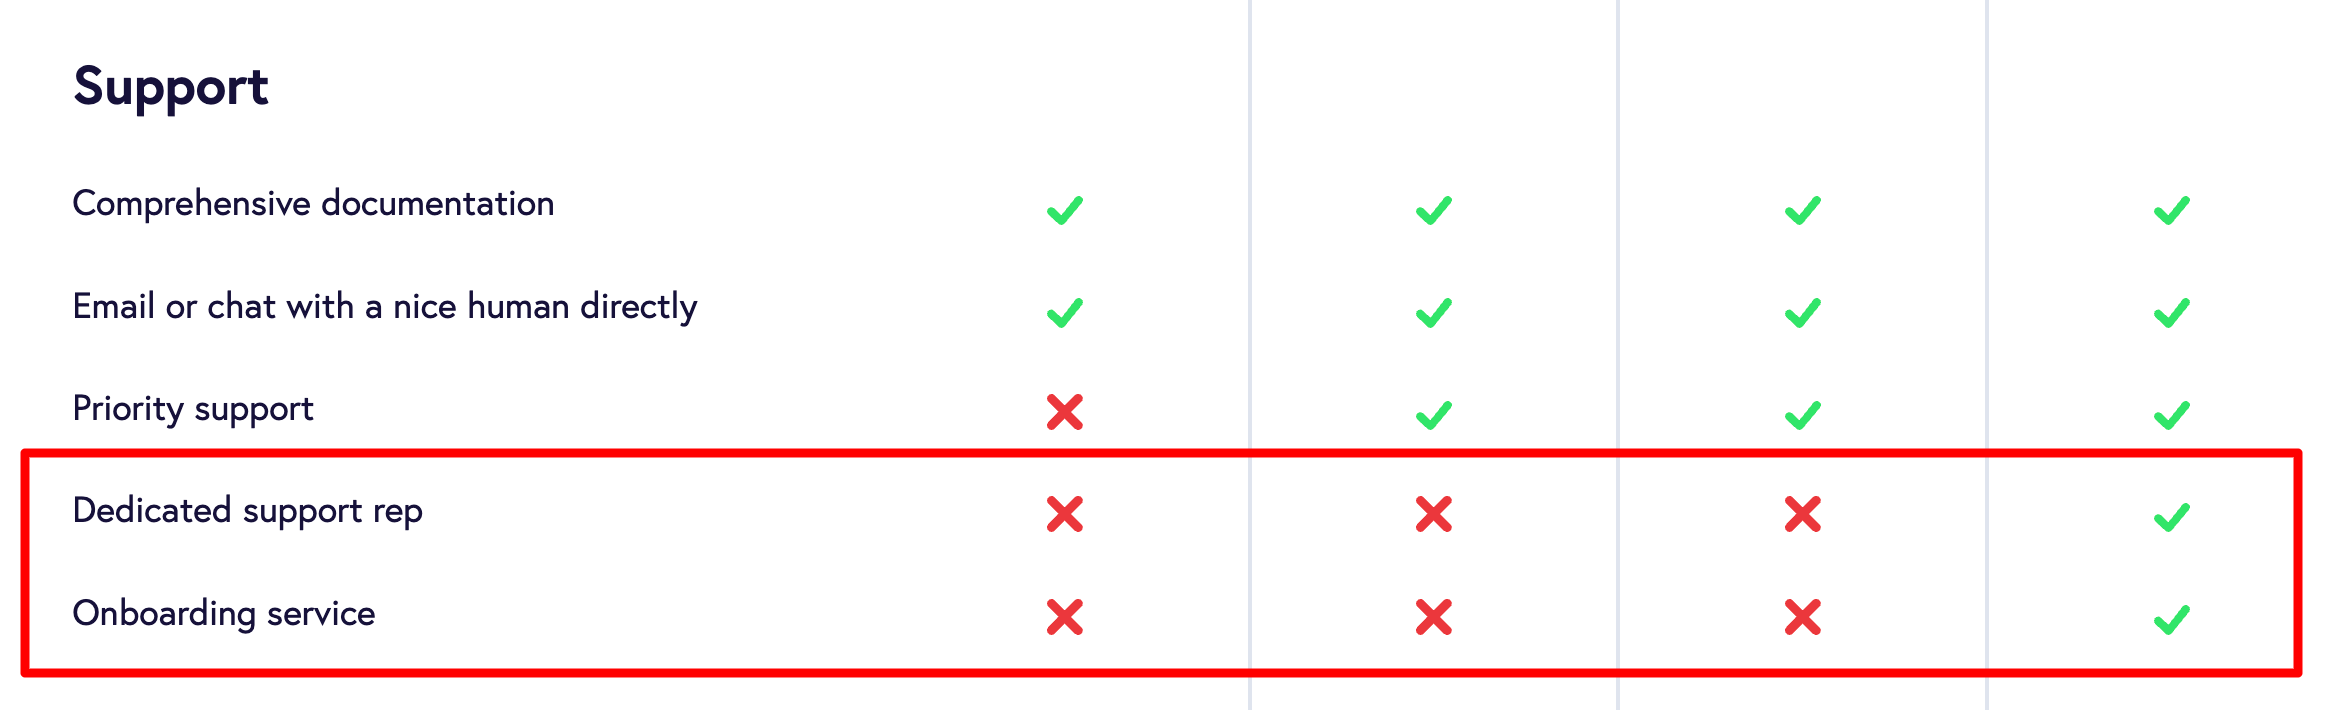
Geckoboard users on the Enterprise plan get access to a dedicated support rep and onboarding service:
It’s a bit unfortunate these support options are only available on the Enterprise plan—especially because a few competitors offer them on all plans.
For instance, Whatagraph users on all plans get access to:
- Personalized onboarding
- A dedicated Customer Success Manager
- Live chat support with >1 min first response time
This is important, as you can be sure to get help immediately if you’re facing an issue.
But, this isn’t all there is to customer support; let’s see what self-documentation options Geckoboard has.
Geckoboard has an “Academy” page with six different topics:
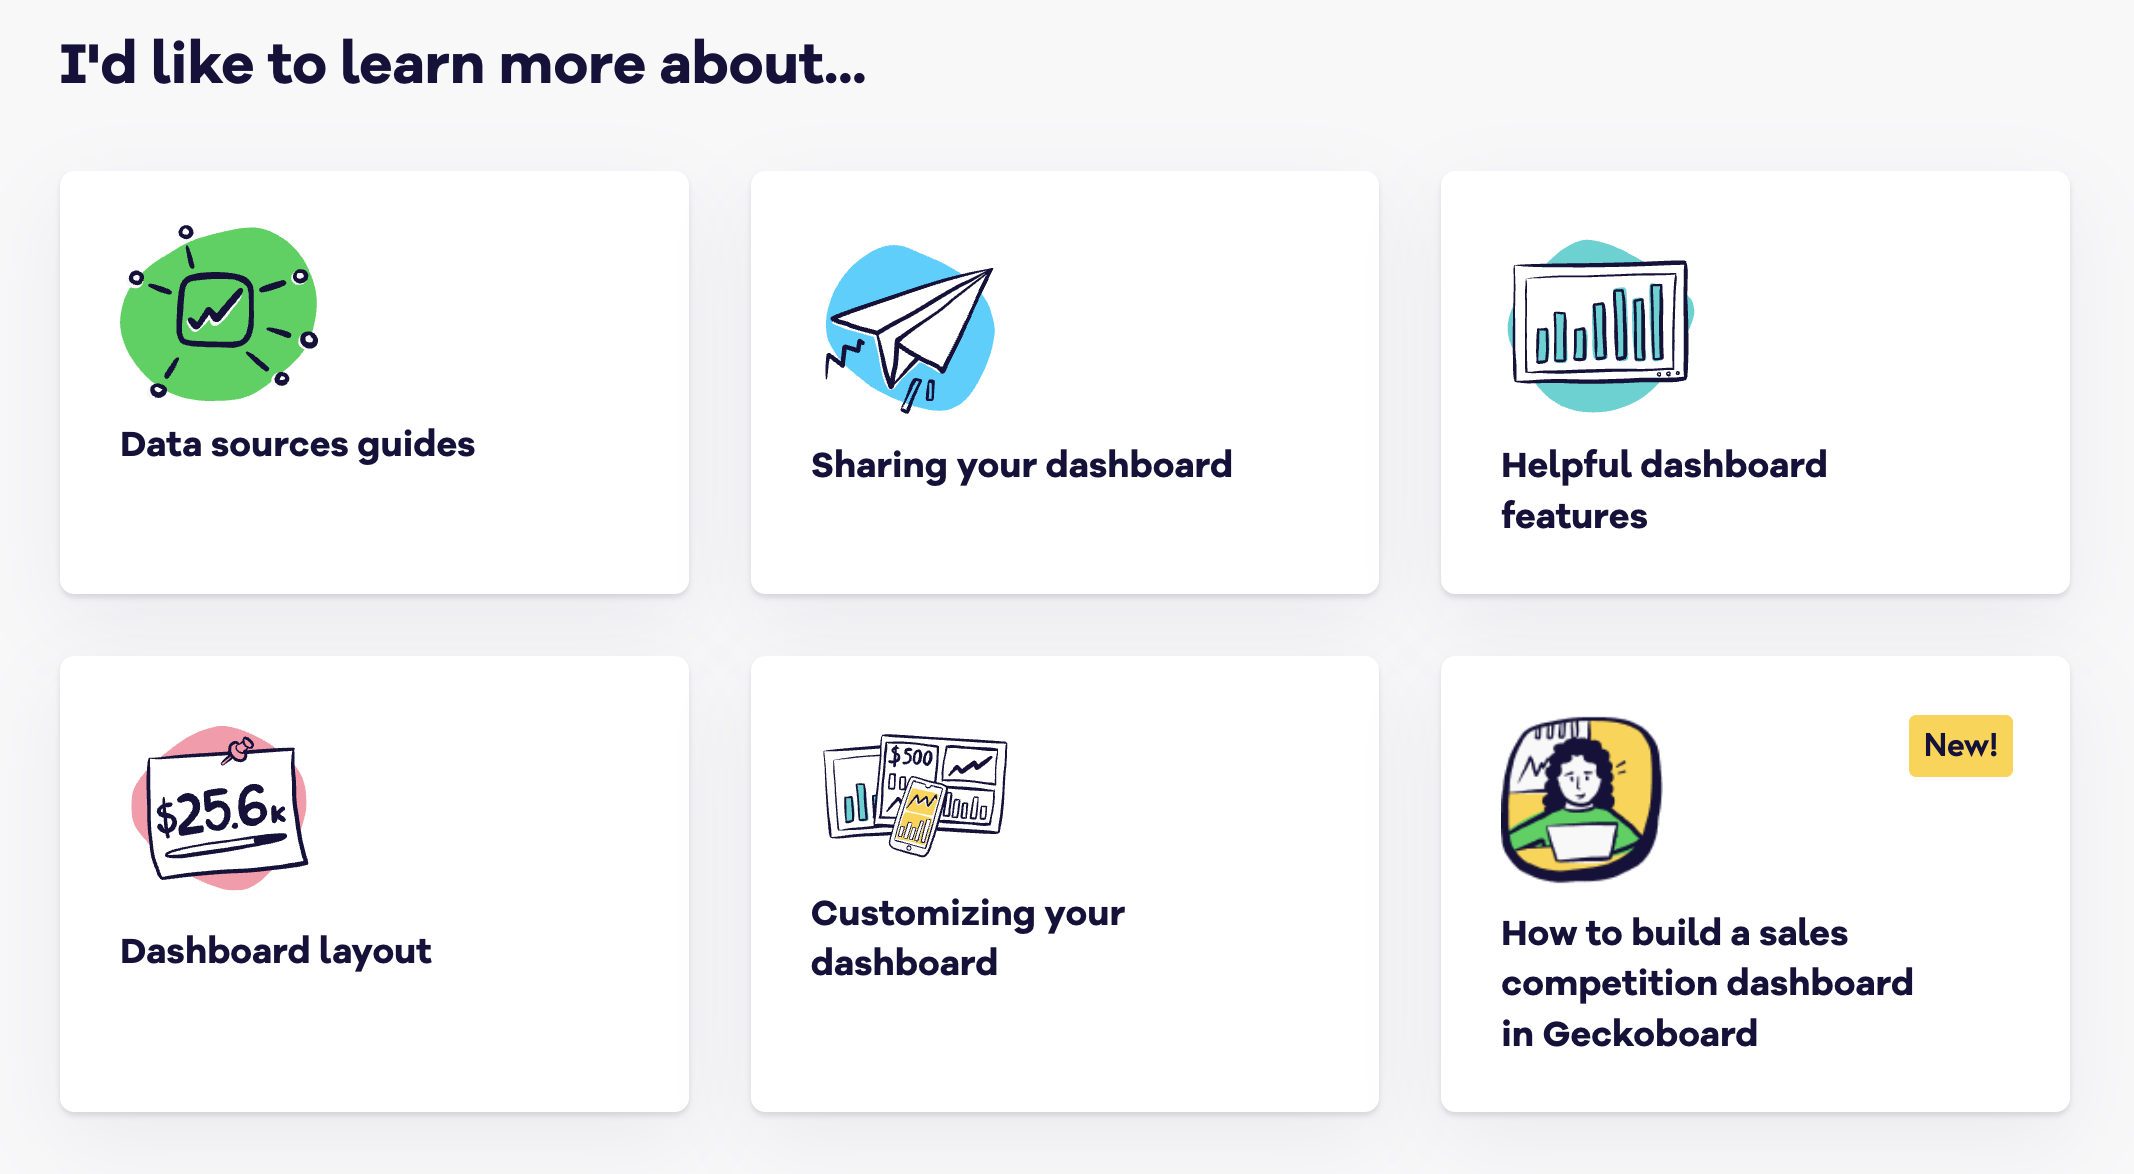 Most of these are individual pages with no further sub-categories, so we’d argue there isn’t actually much self-documentation available.
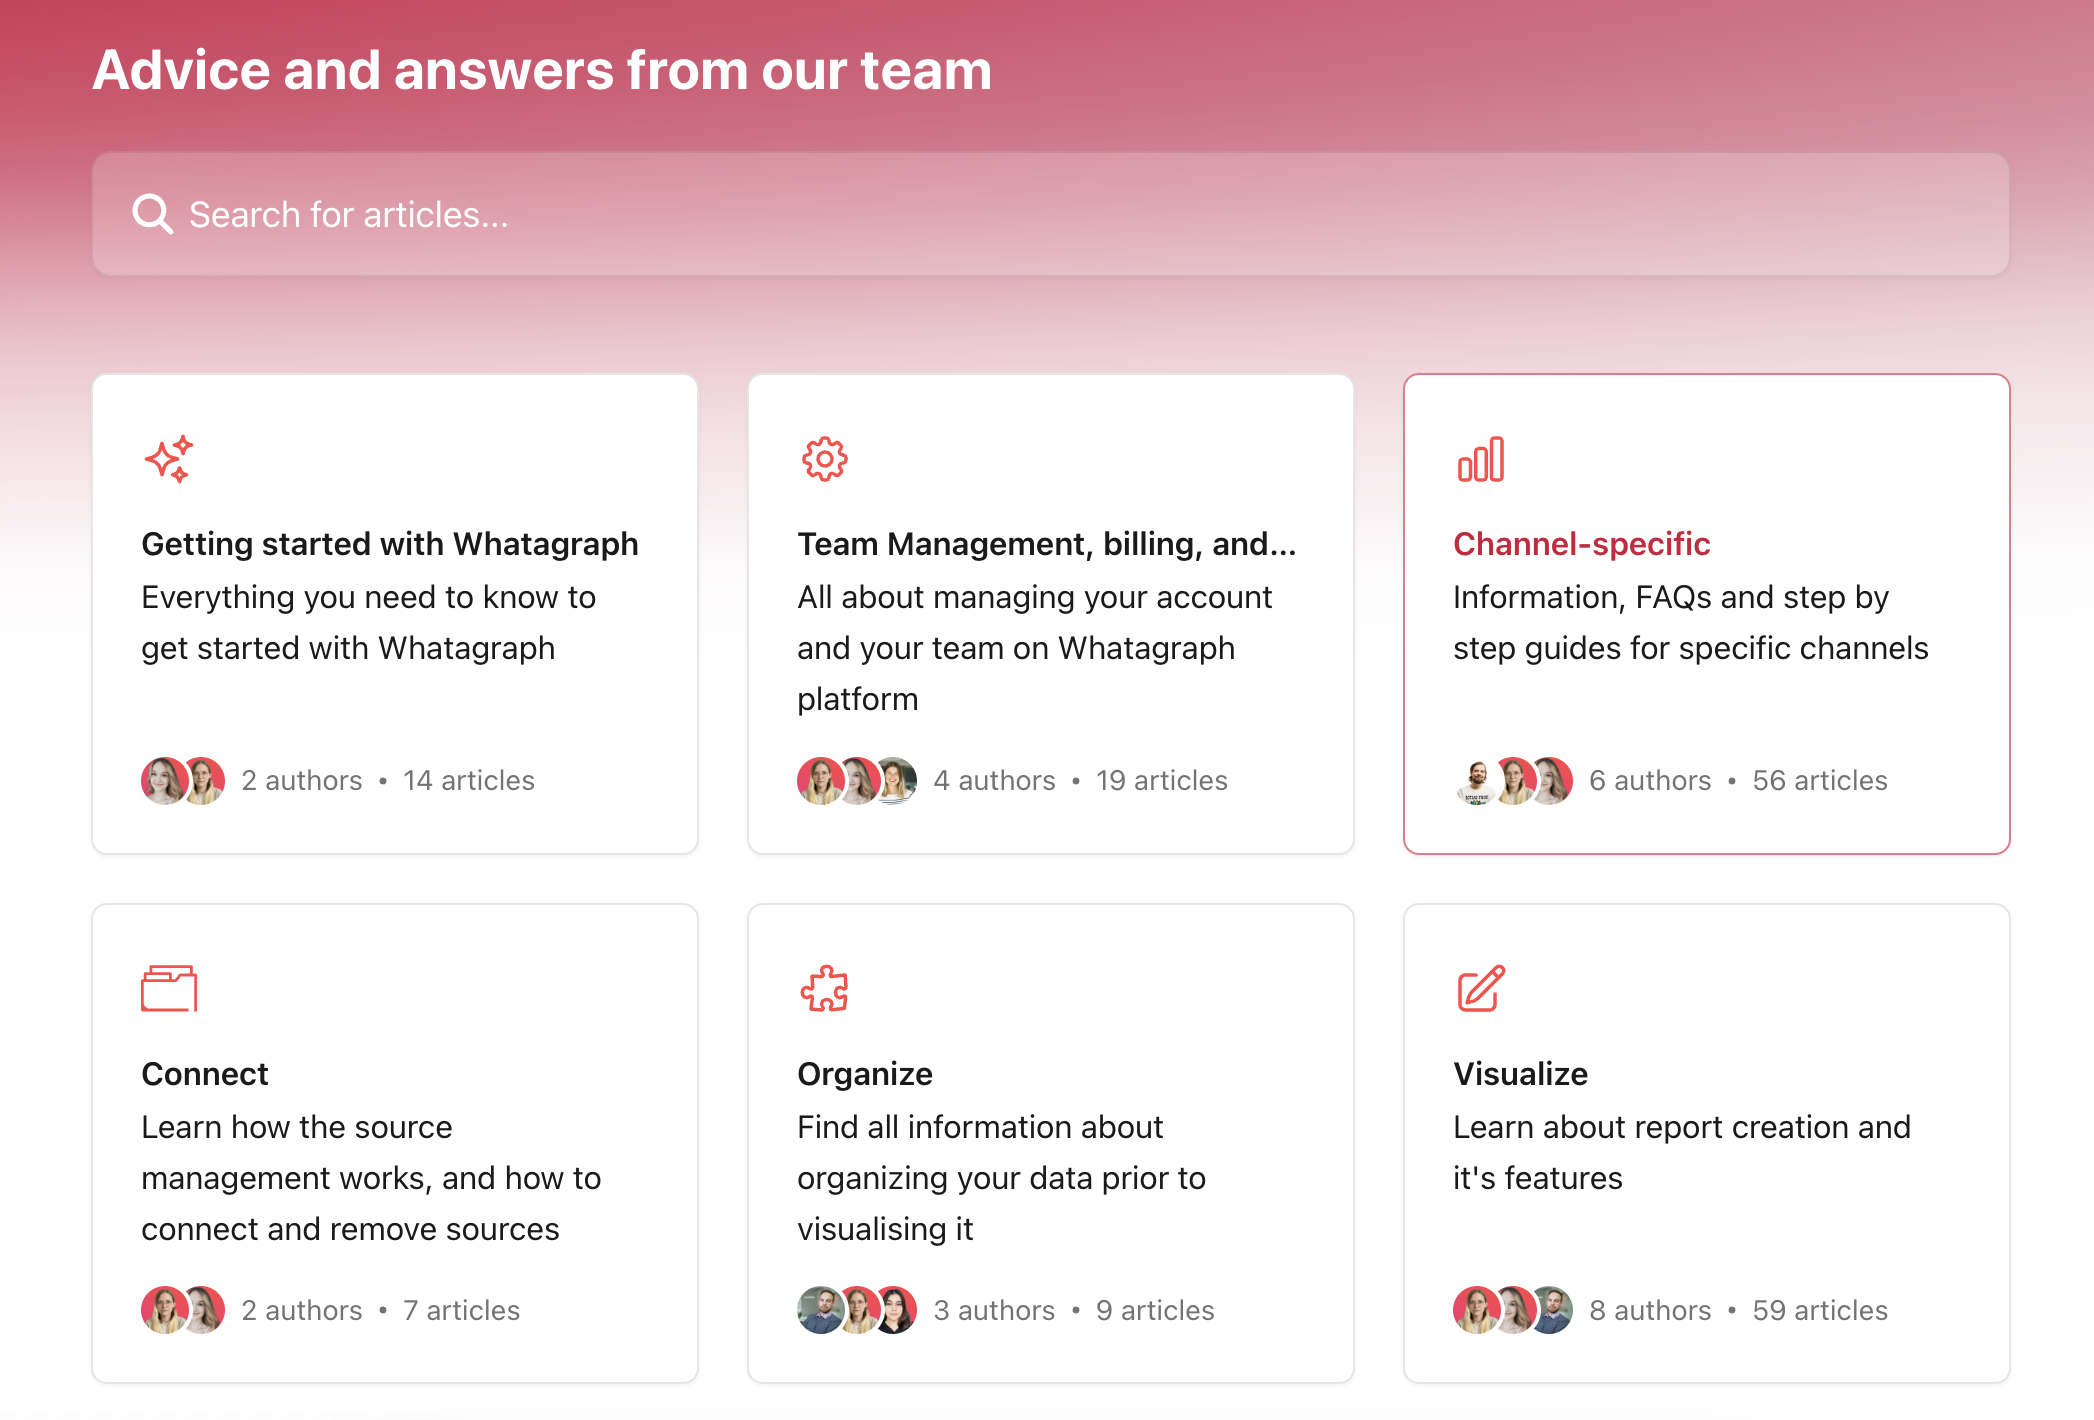
Comparatively, Whatagraph has an extensive help center with 100+ articles, covering all features of the platform in detail.
Whatagraph’s help center is divided into different main and sub-categories, so finding the right topics for troubleshooting is easy:
Live chat replies within 1-4 hours, but most users don’t get access to personalized onboarding or a dedicated support manager, which can prolong the onboarding process.
How does Whatagraph Compare Against Geckoboard?
We’ve shown you how Geckoboard works and where it falls short in the previous sections. Now, let’s see how Whatagraph compares against it.
What is Whatagraph?
Whatagraph is an all-in-one reporting platform that makes it easy to connect, organize, visualize, and share your data.
Its main goal is to help marketing agencies like yours create custom dashboards and reports at scale while saving 10+ hours per month in the process.
That is why agencies like Peak Seven choose Whatagraph for client reporting:
Here’s how Whatagraph solves the problems Geckoboard users face:
✅ All-in-one platform
- The Geckoboard problem: Geckoboard is purely a data visualization tool, meaning you can’t do much else than connect and visualize your data.
- The Whatagraph solution: Comparatively, Whatagraph is an all-in-one reporting platform that takes care of your entire data journey. Not only can you connect and visualize data—you can also transfer it into third-party tools like Looker Studio and BigQuery, and export your data from reports as Excel or CSV files.
Don’t just take our word for it. See what this G2 user said:
Whatagraph helps to connect, visualize, and share all of our marketing data in a single platform.
✅ Data blending
- The Geckoboard problem: Geckoboard doesn’t support aggregating data from different widgets/datasets. The only way to compare data is to place it side-by-side on your dashboard.
- The Whatagraph solution: On Whatagraph, we have an entire section called Organize, where you can blend metrics and dimensions, create custom formulas, group data sources by campaigns or regions, and more.
Tanja Keglić, Performance Marketing Manager at Achtzehn Grad agency, appreciates this:
The biggest reason we chose Whatagraph was because of its holistic approach to reporting. We can blend data from different channels and see in one view what's the performance and what needs to be changed.
✅ Ready-to-use templates
- The Geckoboard problem: Geckoboard doesn’t offer ready-made templates for dashboards, which would significantly speed up the process of visualizing data.
- The Whatagraph solution: To build your dashboards and reports, you can use our ready-made templates or dashboard examples. Alternatively, Whatagraph’s Smart Builder lets you create new dashboards instantly.
One of our users said the following on the templates:
Whatagraph provides pre-designed report templates and customisable visualisations such as charts, graphs, and tables to show data clearly and entertainingly.
✅ Fully-customizable dashboards
- The Geckoboard problem: Geckoboard’s dashboards are static, and there are limited customization options. Plus, there are no AI features for summarizing campaign performance.
- The Whatagraph solution: With Whatagraph, you can add widgets in four ways, apply custom formulas, change and remove icons, apply performance insights with AI, add or hide footers, and much more. Our dashboards and reports are truly customizable.
Patrick C., Director of Performance Marketing, said this on G2.com:
Whatagraph is extremely flexible and the visuals are beautiful, which is important for having clients be engaged in the reports. It’s very customizable to make complex data easy to ingest for the client.
✅ White-labeled reports
- The Geckoboard problem: Geckoboard’s white-labeling is mainly limited to uploading your logo and selecting between different color schemes. You also can’t remove Geckoboard’s branding from the dashboards.
- The Whatagraph solution: In Whatagraph, you can customize your color scheme for the entire report, even the individual widgets. You can add your own logo, add custom headers and footer text, and modify the fonts.
Want a full breakdown? Check out our guide on Geckoboard alternatives.
Final Verdict: When to use Geckoboard and When to Switch to Whatagraph
From the surface, it may seem like Geckoboard and Whatagraph are full of similarities.
The main difference is, though, Geckoboard is a starter data visualization tool, while Whatagraph is an all-in-one marketing reporting tool helping agencies create customizable reports, at scale.
That being said, here’s a breakdown of when we’d recommend choosing Geckoboard and when Whatagraph:
Choose Geckoboard if:
- You want to solely track your internal teams' performance
- You need to create simple, visual dashboards to display performance data
- You’re okay with basic white-labeling (custom logo and a couple of color presets)
- You don’t need to blend data from multiple sources—just show individual metrics as they are
- You’re not going to ship data into third-party platforms, like Looker Studio or BigQuery
Geckoboard use cases are best suited for internal teams that need simple, straightforward dashboards to monitor KPIs. However, agencies with more advanced needs may find the features lacking.
Choose Whatagraph if:
- You’re an agency owner managing multiple clients and campaigns
- You want to speed up workflows with ready-to-use templates and AI insights
- You’re looking to share your data with third-party platforms like BigQuery and Looker Studio
- You need deep customization: Widget design, layouts, filters, etc.
- You want to add your own branding and make white-label reports
- You want to aggregate your data and create data blends, custom metrics, and custom dimensions
- You want to make the right decisions based on real-time data updates
Talk to our team to get started.