Reports you can build with Smart Builder
Smart Builder is your next marketing report solution. Connect your channels, collect the necessary metrics, and improve your marketing strategy ASAP.

Aug 30 2021●7 min read


Marketing analysis is a fascinating process that drives many decisions in agencies and marketing departments worldwide. Well, it’s fascinating for us because we crunch statistics for breakfast.
However, we’re very much aware that analytics takes time, knowledge and effort. Business leaders worldwide cite the ability to pull data on customers as high impact on their ability to make business decisions.
Luckily, we sat down to solve this issue, and our solution is the Smart Builder. It’s a tool built into Whatagraph that allows you to create reports in under a minute. We know - we timed it. We’ve taken the most popular marketing channels and the most sought-after metrics, put them in a 2-step selection menu, and that’s it. Your report is generated.
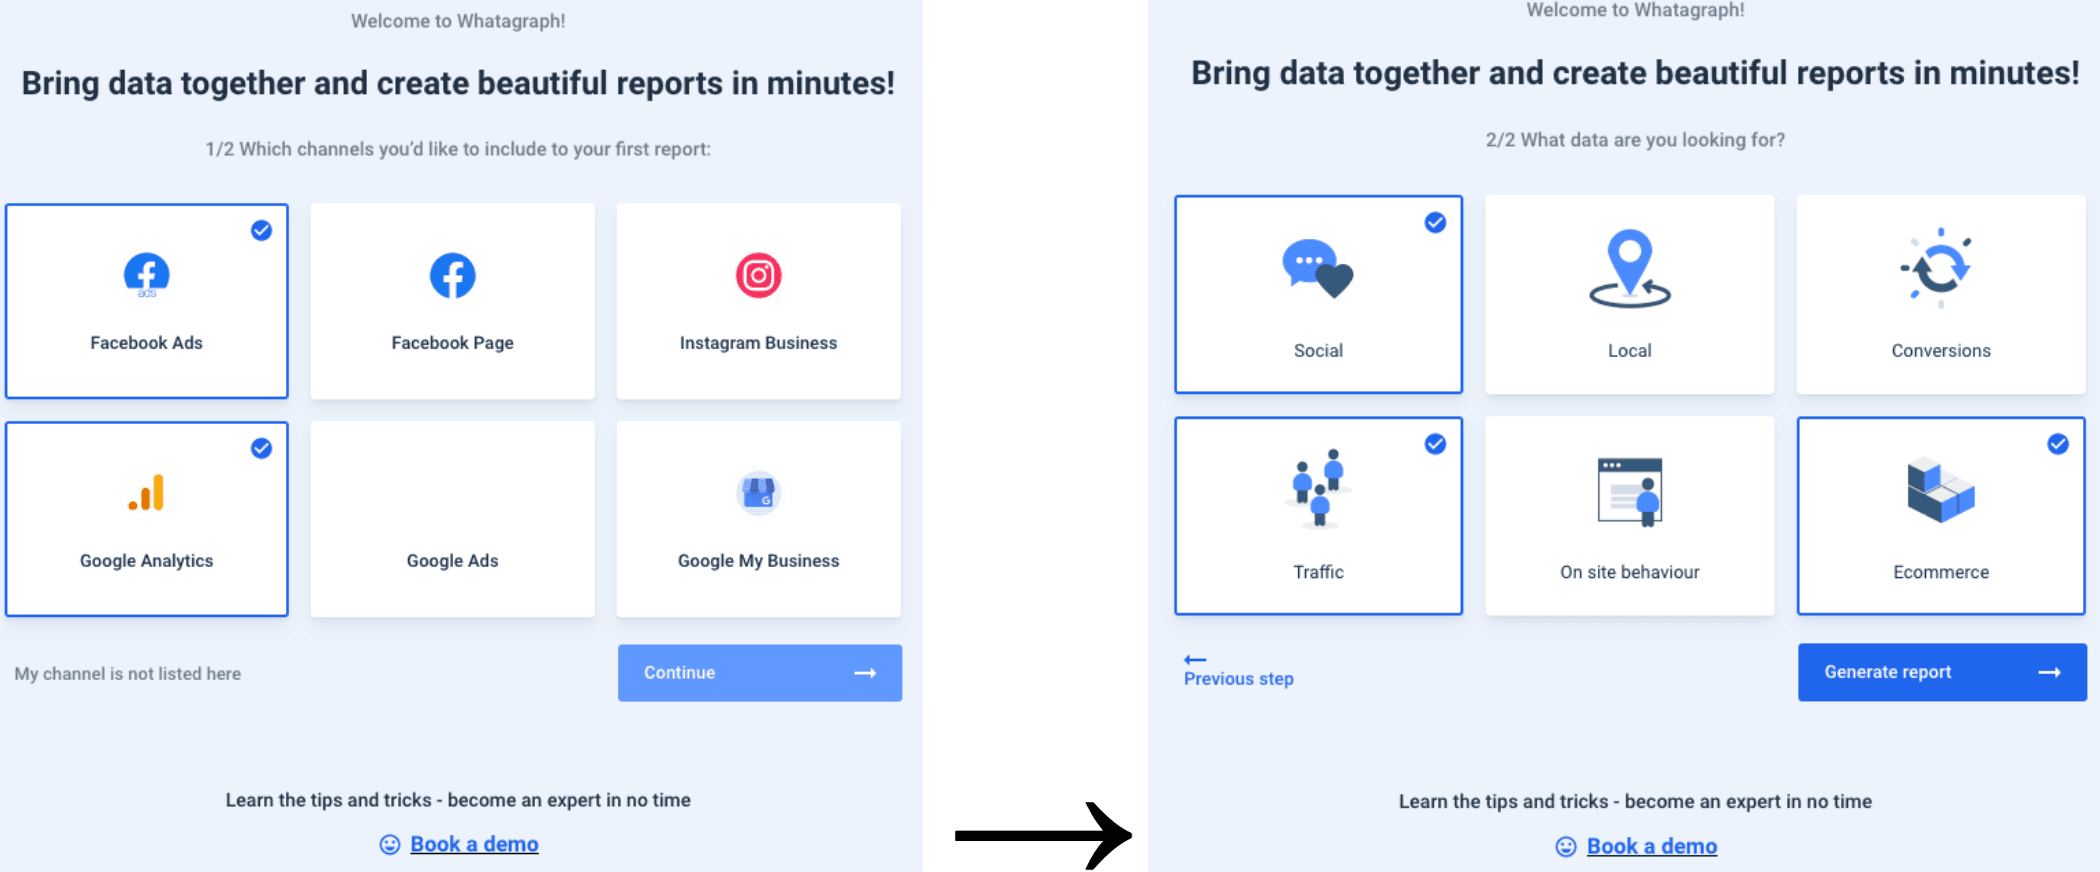
But what reports precisely can you build with the Smart Builder? Here we introduce each channel and metrics available to them.
Keep in mind: you can select more than one channel for a single report. You can even select all of them! Same with metrics: you can choose several, or you can take them all.
So, let’s dive into the reports!
Facebook Ads - takes your Facebook Ads data and builds a quick report on how it’s doing over the last month. You can edit the time period and every widget as needed.
Facebook Ads channel can contain the following metrics:
- Social - crucial stats like clicks, CTP, CPC, ad engagement, ad reach, comments, reactions and more. The report includes a goal widget that can be modified to see the big picture of your advertising efforts.
- Conversions - showcases conversion costs, rates, audience and also goals.
- Traffic - shows traffic your Facebook Ads are bringing to the website or Facebook Page.
- On-site behavior - shows how visitors interact with your content and how much each content viewing costs.
- E-commerce - if your Facebook Ads are connected to an e-shop, or you sell directly on Facebook, this metric will showcase purchases made as a result of seeing your ads.
Facebook Page - takes data straight from your Facebook Page and lays it out in a comprehensive, insightful report.
Facebook Page channel can contain the following metrics:
- Social - in this case, it showcases detailed post interactions, impressions, clicks, viral and paid impressions, reach and more. Our media widgets allow you to see your page posts with visuals directly in the report!
Instagram Business - once you add this channel, you can instantly build an Instagram insights report on your Instagram account and its performance.
Instagram Business channel can contain the following metrics:
- Social - here you can see the number of followers, changes over time, likes, top-performing posts - with visuals too! You can also track the reach your account has, the number of messages and even Stories stats!
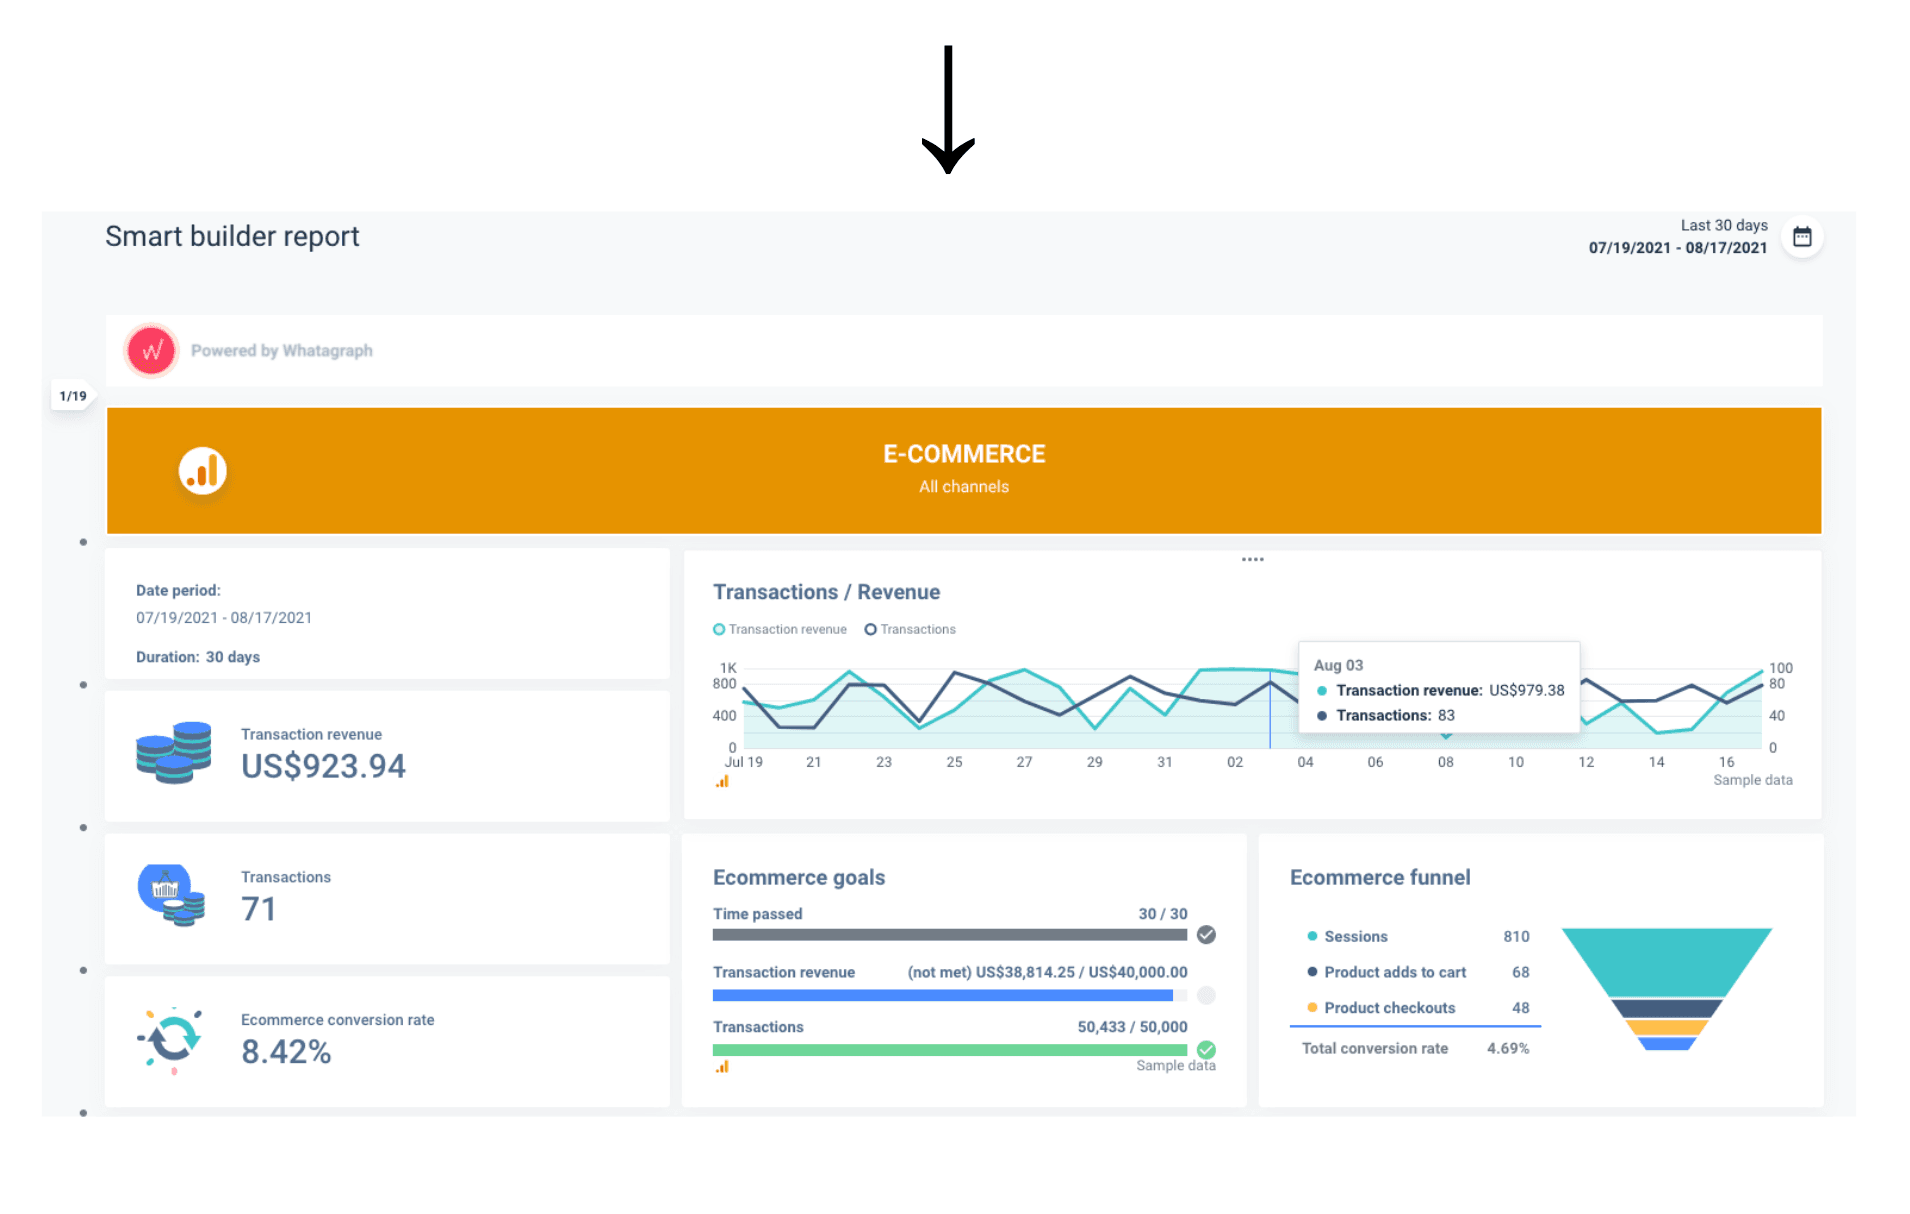
Google Analytics - this is a big one. Adding all these metrics to the reports produces a detailed and accurate picture of your page performance. If you connect your Analytics to an e-commerce platform, the report gets even bigger, better and more insightful.
Google Analytics channel can contain the following metrics:
- Local - showcases the traffic your site is getting from local visitors. You can see both organic and paid traffic.
- Conversions - whether you count a filled out form or a purchase as conversion - this metric will showcase your performance. You can view conversions through ads, an average value of one conversion, which sources and campaigns perform the best and many other metrics.
- Traffic - here, you can see organic, direct and paid traffic coming to your website. You can determine which channels and campaigns generate the most traffic and how long users stay on your site.
- On-site behavior - once users come to your website, tracking their behavior becomes paramount. Stats like average session duration, number of pages visited, new vs returning visitors, their geographical location - all play a part in determining healthy on-site behavior.
- E-commerce - probably the most significant chunk of the report. In under a minute, you can see your revenues, best and worst-performing products, most productive campaigns and sources, audience profile, order values - and many, many more metrics on your e-shop performance!
Google Ads - the ultimate goal of your paid ads is to bring traffic and conversions to your site. If you’re running an e-shop, that goal changes to direct purchases. This report gives you an accurate picture of how your paid advertising is performing and what could be improved.
Google Ads channel can contain the following metrics:
- Conversions - this part of the report shows how many conversions your ad campaigns and ad groups bring to your site. You can track different conversions and their change over time. Most importantly, you can see your conversion goal and measure how you’re performing towards achieving it.
- Traffic - paid ads are also a tool to bring users to your site. Paid traffic has many channels, including ad campaigns, groups, keywords, etc. Different landing pages receive different traffic. All this and more information is laid out in the report.
- E-commerce - much like e-commerce from Google Analytics, the eCommerce report here is extremely detailed. It focuses on sales that are the direct results of paid advertising, so you can instantly see if your investment is paying off.
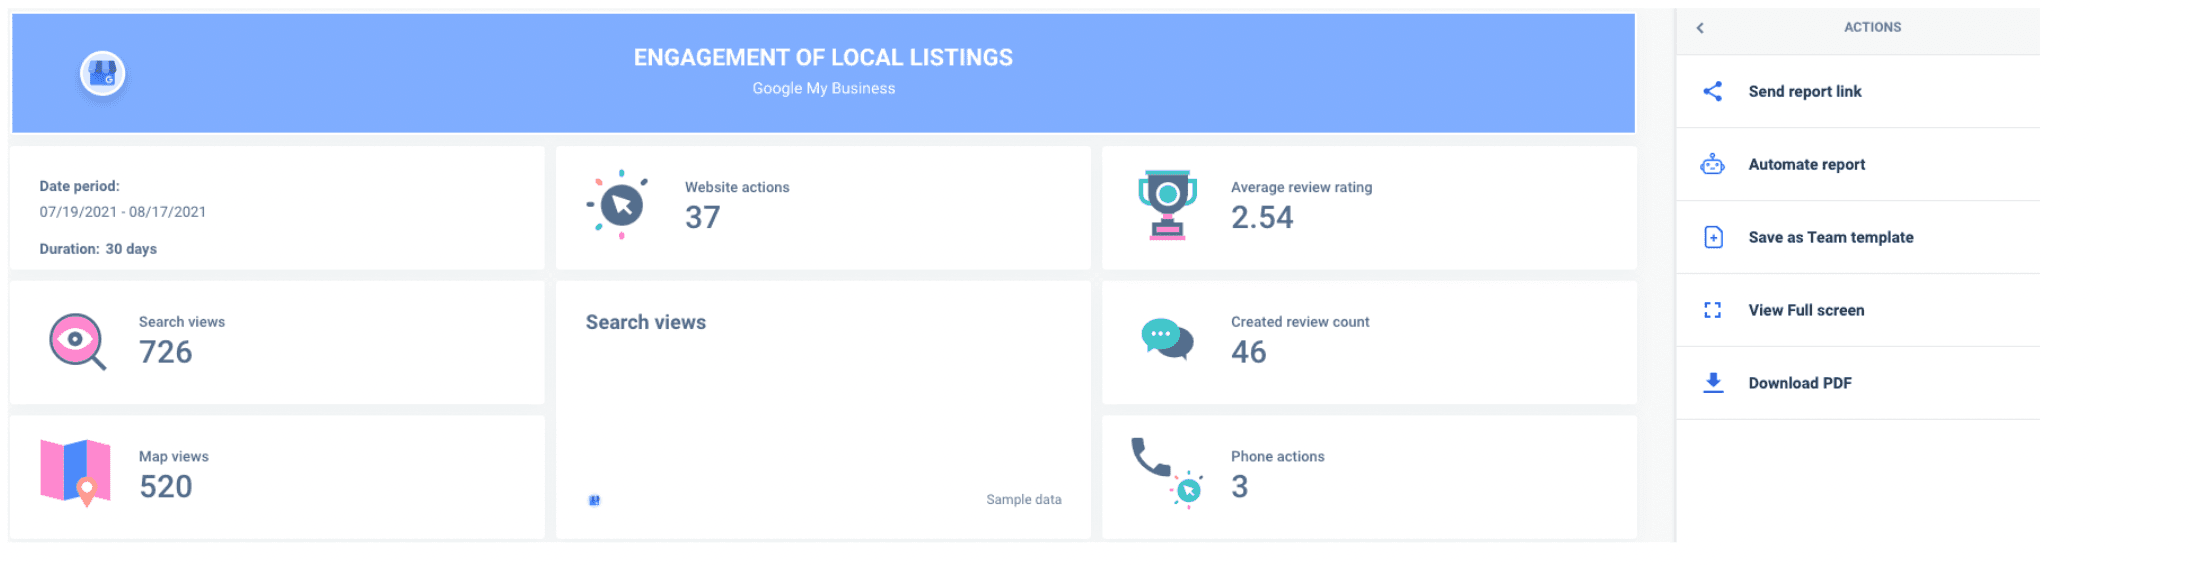
Google My Business - if your business operates locally, registering on Google My Business is imperative. This report provides information on your potential client interest in your business, as well as the experience they had with your service.
Google My Business channel can contain the following metrics:
- Local - the report provides information on how many times clients searched you, interactions they made, reviews and ratings they left, amount of queries, messages and the local funnel in general. It’s an excellent report for localized services.
What can you do with these reports?
Looking at numbers is valuable and can give you ideas of what needs improvement. But it’s also important to share these insights with your team or clients. Here’s how you can use these 1-minute reports once you built them:
- Generate a link and share it with your team or clients;
- Generate a PDF and send it;
- Save it as a template for your team to use;
- Set up an automated report to be delivered to the chosen recipients.
So many things you can do in so little time! Whatagraph is committed to increase your productivity and make analytics easy and accessible to everyone. Try out the Smart Builder yourself, and let us know how it went!
Published on Aug 30 2021
WRITTEN BY
Indrė Jankutė-CarmaciuIndrė is a copywriter at Whatagraph with extensive experience in search engine optimization and public relations. She holds a degree in International Relations, while her professional background includes different marketing and advertising niches. She manages to merge marketing strategy and public speaking while educating readers on how to automate their businesses.