


TL:DR
Looker Studio is a free data visualization and reporting tool for Google data sources and channels. A paid “pro” version is also available with additional admin and security features and service-level support.
Who it’s best for:
Solo marketers or small internal teams primarily using Google tools, who are comfortable with a fragmented reporting stack and manual data management.
Key features at a glance:
| Feature | Looker Studio |
| Integrations | 1,200+ data sources, but only 24 are Google-built and stable; the rest are third-party, often paid, and can be unreliable. |
| Stable connections? | Google connectors are stable, but partner and community connectors can be messy and break. |
| Ease of use | Busy interface with nested menus, "metric-first" drag-and-drop is unintuitive, and bulk editing/global themes are absent. |
| Data blending | Technically supported, but limited to 5 data sources per blend and prone to breaking with schema changes. |
| Internal dashboards | Strong for quick, disposable dashboards, especially with Google data; less suitable for long-term reporting operations. |
| Customizable reports | Highly customizable at widget and report levels, but controls are buried, and there's no central brand kit or one-click theme application. |
| Report sharing & automation | Standard options (link, embed, PDF, scheduled email) but automation is basic with no centralized control or advanced branding for emails. |
| Security | Shared responsibility model for data encryption; GDPR compliance requires manual setup per user; offers role-based access via Google Cloud IAM. Recent real-world security concerns with phishing scams leveraging Looker Studio. |
Pros ✅
- Genuinely free entry-level plan that does a lot for Google-centric users
- Deep integration with Google products like GA4, Google Ads, and BigQuery
- Easy data visualization, transforming raw data into clear reports
- Option for responsive layouts for dashboards
Cons ❌
- Slow performance and bugginess with large datasets or multiple blended sources
- Third-party connectors break often, making Looker Studio reports unreliable
- Data blending is limited to 5 data sources per blend
- Minimal direct customer support on the free tier; dedicated support is an extra paid service
- Lack of AI features for insights or report generation
Why You Can Trust This Review
At Whatagraph, we live and breathe marketing data every day, and we genuinely care about finding you a marketing reporting tool that will make your life easier—not harder.
This is why we went to great lengths to give you this review. Here’s what we did:
- Fact-checked against live docs: Pricing, feature limits, and security claims are captured straight from the vendor’s public pages.
- Hands-on sandboxing: We open a brand-new workspace, wire up the usual marketing stack (GA4, Instagram, etc.), then build multiple dashboards and reports from scratch.
- Tracked real-world user discussions: Recent, verified G2 and Capterra reviews, public forum threads, and help-center discussions are scanned for recurring themes—things that crop up more than once end up on our radar.
- Scored against agency must-haves: Finally, we grade the tool on integration breadth and stability, customization and white-labelling depth, automation reliability, everyday usability, and the quality of customer support.
Our goal is to help you make an informed decision, whether that leads you to Looker Studio, to Whatagraph, or to another solution entirely.
Looker Studio Pricing
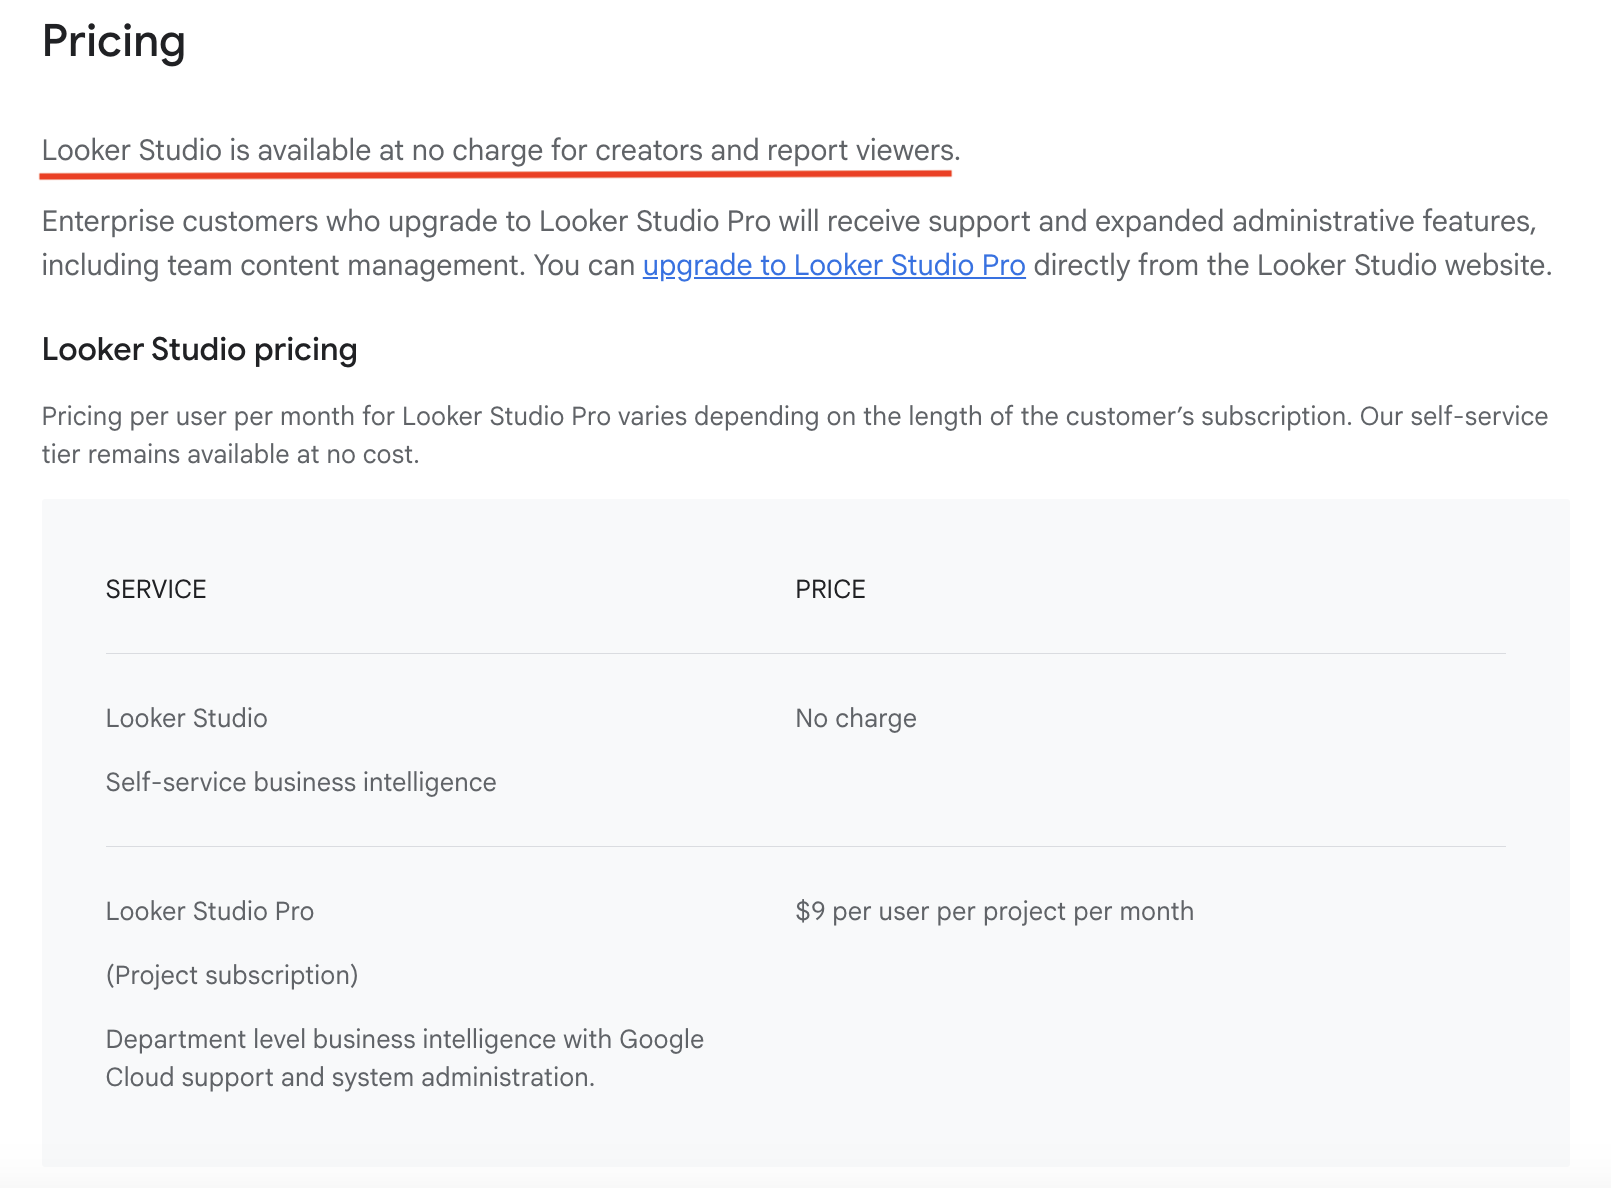
Looker Studio (formerly Google Data Studio) comes in two flavors: free, and not-so-free.
The base product—Looker Studio (Free)—costs nothing to use. You can create unlimited dashboards, plug into native Google tools (like GA4, Google Ads, BigQuery), and share reports across your team.
Then there’s Looker Studio Pro, priced at $9 per user, per project, per month. This adds admin features, service-level support, and permissioning for larger teams.
Still pretty affordable on paper.
But price-per-seat isn’t the full story. Especially for growing agencies.
Because while Looker Studio might be free, the tools that feed it aren’t.
Most agencies don’t rely on Looker alone. You’re probably pulling in marketing data from non-Google sources—like Semrush, SE Ranking, LinkedIn Ads, HubSpot, or AppsFlyer.
Those connections aren’t free. They require a third-party connector like Supermetrics or Funnel, each of which comes with its own monthly price tag.
And if you're warehousing data in Snowflake, BigQuery, or another cloud platform before it reaches Looker Studio—that adds another layer to your stack. And your bill.
Get a full breakdown of Looker Studio pricing in the article.
What does Looker Studio’s pricing mean for your budget?
- You need to calculate the total cost of ownership: Connectors, warehouses, and tool-switching aren’t free. They're recurring costs that scale with your client list.
- Your time has a cost too: With Looker Studio, the ELT process is your responsibility. You’ll spend time extracting and loading data, troubleshooting pipelines, and cleaning mismatched fields. Time that could be spent analyzing results or shipping strategy.
- Per-project pricing adds up: $9/user/project/month doesn’t sound like much, until you’re managing 12 clients and 40+ dashboards. At that point, your “free” reporting tool is one of your pricier line items.
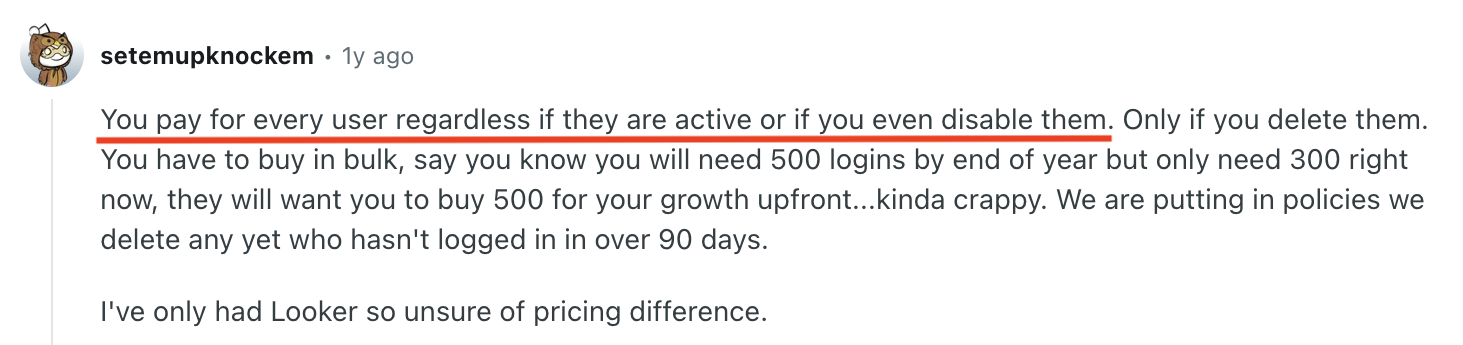
Heads up: You’re charged per user, not per active user. Even if someone hasn’t logged in for three months—or if you disable their access—you’re still paying for that seat unless you fully delete it. And if you plan to scale, Google may push for upfront commitments.
One Redditor in r/Looker shared that they were asked to pay for 500 user logins well before they actually needed them:
Real User Reviews: What are Customers Saying About Looker Studio?
I parsed threads on Reddit, conversations on X, posts on Instagram, reviews on YouTube and corroborated them with trusted reviews sites like G2, Capterra, and TrustRadius to bring you the freshest, most relevant discussions about Looker Studio.
Across these Google Data Studio reviews, I noticed a clear pattern: if you’re using Looker Studio primarily with native Google integrations, you’ll have a great time. Approximately 90% of users who stay within the Google ecosystem are full of praise. Everything just works.
But the moment you step outside that comfy Google sandbox, things get choppy.
This split—between users who stay comfortably inside the ecosystem and those who step outside of it—is the real story behind Looker Studio’s reviews.
Let’s break it down.
Looker Studio pros: What users love
✅ Deep Google integration
Looker Studio lives within the Google ecosystem, so if you’re pulling in data from Google Sheets, Google Analytics, and Google Ads, this tight connection combined with the “free” siren call is irresistible.
For example, Rahul K. on G2 says: “Data Template currently I'm using the GA4 Template and Google webmaster.”
And he’s happy. No notes.
✅ Easy data visualization
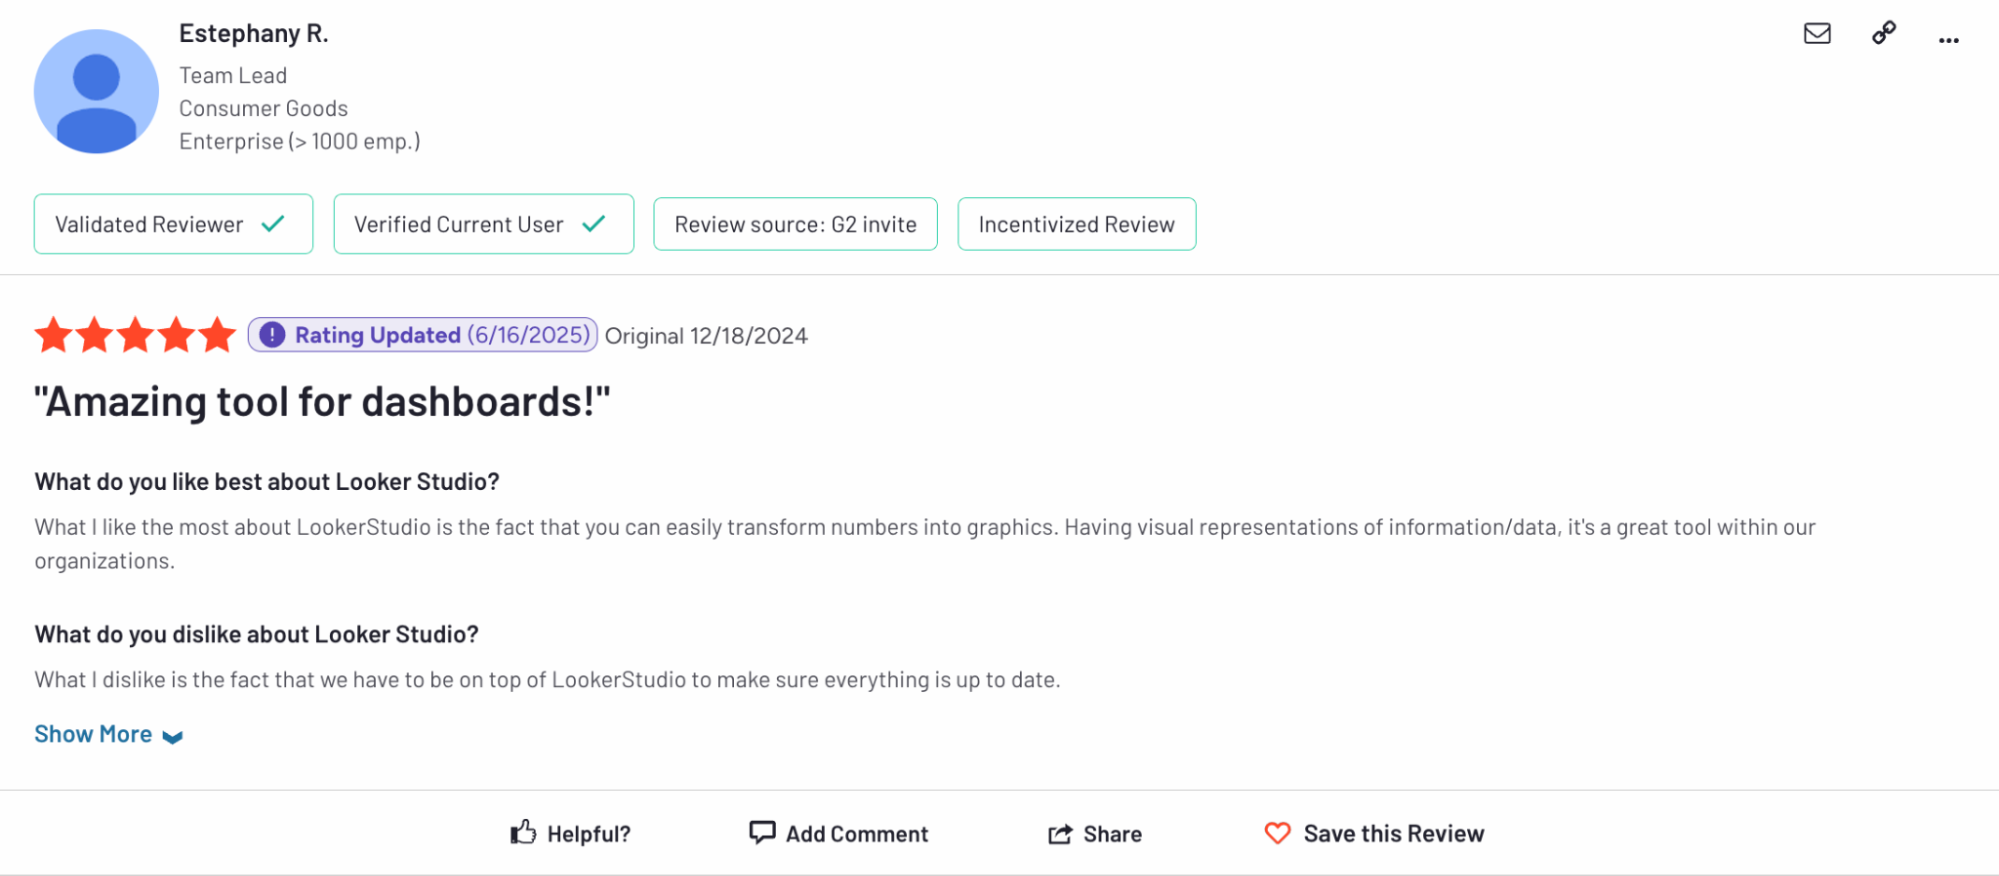
For many users, the top benefit is visual clarity. Looker Studio helps them turn raw data into clean, readable reports.
Estephany R. on G2 likes Looker Studio for this exact reason: “...you can easily transform numbers into graphics.”
✅ Genuinely free (to a point)
The entry-level plan does a lot—for nothing. For solo marketers and small internal teams using mostly Google tools, it covers the core needs without adding another subscription to the stack.
A small business owner, Luis, says on Capterra: “You can create really powerful and complete dashboards totally for free.”
Looker Studio cons: Where users get frustrated
❌ Performance isn’t reliable at scale
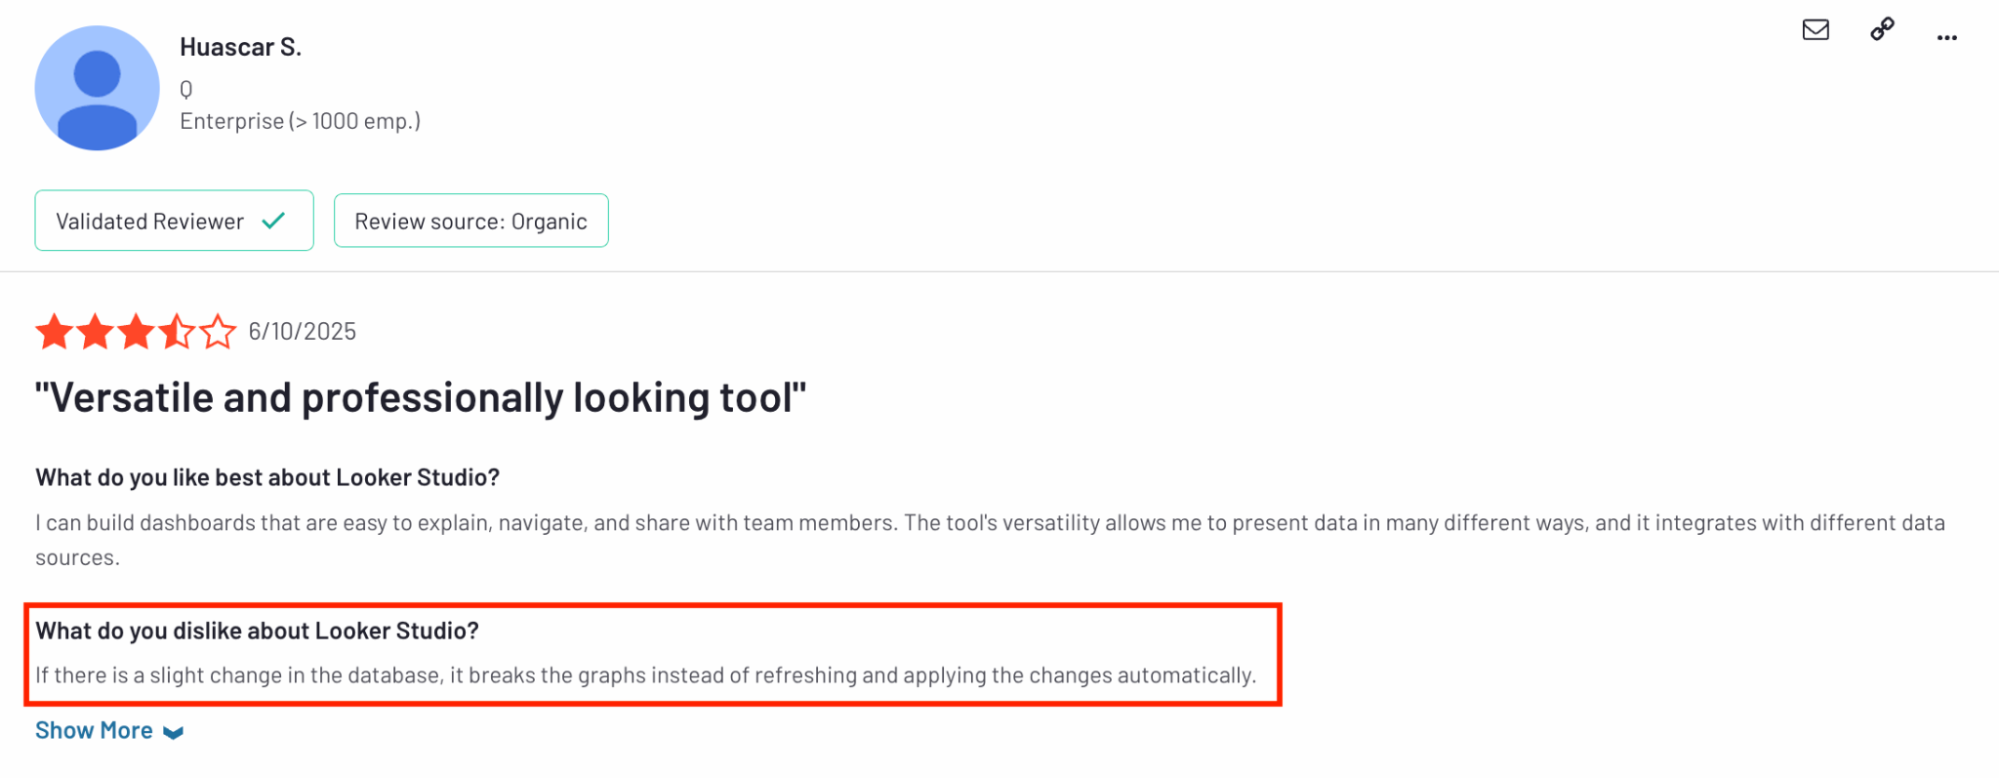
The most common complaints are slow dashboard load times, broken visualizations after small database changes, and overall bugginess with large datasets.
Of the 13 reviews on G2 in 2025, 5 of them flagged performance issues. That’s 38% of real users with the same Looker Studio complaint.
Here’s one by Huascar S.:
And Ashok S. says: “Performance issues with large Dataset such as loading dashboard.”
These bugs hit hardest when you're working with complex data flows or multi-source dashboards—exactly the kind of reporting your stakeholders rely on.
The Whatagraph advantage: We’re pretty proud of our 99.5% rock-solid uptime guarantee. If something does break, a Bat-signal goes out to our Product Engineers wherever they are, even if it’s midnight. For reliable real-time reporting on a platform that doesn’t work against you, we’re it.
❌ Not suitable for long-term reporting operations
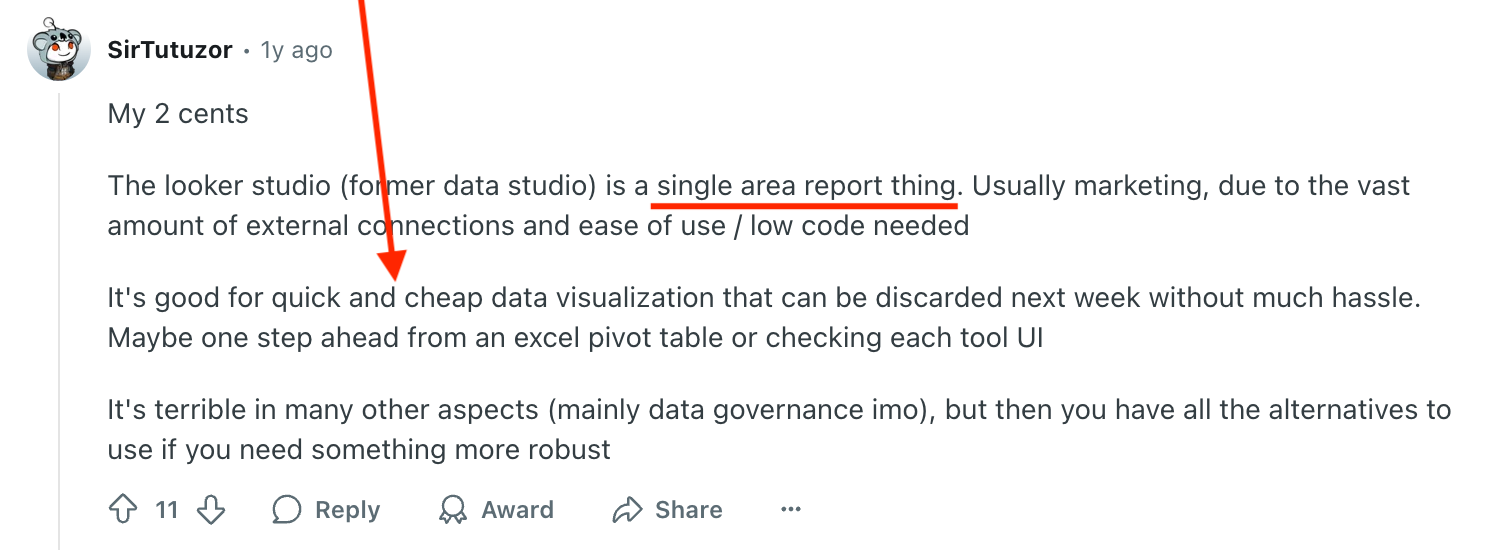
Looker Studio is solid for quick, disposable dashboards, especially in marketing teams that need low-code speed and fast visual output. But that’s also the very problem: it’s not built for long-term reporting maturity.
This is what a Redditor said in r/BusinessIntelligence:
“It's good for quick and cheap data visualization that can be discarded next week without much hassle…It's terrible in many other aspects (mainly data governance imo).”
❌ Too many workaround for basic tasks
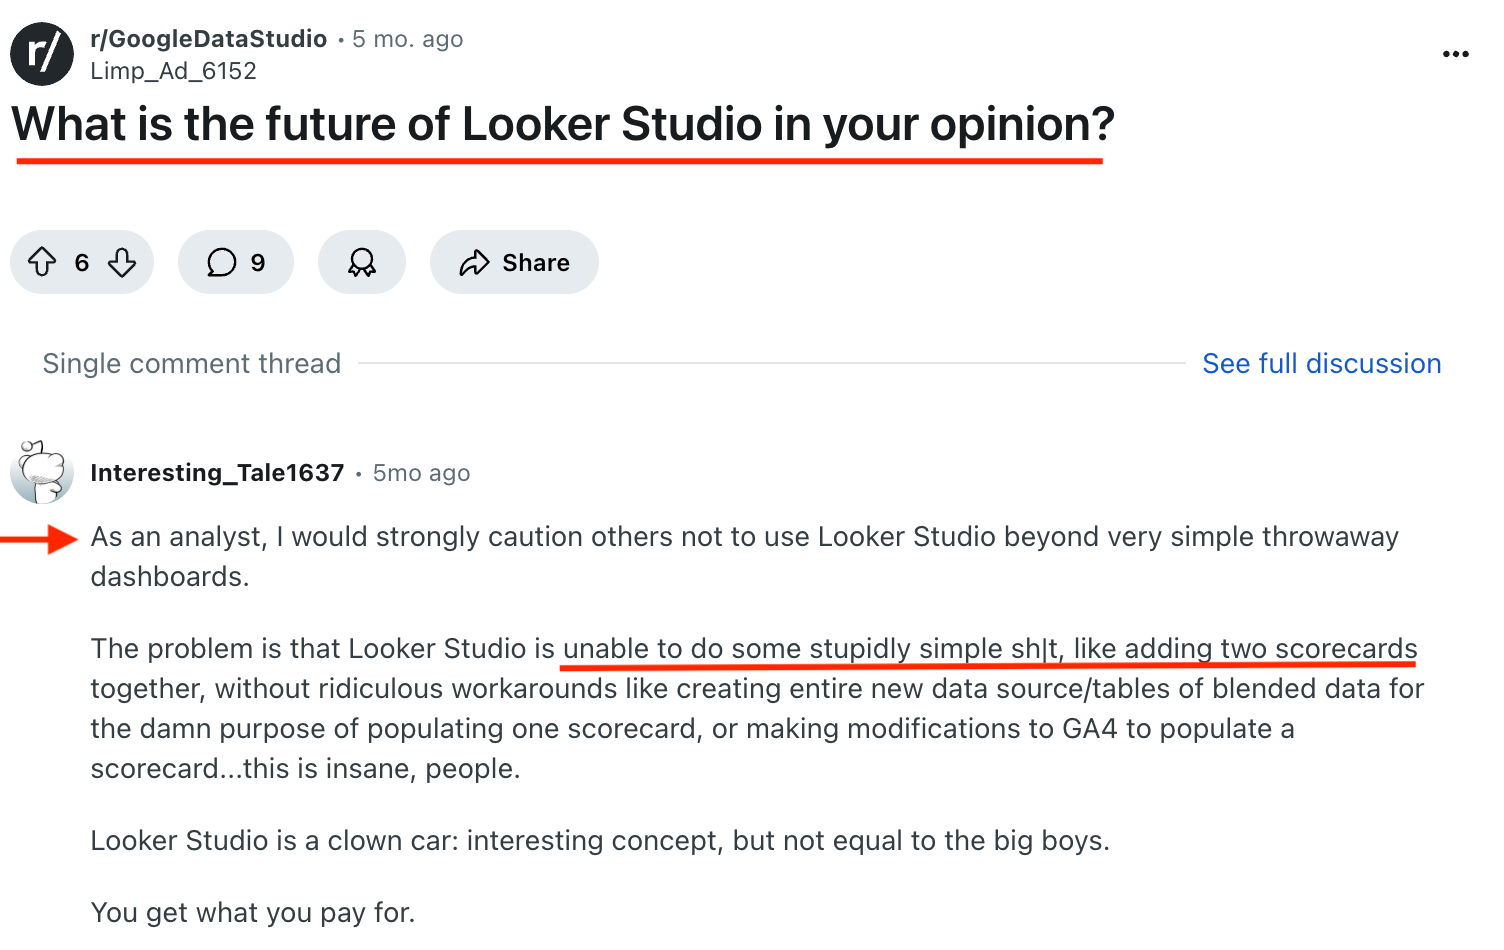
Looker Studio often fails at basic tasks. And this is the exact problem I keep seeing in reviews from users who are operating at scale.
This Reddit review comes from a data analyst in r/GoogleDataStudio to the question: “What is the future of Looker Studio in your opinion?”
“The problem is that Looker Studio is unable to do some stupidly simple sh|t, like adding two scorecards together, without ridiculous workarounds…Looker Studio is a clown car: interesting concept, but not equal to the big boys.”
That’s why many scaling agencies eventually “graduate” from Looker Studio to Whatagraph.
When the workarounds pile up, and dashboards start eating into billable hours, switching to an all-in-one platform like Whatagraph just makes sense.
These are the signs you’ve outgrown Looker Studio.
Feature Deep Dive #1: Looker Studio Integrations
For agencies, integrations are where deals are won or lost. You’re pulling in data from dozens of platforms, sometimes across 10 or 20 clients. That means every connector needs to be stable, fast, and cost-effective.
So, how does Looker Studio actually handle data connections in the wild?
How many out-of-the-box integrations are there?
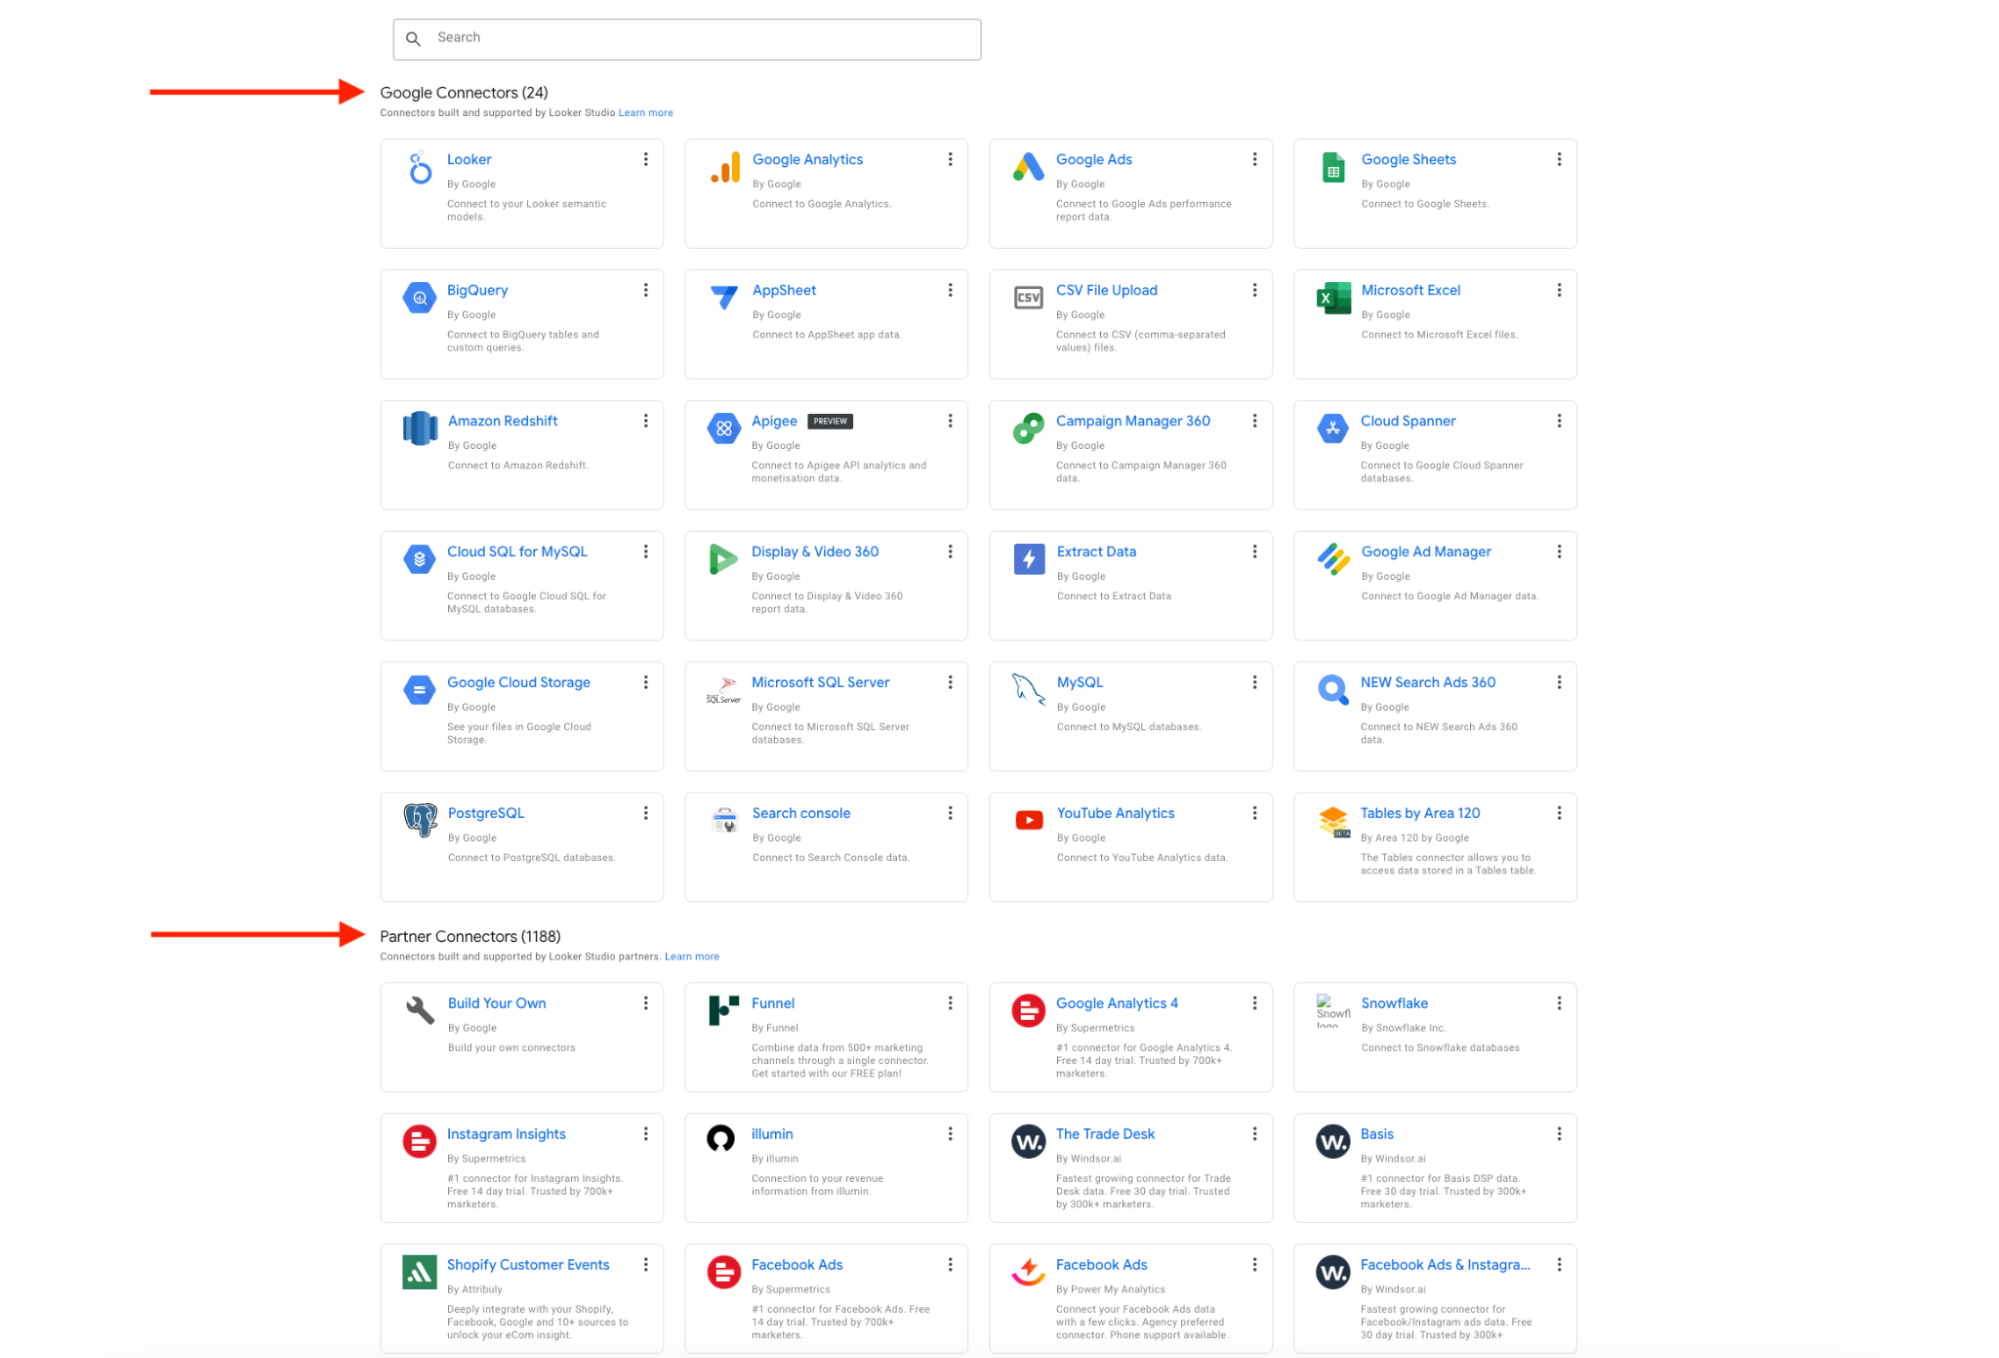
Looker Studio supports a huge number of data sources.1,212 to be exact.
But the breakdown of the data connectors matters:
- 24 are Google Connectors: Built and maintained by Google. These include GA4, Google Ads, Sheets, BigQuery, and other first-party tools. These are fast, stable, and free.
- 1,188 are Partner Connectors: Built by third-party vendors like Supermetrics, Funnel, Windsor.ai, and more. These cover platforms like Shopify, Facebook Ads, LinkedIn, Snowflake, and others—and most of them aren’t free.
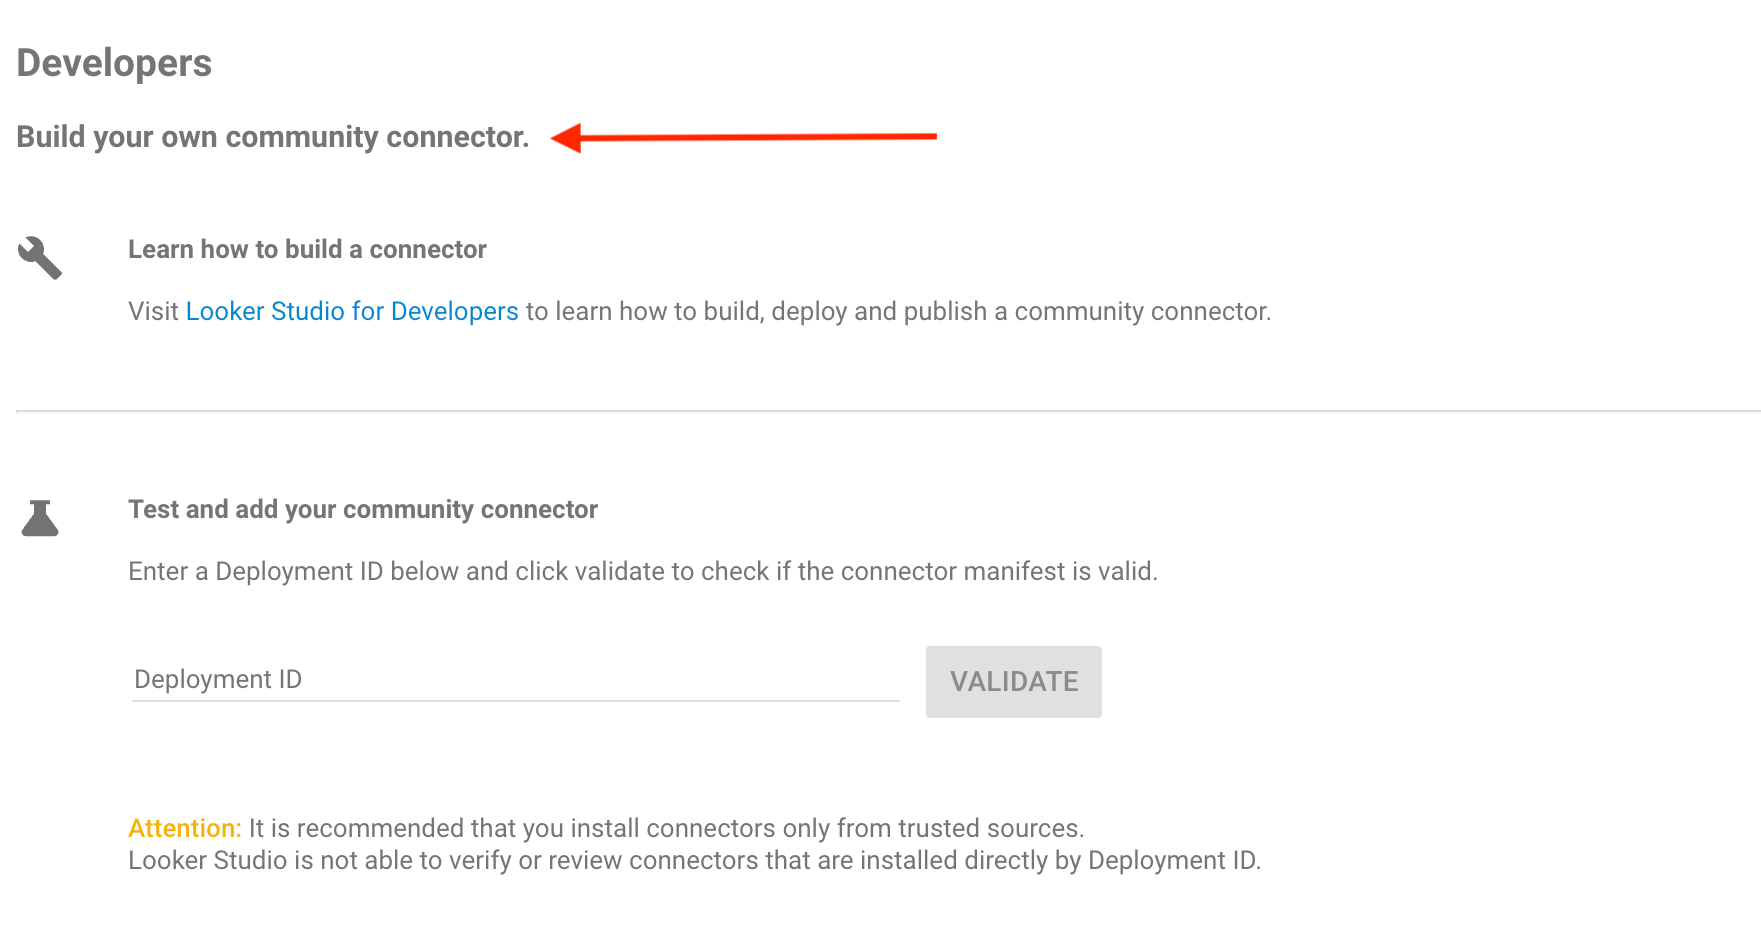
You can build your own or use open-source ones published by others. This adds flexibility, but it’s not plug-and-play. You’ll need technical expertise, API familiarity, and time to maintain it.
And as I’ve said before, anything outside of the Google ecosystem, and you’re suddenly wrangling with the price tag.
“What I like least is that for platforms external to Google, it is often necessary to have independent payment connectors.” — Raul S. on G2
How reliable are these connections day-to-day?
If you're using Google products, you're fine.
If you're not, prepare for some duct tape.
- Google connectors are stable: GA4, Google Ads, Sheets—they stay connected, auto-refresh, and rarely cause issues.
- Partner connectors are where things get messy: Built by third parties like Supermetrics or Funnel, they can drop data, expire tokens, or break when APIs change.
- Community connectors are flexible but fragile: Great in theory. Sketchy in production. If the dev who built it doesn’t maintain it, you’re on your own.
What about data blending across multiple platforms?
Looker Studio technically supports blended data sources. But it’s fragile and fussy.
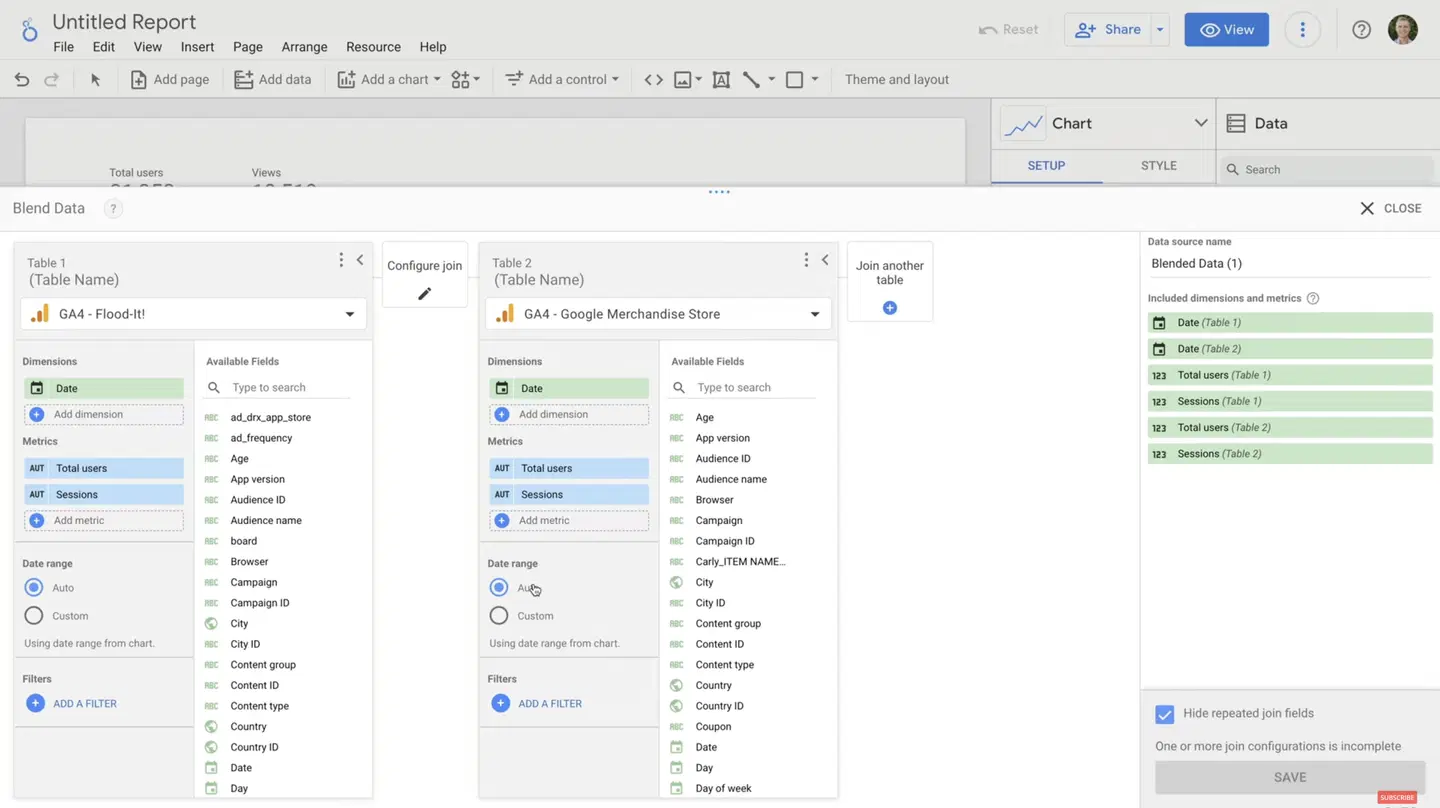 The process in the screenshot is an example of how data blending works in Looker Studio, but in truth, it breaks easily:
- You’re limited to 5 data sources per blend.
- If join keys are mismatched or missing, you’ll get empty charts, with no helpful error message.
- And if the schema changes upstream (say, a renamed column in Google Sheets or BigQuery), your entire blend can fail silently.
It’s a lot of manual setup for something that should just work.
But an all-in-one automated reporting platform like Whatagraph doesn’t limit your real-time data blends.
- In Whatagraph, you can mix Facebook Ads, Google Ads, email, SEO—you name it—and it just works.
- Looker Studio gets glitchy with two data sources. Whatagraph handles 50+ with fast load times, even on big reports packed with widgets and cross-platform graphs.
- Build a blend once, use it across every client report. You can edit formulas, tweak dimensions, and your team doesn’t need to bug a developer every time.
Get our full guide to faster, more user-friendly data blending here.
Integrations work great if you stick to Google. Risky if you don’t. Only 24 connectors are stable, free, and built by Google. The other 1,188 are third-party, often paid, and not always reliable. For agencies, that’s a lot of duct tape.
Feature Deep Dive #2: Looker Studio Ease of Use
Agencies need “user-friendly,” but they also need time-friendly tools that scale.
Let’s see if Looker Studio delivers.
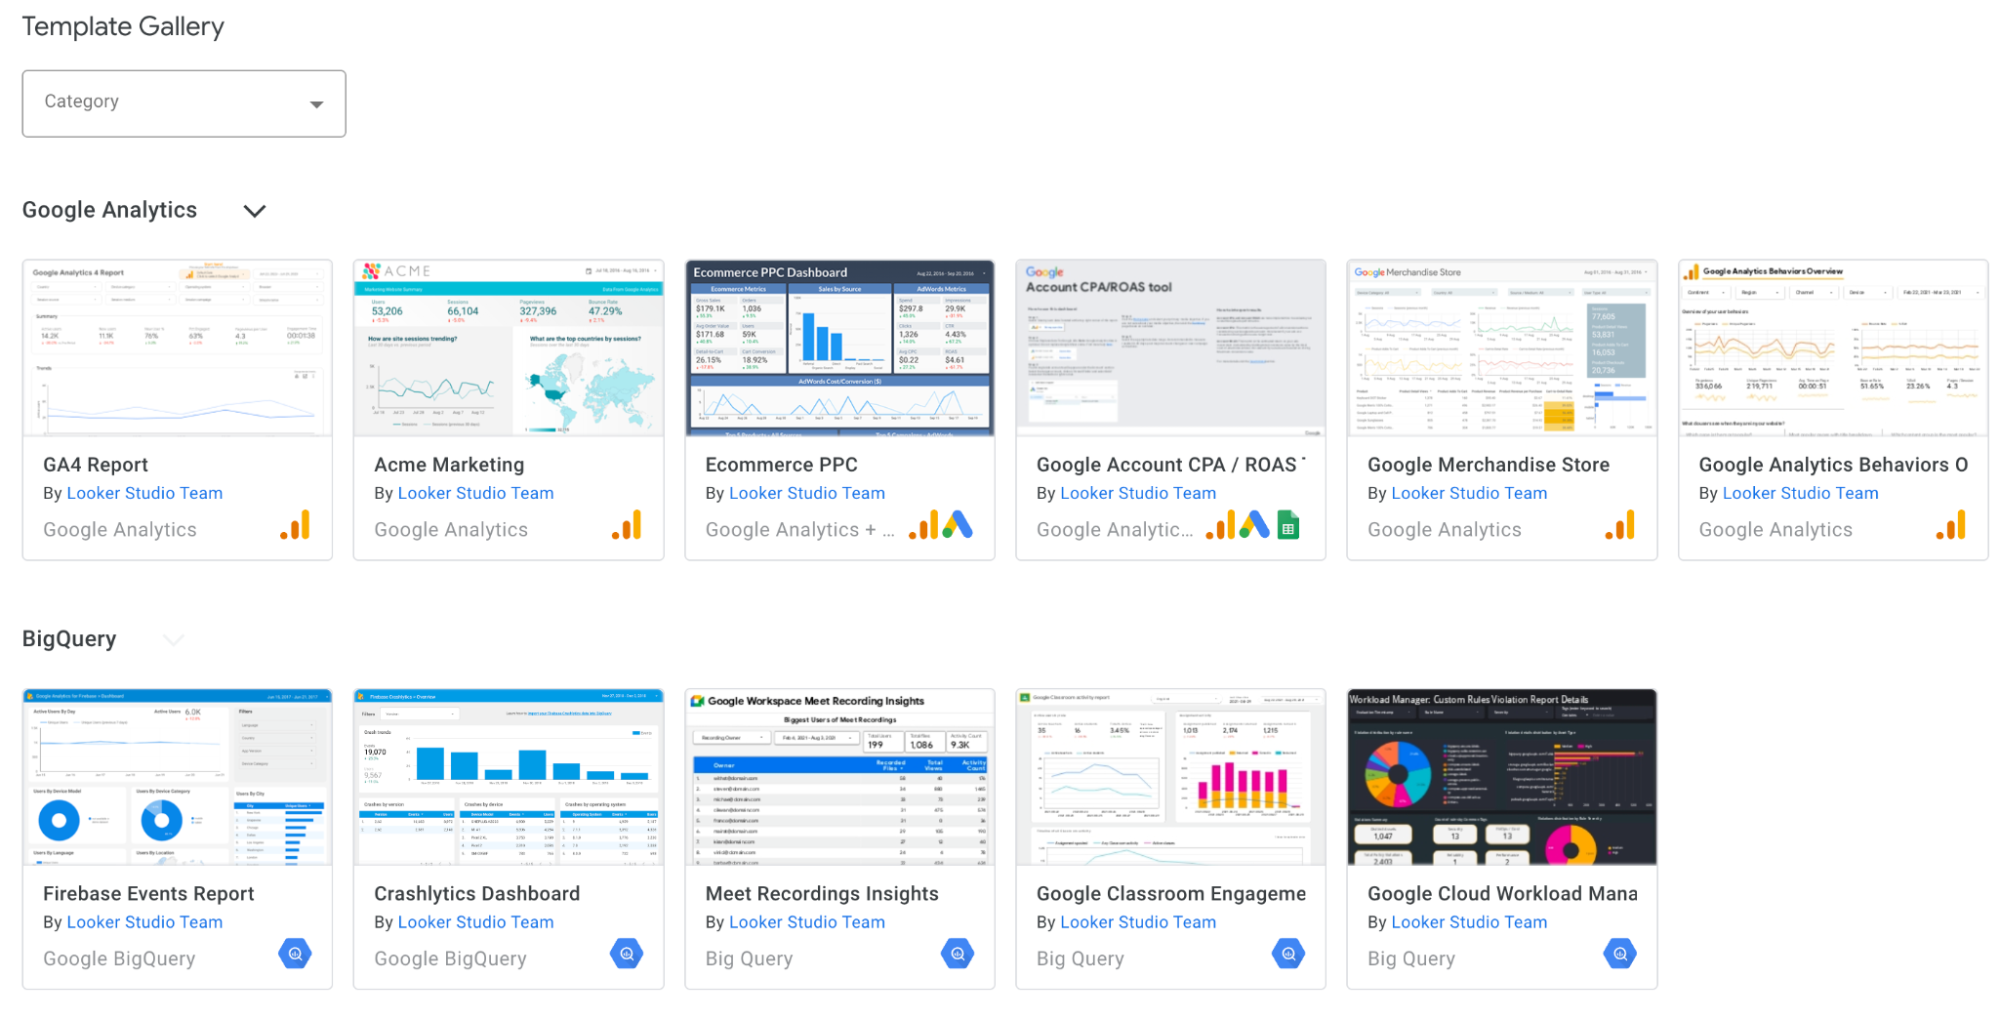
Are there ready-to-use templates and drag-and-drop features?
Yes—28 templates across 9 categories, covering basics like Google Analytics, BigQuery, YouTube Analytics, etc. They’re fine for internal reporting, but you’ll likely need to rework them for client-facing use, especially if you care about branding, layout, or specific KPIs and metrics.
 The drag-and-drop model in Looker Studio is metric-first, not visual-first, which makes building reports feel unintuitive.
- You start by dragging in metrics or dimensions from the data panel.
- But once they’re on the canvas, you still need to manually click “Add a chart,” pick a chart type, and configure it from scratch.
And customization options are buried under tabs that shift based on what you’ve selected.
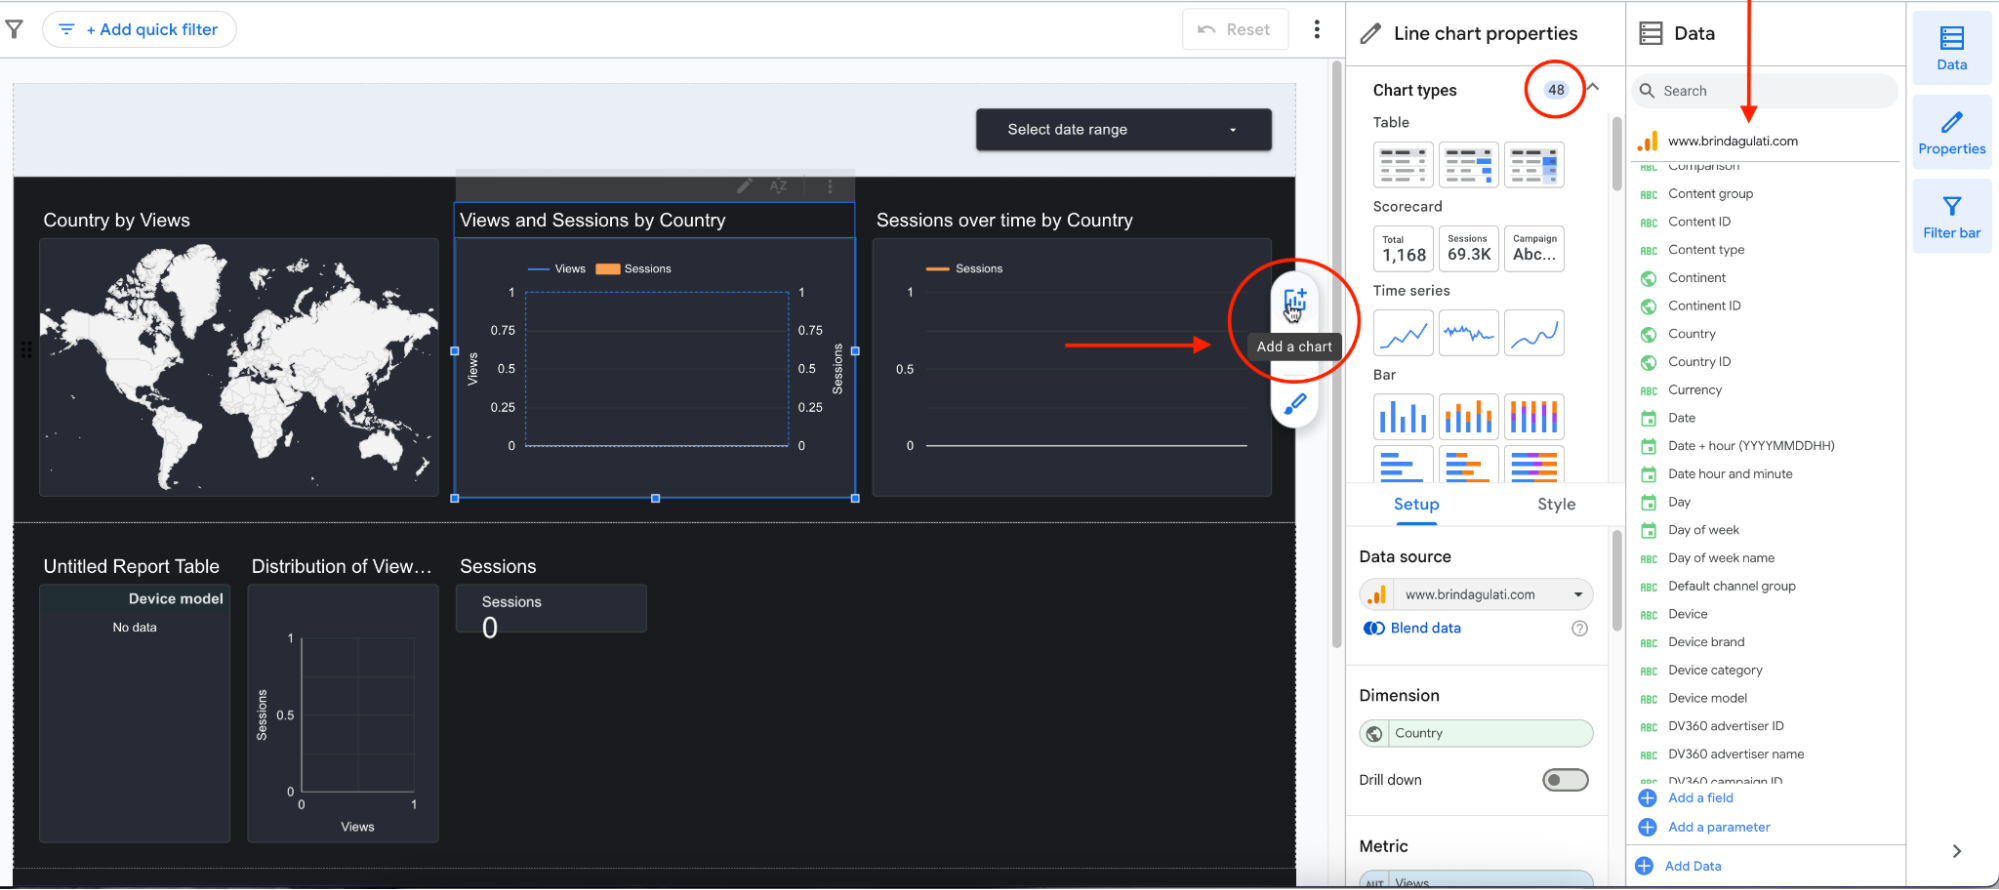
It’s drag-and-drop—but only halfway.
The interface is useful, yes. But it’s so busy and packed with nested menus that even someone like me who’s familiar with most marketing reporting platforms, needs to sit with the documentation to use Looker Studio to its full potential.
Now compare that to Whatagraph:
You drag in a full widget—not just the data. It snaps to a clean grid, fills in the right metrics automatically, and can be edited later with a single click.
Fun fact: The first time I built a report in Whatagraph, it took me exactly 12 minutes. In Looker Studio, it took me 47 minutes: from connecting the data and authorising it to watching tutorials on YouTube on how to actually fully customize the report.
How easy and fast is editing dozens of reports?
Short answer: it’s not fast at all.
Looker Studio doesn’t have bulk editing, global themes, or any way to make one change and push it across multiple dashboards.
If you manage 10+ client reports and need to update a logo, tweak a layout, or fix a data source, you’ll be doing it manually. One click, one filter, one widget at a time.
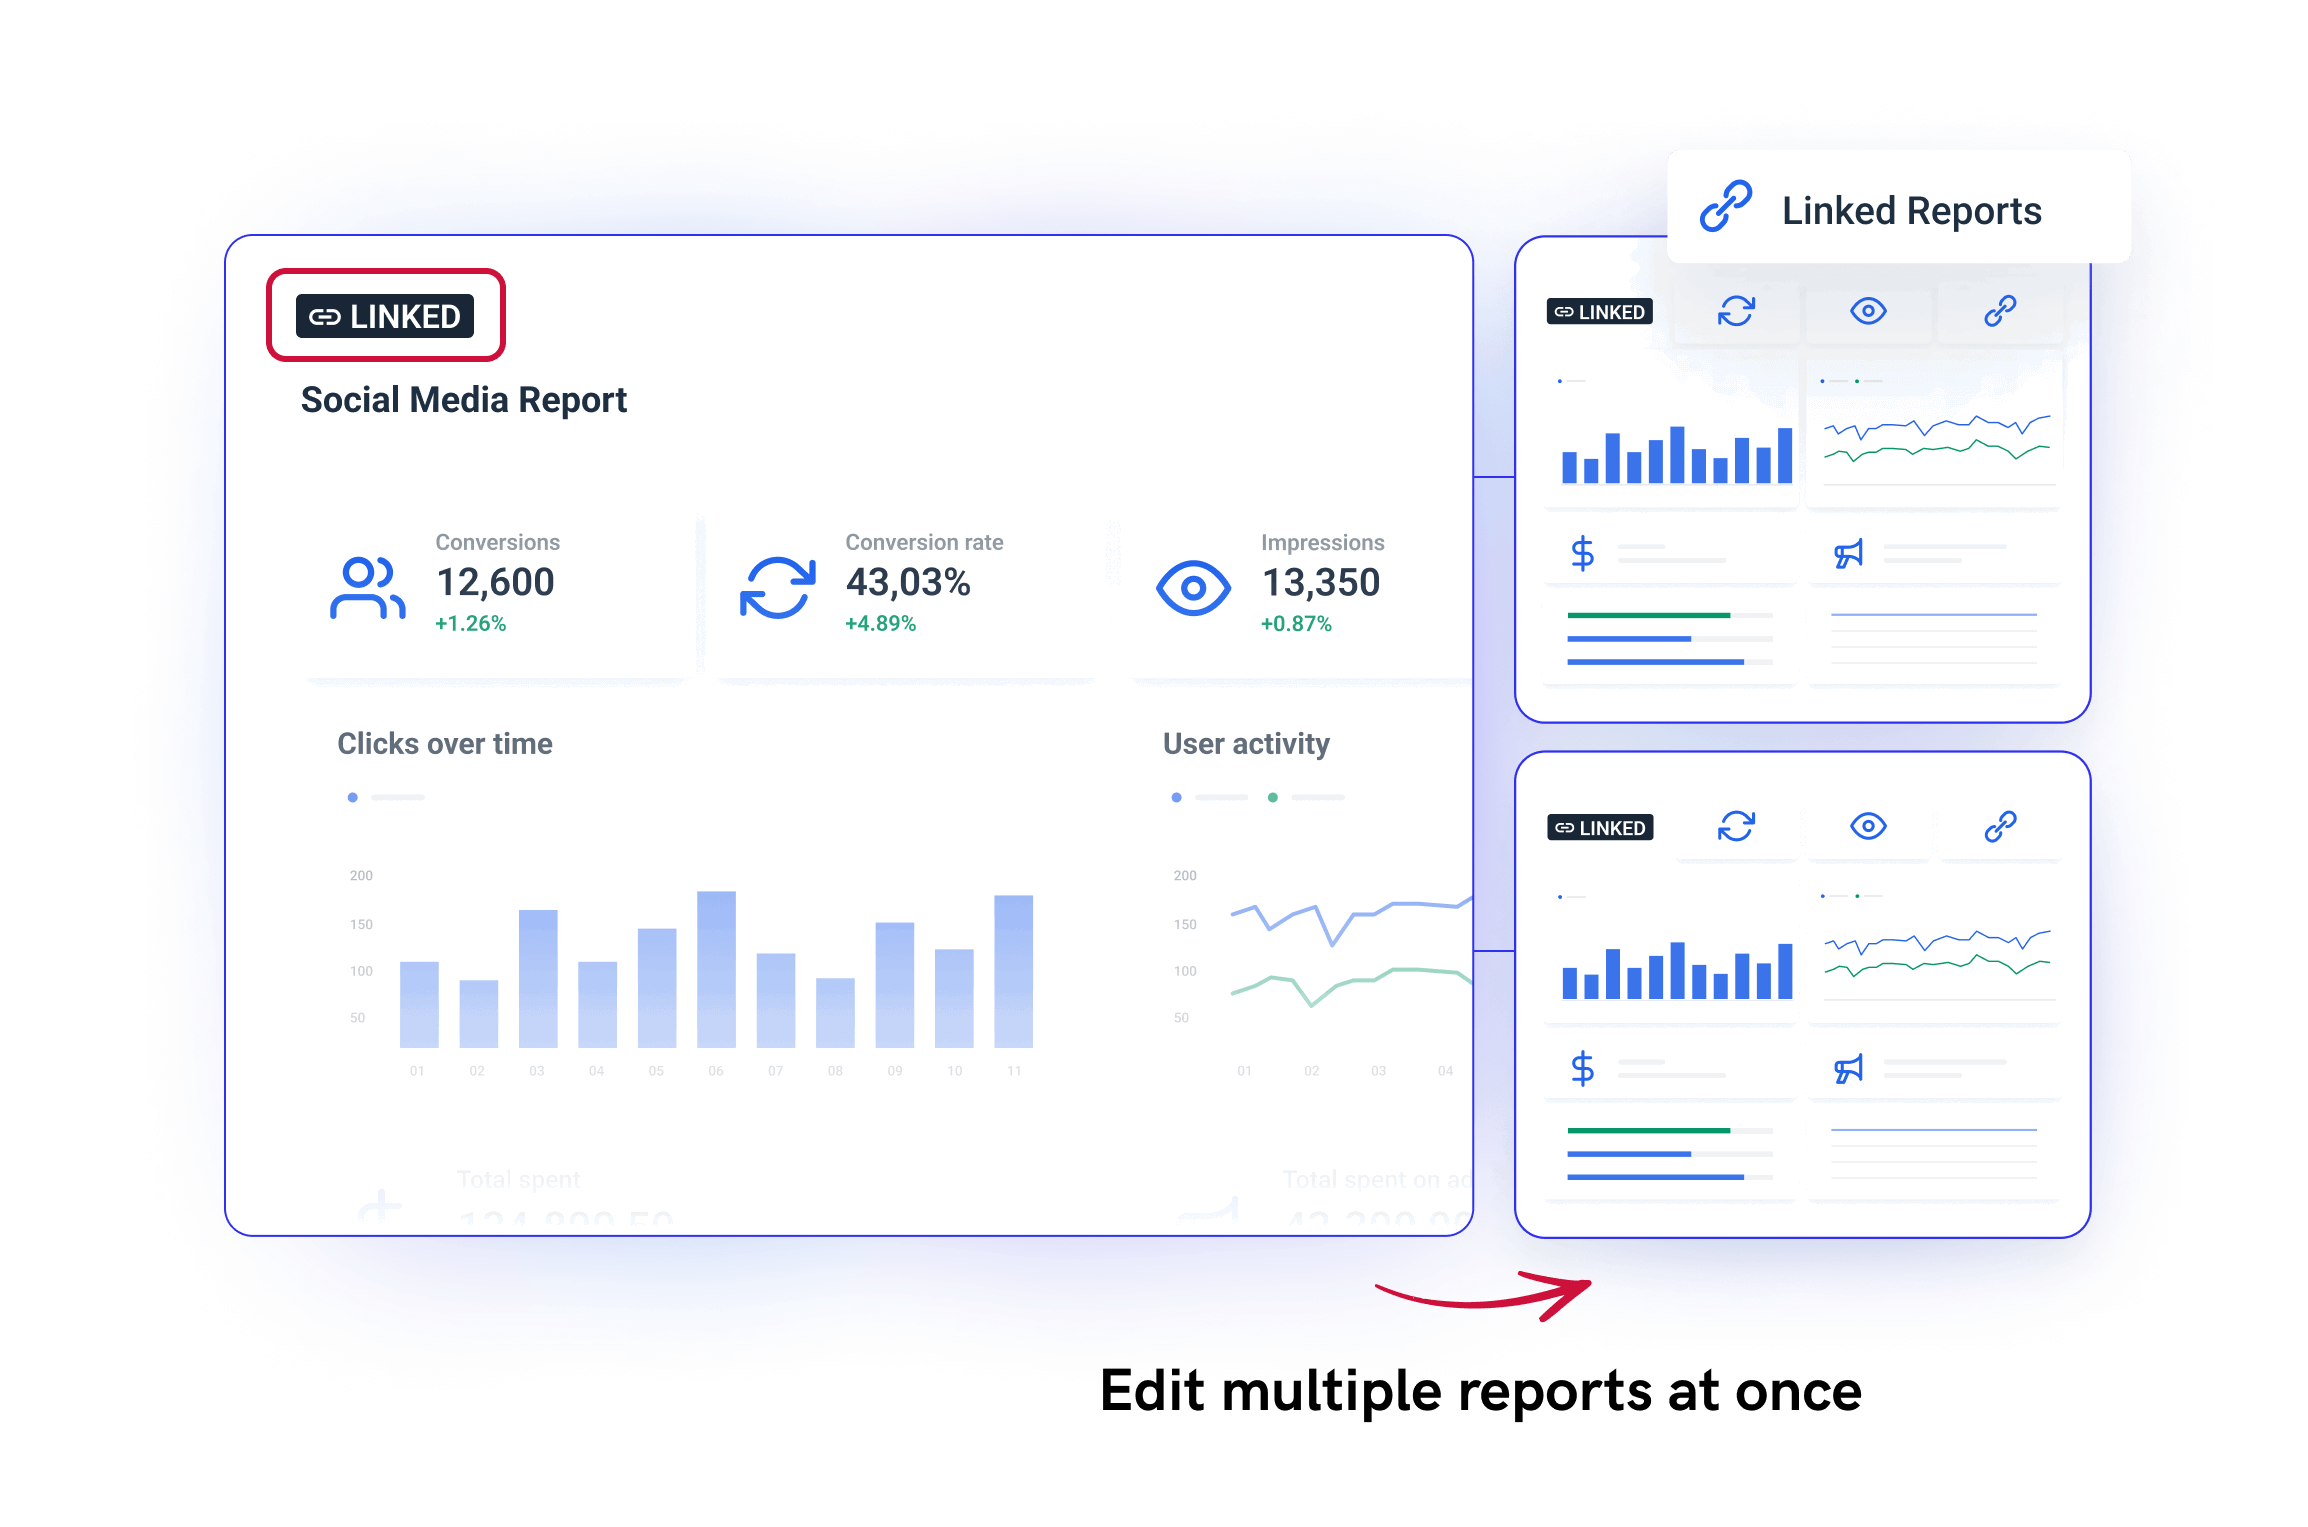
Whatagraph solves this problem head-on with linked report templates. You make a change in the master report—whether it’s a logo update, layout tweak, or new metric—and it instantly reflects across every linked client dashboard.
One update really does mean one update. See how:
Looker Studio can do a lot; but not quickly or easily. The interface is busy, templates are basic, and drag-and-drop is only half-baked. Building a report takes time, and editing multiple reports is entirely manual. There’s no way to push updates across dashboards.
Feature Deep Dive #3: Looker Studio Reports and Dashboards
This is where data takes shape. Looker Studio's core strength lies here. But how well does it serve the relentless demands of an agency?
How are reports built (templates vs. custom)?
You get both. There are 28 starter templates, mostly geared toward Google tools like GA4, Ads, YouTube, and Search Console.
They’re a decent starting point for internal use, but not agency-ready out of the box. You’ll end up customizing layouts, replacing default metrics, and tweaking the visuals anyway.
If you’re building from scratch, be prepared to go slow. Looker Studio’s metric-first approach means you add the data first, then manually layer in the charts and style them. It works—but it’s not fluid.
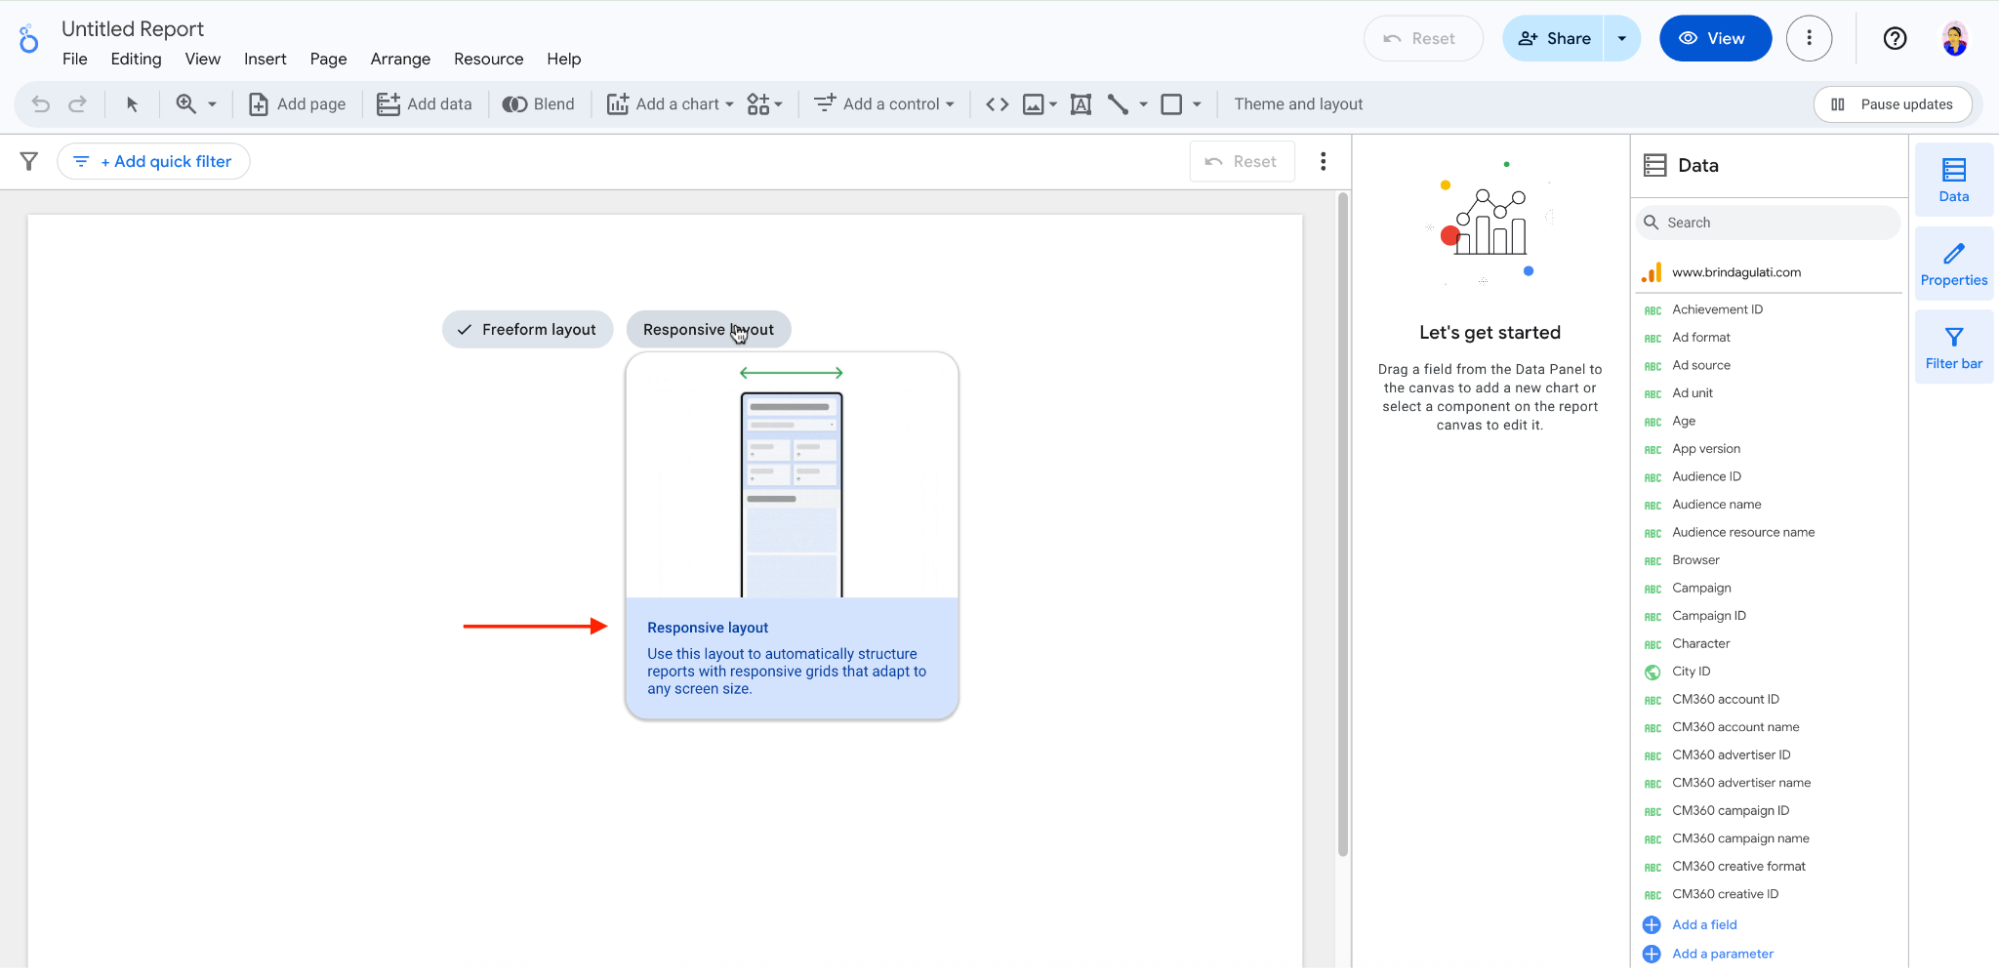
I will say however, that they have a pretty nifty feature when you start designing from scratch—the option to choose a “Responsive layout” that can adapt to any screen size.
What can you actually customize?
A lot, technically. But that’s the thing—it’s technical.
At the widget level, you can change fonts, font size, font color, background, borders, border radius, header styling, and more. You can tweak the chart palette, adjust positive/negative data colors, and even improve accessibility with high-contrast settings.
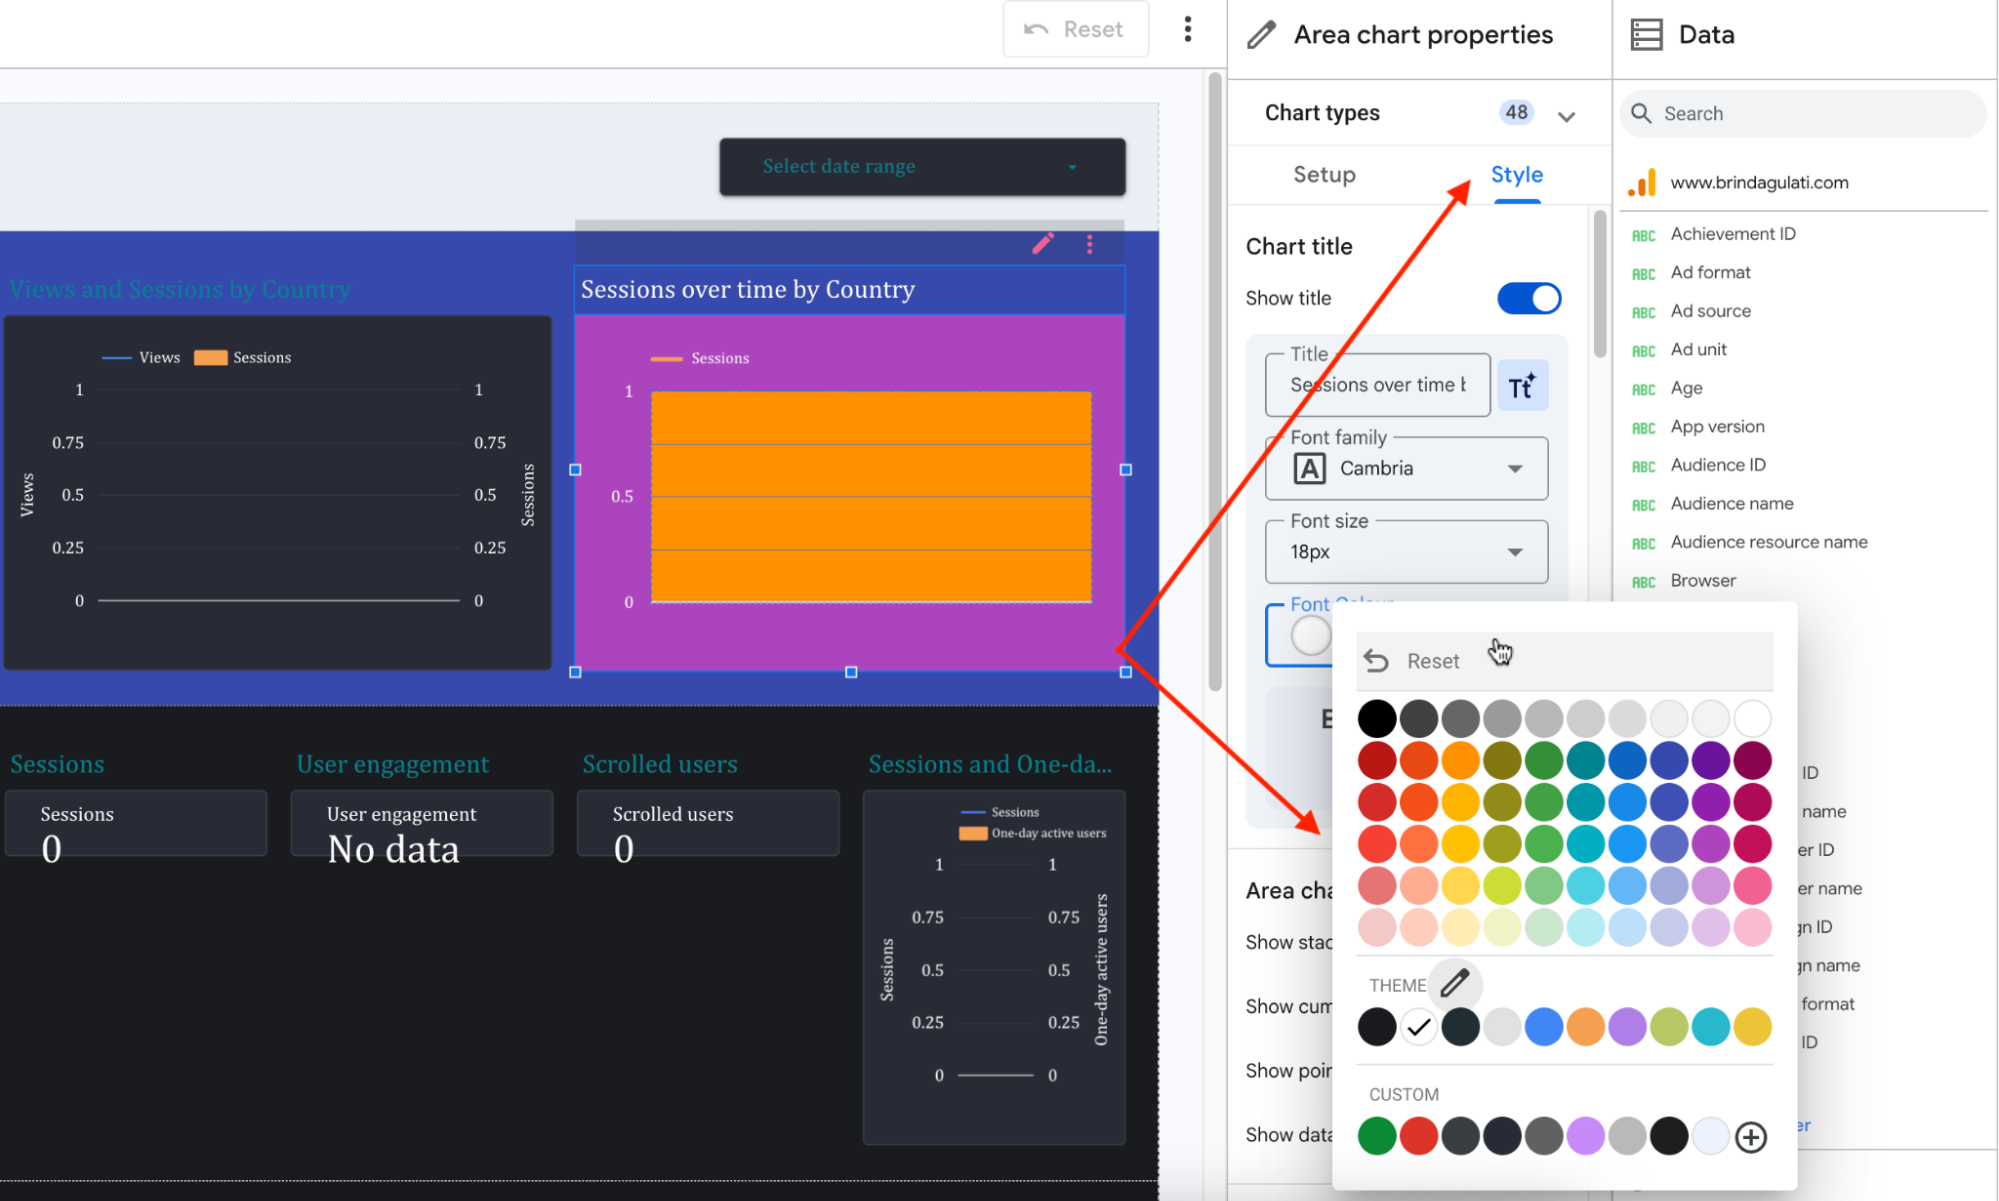
At the report level, you can customize the report’s overall theme—fonts, colors, chart styles, accent shades, even layout options.
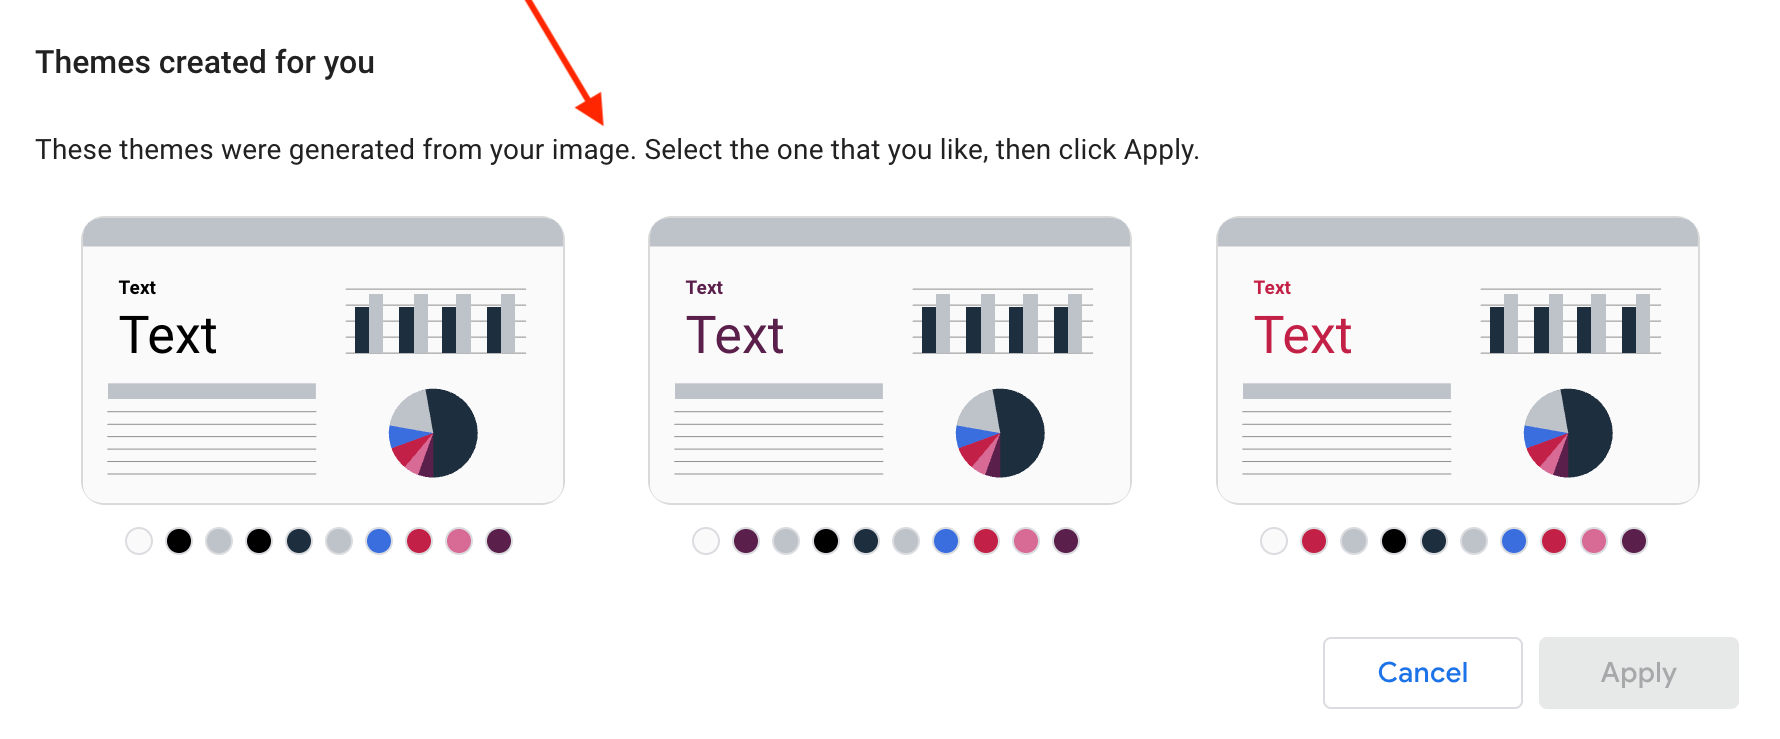
I uploaded an image to Looker Studio and there’s an option to extract a theme and apply it to the overall report, which is a small win.
So yes, the controls are there. But they’re buried in menus, scattered across sections, and nowhere near reusable at scale.
- There’s no central brand kit upload.
- No one-click way to apply a consistent theme across reports.
- Adding something as simple as adding your company logo is weirdly hard to find.
- And doing this across 10+ clients is a full-time job.
The Whatagraph advantage: Branding is baked in—at the team, report, and widget level. You can apply a global theme, customize individual dashboards, and fine-tune components without repeating yourself.
You can even use a custom domain, so your automated reports land in client inboxes looking like they came directly from your agency—not from whatagraph.com.
But let's go even a step further.
Now, you won't even need to do all this customization yourself. AI will do it automatically for you. All you need to is:
- Open a report.
- Upload a brand book screenshot or type a quick prompt.
And AI will automatically detect the fonts and colors and apply them instantly across the whole report.
You can tweak the results manually, or just hit send. Either way, you get a fully branded report in literal seconds.
This is the Whatagraph way. See how it works:
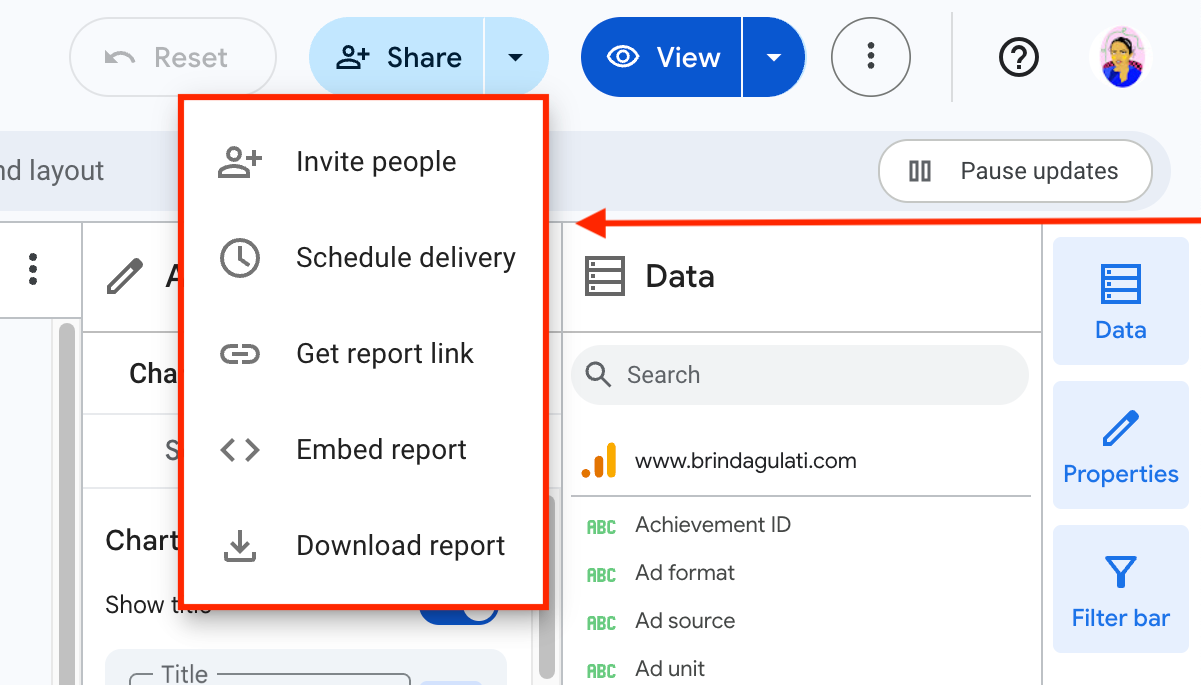
What are your sharing options (and how automated/efficient are they)?
Looker Studio gives you the standard options:
- Share a public or restricted link.
- Embed the report in a webpage.
- Download it as a PDF.
- Schedule email delivery on a recurring cadence.
 The email scheduler works…about the same way scheduling an email in Gmail does.
You pick your recipients, choose a time, and the report gets sent as a static PDF. That’s about as far as the automation functionality goes. There’s no centralized control panel for managing delivery across multiple clients. No ability to customize the sender name, brand the email, or track who’s opened what.
And if you want to change the schedule or fix a data issue before the next send, you’re clicking through reports one by one.
So, what’s automation like in Whatagraph?
In Whatagraph, automation is set it, check it (if you want), and then forget it.
Here’s how it works:
You choose a standard time range (no custom filters), hit “Automate,” and then pick your frequency, day, time, and time zone.
From there, you have two options:
- Send automatically: No review needed.
- Review before sending: If you want to double-check numbers or add commentary.
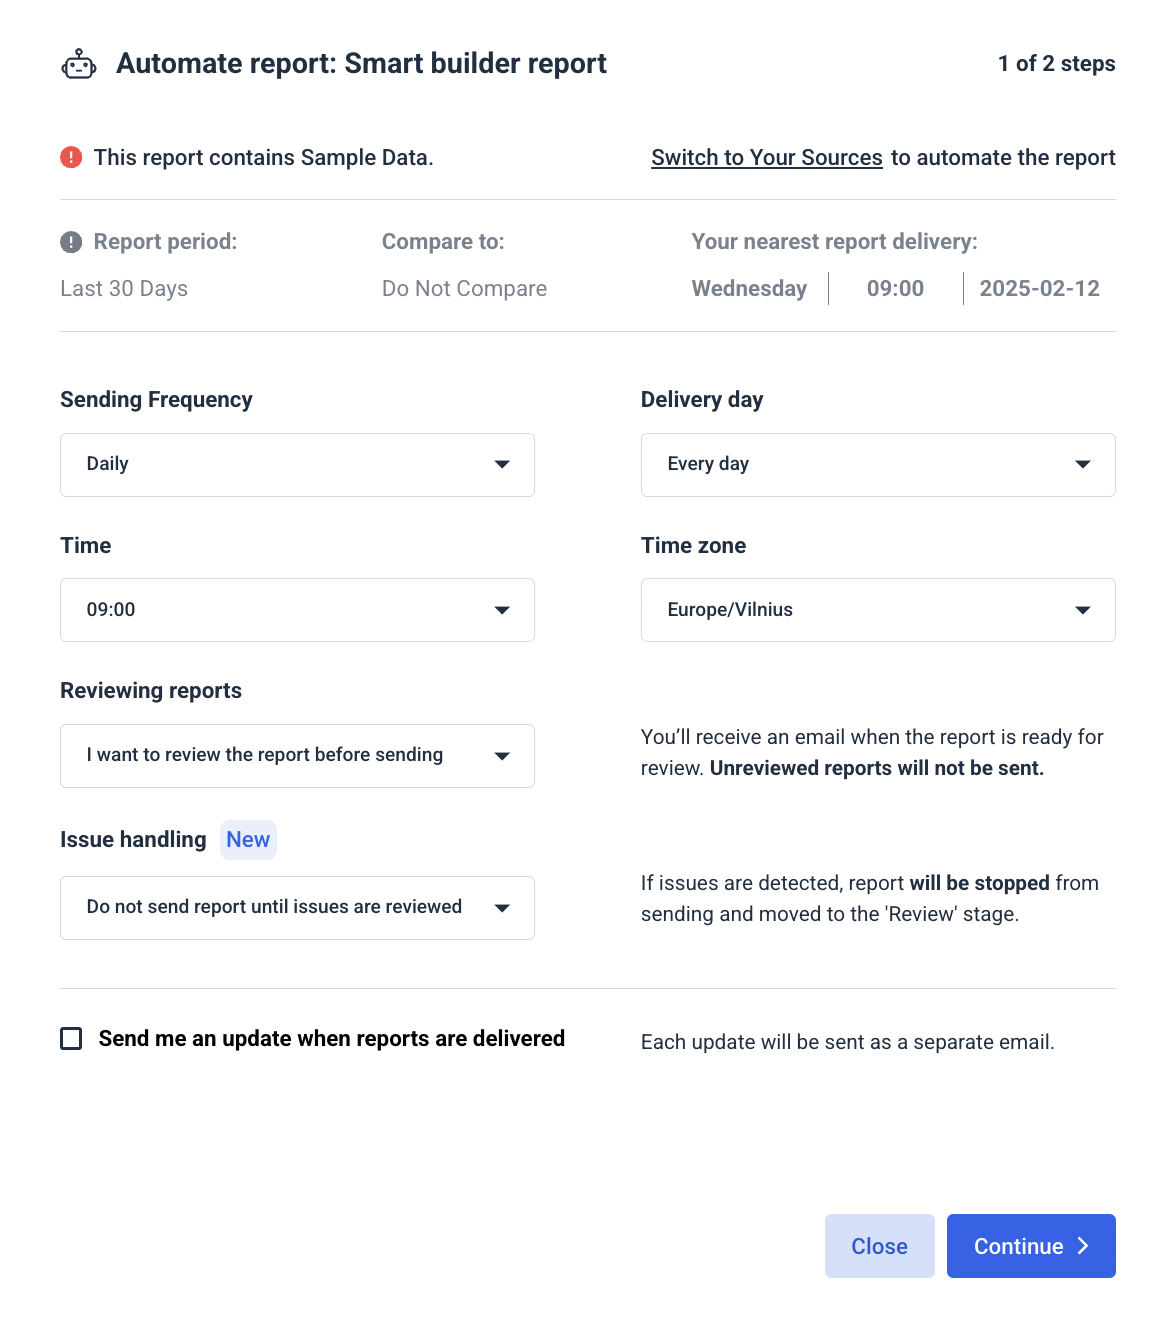 Each automated report moves through clear stages: Data Gathering → Review → Ready to Send. And you can jump in at any time to tweak metrics, revert to review mode, or check delivery history.
Much more efficient than sending a static PDF blast to all your clients.
What about AI features for insights?
Looker Studio doesn't have any AI features. At least on the free tier.
This is the problem with the “two-tool Frankenstein” when you combine different tools to accomplish one task: streamline client reporting.
Your features get split between platforms.
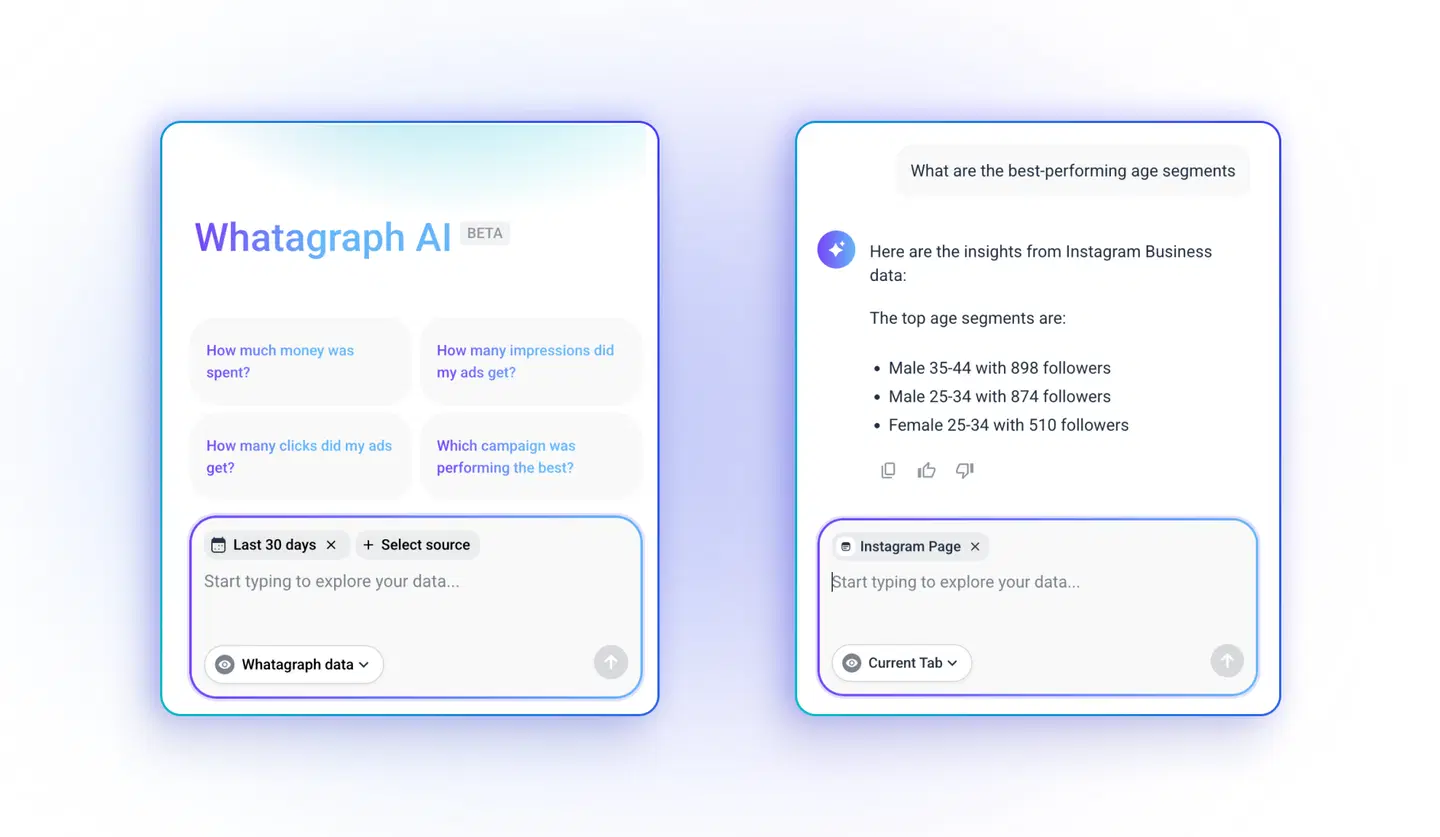
But with Whatagraph’s AI, you can actually talk to it to pull relevant insights from your campaigns instead of hunting down reports.
Report building is manual on Looker Studio, branding is hard to scale, and automations are basic. You’ll spend more time tweaking dashboards than actually sharing insights.
Feature Deep Dive #4: Looker Studio Customer Support
You’re not using Looker Studio in a vacuum. It’s one piece of a bigger, messier marketing reporting stack, usually stitched together with tools like Supermetrics, BigQuery, etc.
So when something breaks (and it will), here’s what happens:
- You open Looker Studio. Everything looks fine.
- You check Supermetrics. Maybe it’s a connector issue?
- BigQuery’s lagging—again? Or is it the data source?
You’re talking to Google and a third-party vendor. Each team tells you to check with the other. No one owns the full picture. But you still have to deliver the report.
This is the hidden tax of a fragmented stack: more time spent debugging, more internal ops cost, and less confidence when hitting send.
Now, what kind of support can you actually expect from Looker Studio?
Is there a dedicated Customer Success Manager (CSM)?
If you’re using the free version, you’re basically on your own.
Looker Premier Success is a separate, paid service that gives you access to:
- Technical assistance for Looker products.
- Google’s Success teams.
- Screen share support.
- Ongoing documentation and upgrade releases.
This isn’t built into the free or Pro version by default. You’ll need to explicitly purchase Premier Success (it’ll show up on your order form) and it only runs during standard business hours.
But unless you're paying for that tier, don't expect concierge-level care. This is enterprise-level support, not built-in white-glove service.
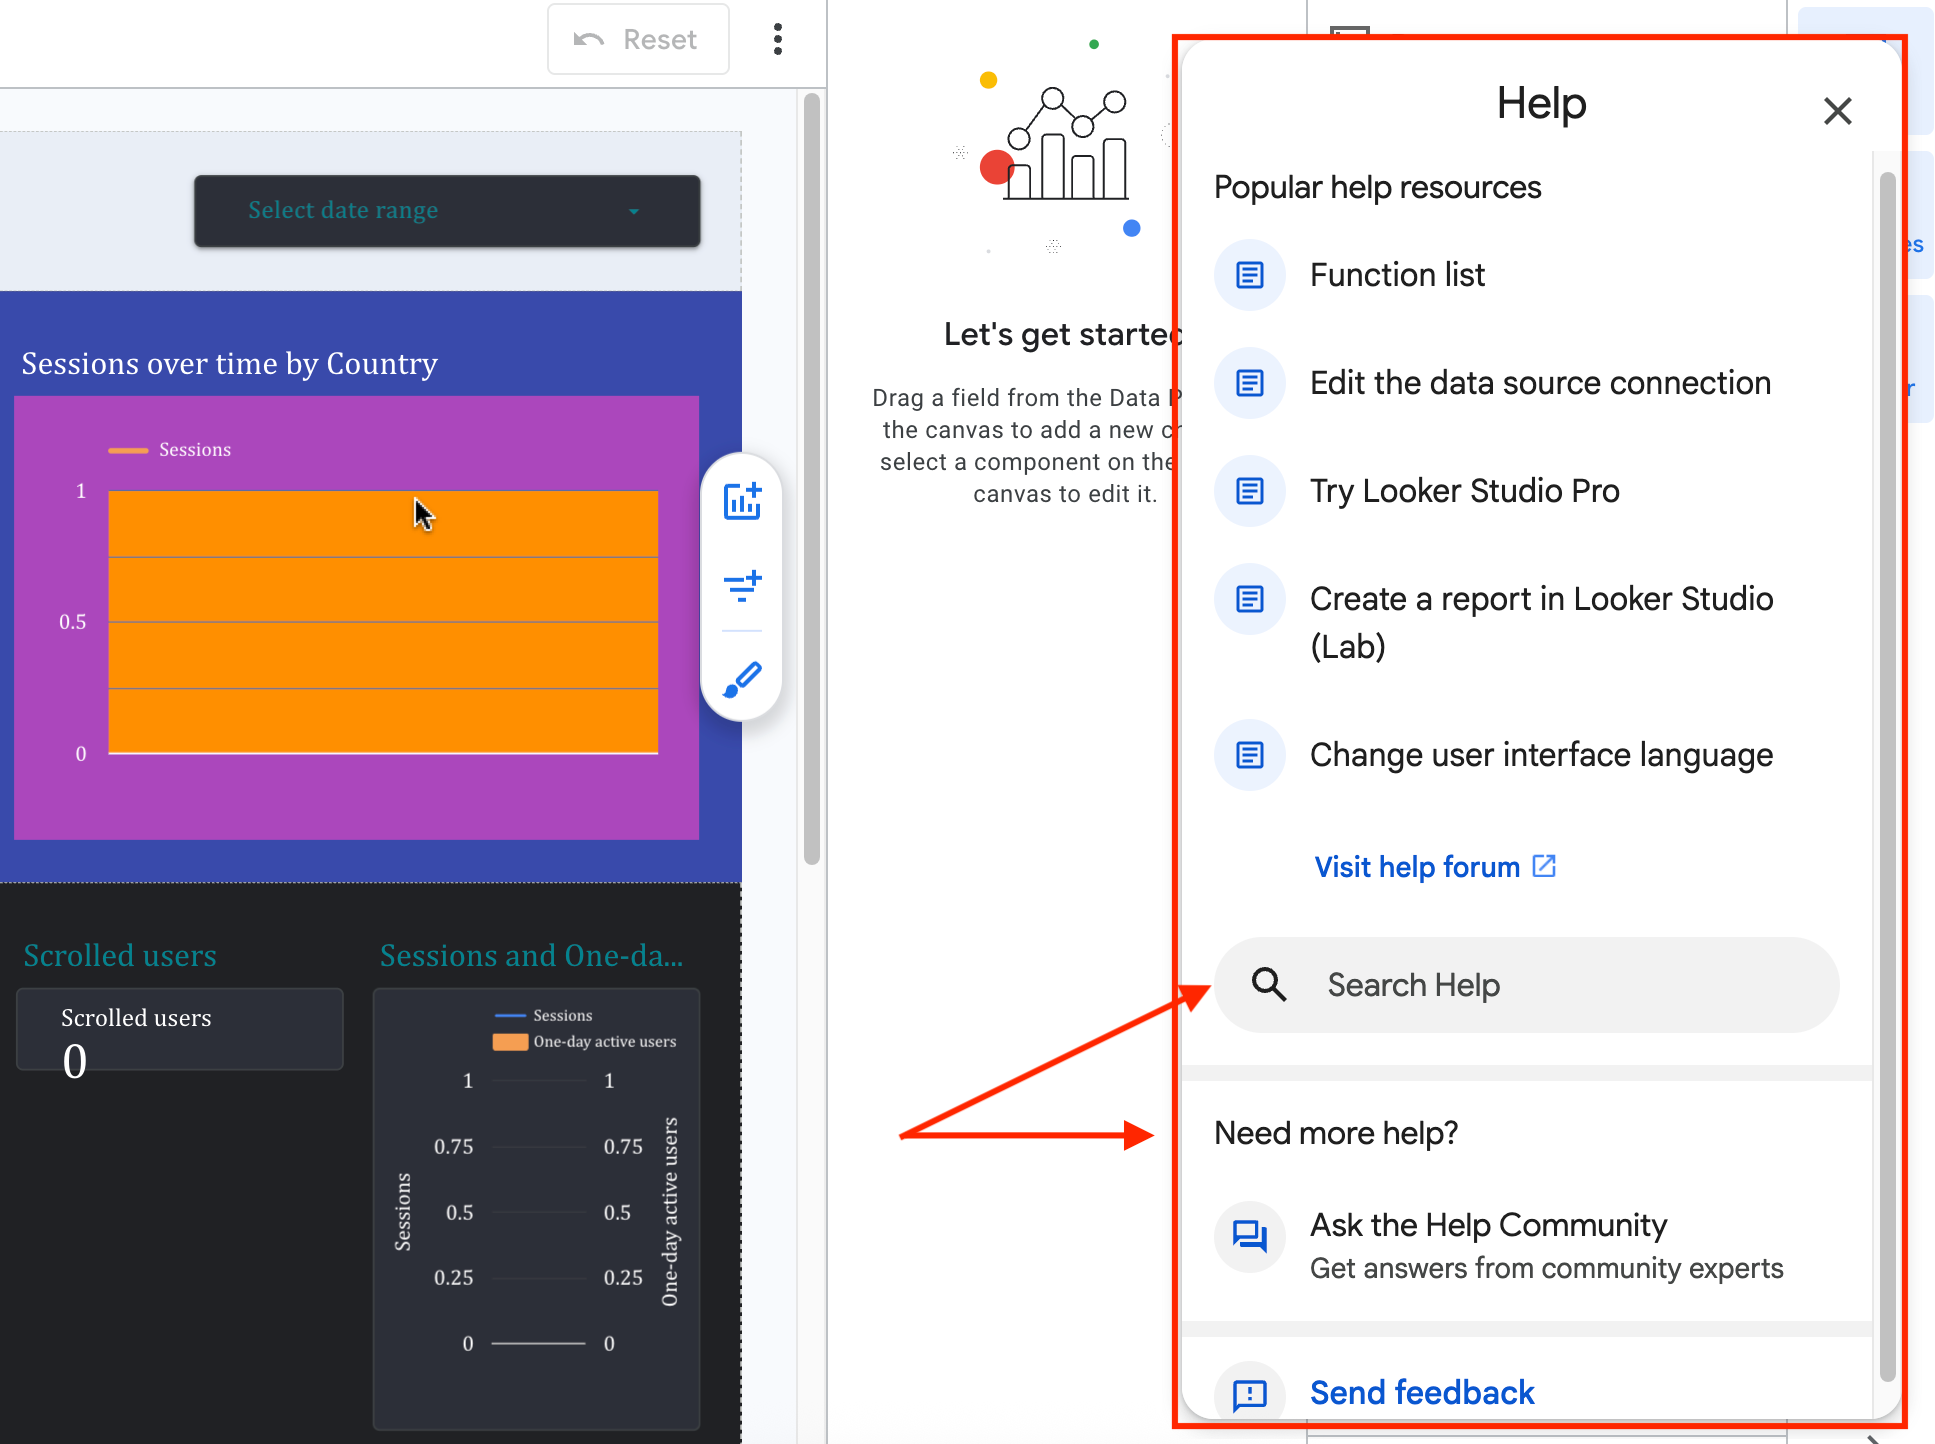
The other ways to get help are pretty standard, but they redirect you to outside the workspace instead of solving issues in-app.
And none of the options will help you solve real-time issues for faster data-driven decision making.
 At Whatagraph, you get top-notch live chat support on every pricing plan.
Plus, when something breaks, you only have to contact one support team—and we usually reply within 4 minutes via live chat and solve most issues in under 4 hours.
I've joked about this often—with Whatagraph, we're not paying for a reporting system. We're paying for customer support.
She’s just one of the many clients who moved away from the “Frankenstack” of Funnel + Looker Studio and never looked back. And she's loving it:
With Looker Studio, everything was muddled. But Whatagraph has opened up transparency and communication.
Here’s Kim in her own words:
What are real users saying about their Looker Studio experience?
Let’s just say expectations are…tempered.
Some folks shrug it off:
There aren’t a lot of direct customer support options, but that’s not an issue for me personally.
Others are more blunt:
Customer support for Looker Studio from Google is minimal.
And if you’re expecting white-glove treatment out of the box…don’t:
They don't have any dedicated technical support which I feel is a must…
There's no live chat, no named CSM, and no single source of truth when something breaks.
Now compare that to Whatagraph:
A verified user on G2 who’s been using Whatagraph for 7 years: “Stellar group of people, these.” (Same. We love them too.)
And here’s another: “Customer support is exceptionally fast and knowledgeable—every question is answered professionally within minutes.”
Looker Studio doesn’t come with built-in customer support, live chat, or a dedicated success manager. When something breaks, you’re stuck juggling chat windows between vendors.
Feature Deep Dive #5: Looker Studio Security
For digital marketing agencies, especially those working in finance, healthcare, legal, or ecommerce, client trust depends on how secure your reporting workflow is. And how confidently you can manage access and risk.
⚠️Also worth noting: There’s been a recent, real-world security concern tied to Looker Studio. I’ll tell you more in a minute.
Let’s get into it.
How do they approach data encryption?
Looker Studio doesn’t store permanent customer data in your instance. It connects live to your databases, so any sensitive information stays within your infrastructure—not Google's.
That said, it’s a shared responsibility model, according to Google’s documentation.
You (or your IT team) are in charge of setting up secure database access—via IP allowlisting, SSL/TLS, private network connections, or SSH tunnels depending on the version you're using.
Backups of configuration data (user settings, encrypted credentials, Looks, query history) are encrypted and retained for up to 180 days on Google Cloud.
Are they covering GDPR basics?
Looker Studio does support GDPR compliance. But it’s not automatic or “built in.”
If your agency operates in or serves clients in the EU, each user must fill out GDPR-specific fields in Looker Studio’s Account & Privacy settings to remain compliant. Alternatively, your account admin can accept Google’s data processing terms organization-wide.
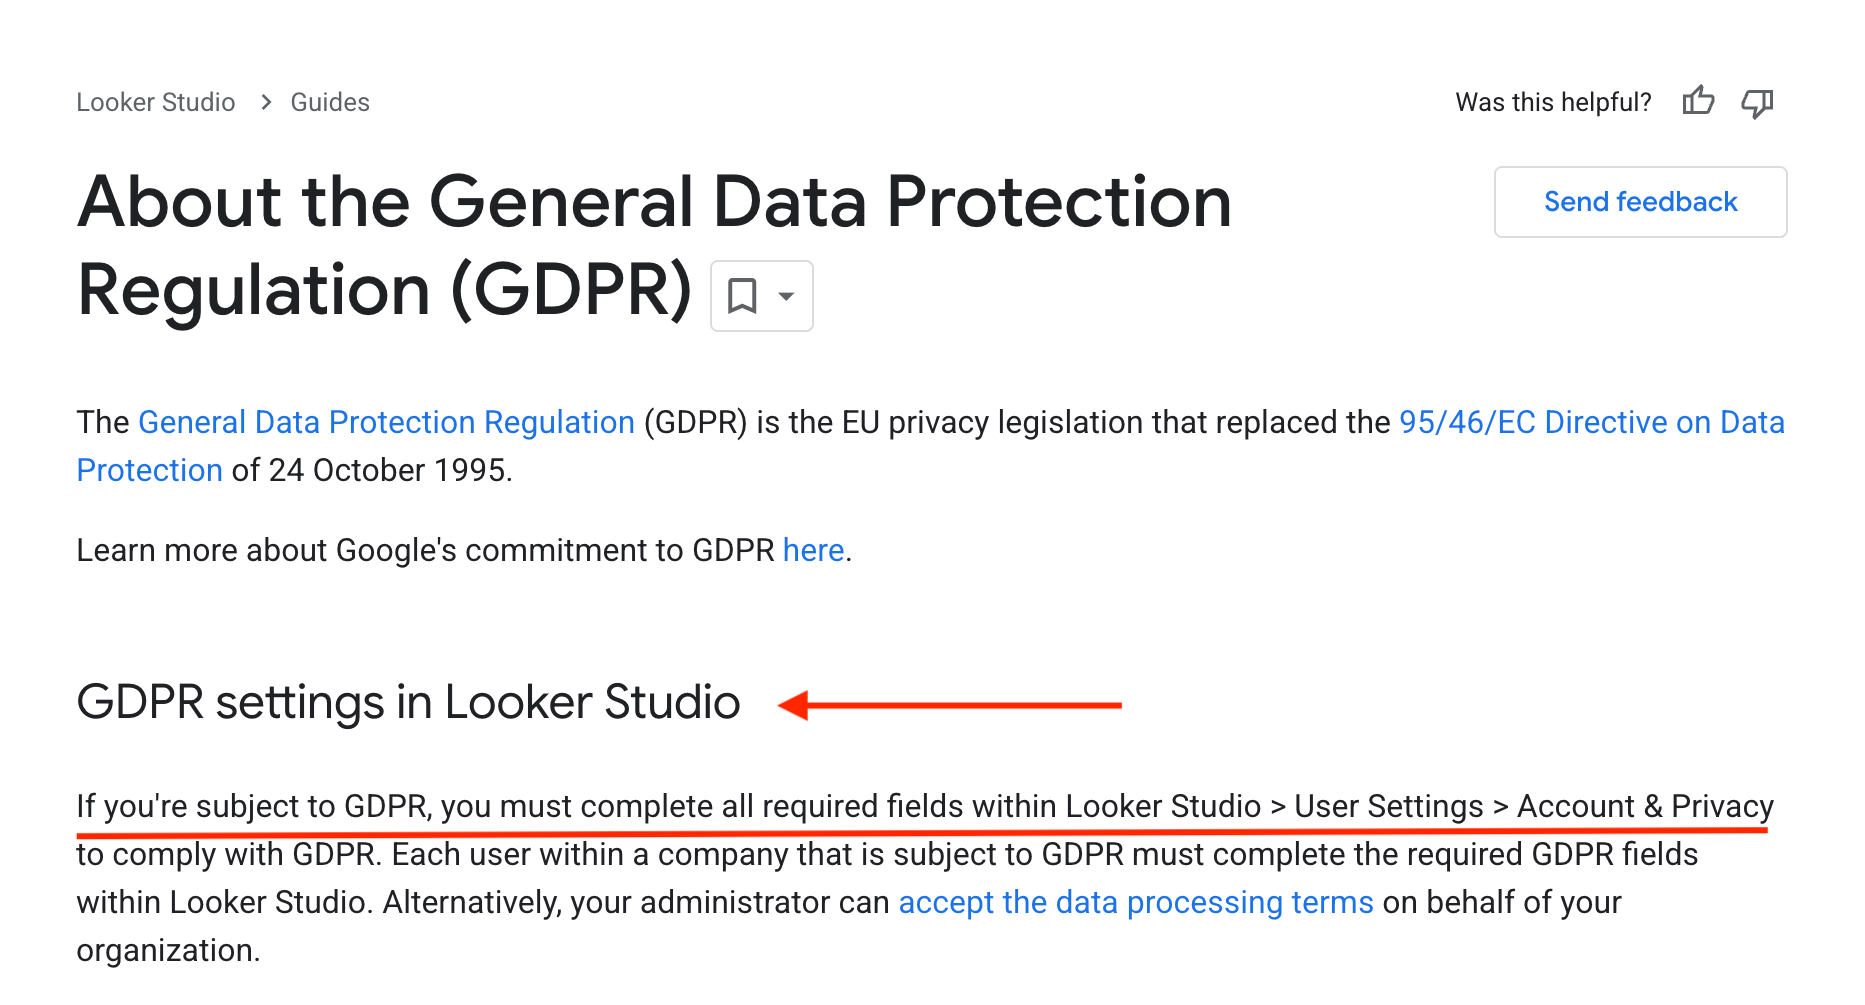
This step is easy to overlook—and not completing it could leave you exposed to serious legal trouble.
Can you control who sees what (role-based access)?
Looker Studio uses Google Cloud’s Identity and Access Management (IAM) system to control who can view, edit, or manage each asset—whether it’s a report or a connected data source.
You assign roles on a per-asset basis. That means you could give someone:
- Editor access to a client’s performance dashboard, but only Viewer access to the underlying data source powering it.
- If you’re on Looker Studio Pro, workspace roles (Contributor, Manager, etc.) give you team-wide control over access, trash recovery, and ownership changes.
For example, you might give a junior team member Editor access to a dashboard but only Viewer access to the data source, so they can tweak visuals, not data connections.
⚠️ Looker Studio security in the news…
In 2023, hackers started using Looker Studio to launch BEC 3.0 scams: phishing attacks that piggyback on trusted tools to trick users.
These reports came from real Google infrastructure. Which means most spam filters let them through.
One of the best practices in the article by Jeremy Fuchs, Cybersecurity Researcher/Analyst is to: “Embrace a comprehensive security solution that includes document and file scanning capabilities.”
Even as of June 2025, the security issue hasn’t been patched. A white-hat hacker known as “Brutecat” uncovered a critical flaw in Google’s authentication systems, one that exposed phone numbers tied to any Google account. The exploit leveraged Looker Studio as part of the attack path.
If you’re evaluating Looker Studio as a serious option for your data analysis and data integration, watch this video by Fuchs first to protect yourself from cybercriminals:
Whatagraph is fortressed with enterprise-level security:
- ISO-27001 certified
- GDPR compliant
- AES‑256 encryption
- Strict role-based access
- 2-step verification
- Regular password rotations, and AWS/GCP hosting with ISO‑27001 standards. You control exactly who sees what and can permanently delete your data at any time.
We’ve built the platform to keep your data locked down.
Read our security policy here.
Looker Studio handles the basics, but serious security is on you. And hackers have already weaponized Looker Studio in phishing scams. So, if you’re working with sensitive client data, don’t assume “Google-backed” means bulletproof.
Final Verdict: When to Use Looker Studio and When to Switch
Choose Looker Studio if:
- You work solo, or your agency is small and highly technical.
- You only need to report on Google data (Ads, Analytics, BigQuery, etc.)
- Cost is your top concern, and you're fine piecing together your stack with third-party connectors.
- You’re comfortable navigating multiple support forums and vendor docs when something breaks/
- You don’t need advanced scheduling, templates, or AI summaries—just a way to pull data into a chart.
- You have the bandwidth to manually manage access, reports, and data permissions across platforms.
Choose Whatagraph if:
- Your agency is scaling, and report complexity—or volume—is starting to slow you down.
- You need more than just Google data, and want 55+ native integrations without paying extra for third-party connectors.
- You’re spending too much time troubleshooting issues across Supermetrics, BigQuery, and Looker Studio.
- You want beautiful, client-ready dashboards and branded reports, without fiddling with style settings for every widget.
- Your team needs linked templates, AI summaries, and centralized editing to deliver faster, more consistent reporting.
- You care about support and want someone who actually responds—with a live chat team that replies in under 4 minutes.
Ditch the Frankenstack. Talk to us to reclaim up to 70% of your time.