


What Should a Google Analytics Reporting Template Include
Based on Google Analytics 4 report templates created by marketers on Whatagraph, here are the sections, widgets, and chart types we recommend you include in yours:
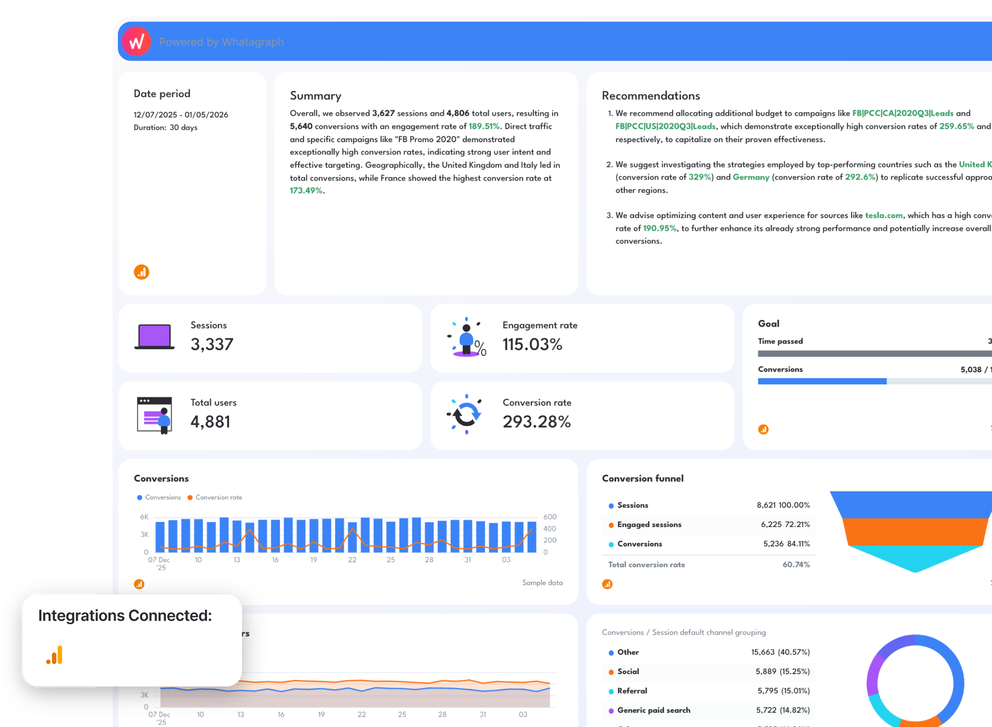
1. Report Context And Executive Summary
Every strong Google Analytics report template starts with context before metrics.
What to include
- Reporting date range and period
- A short executive summary written in plain language
- Key takeaways tied to website performance and campaign performance
This summary typically references:
- Sessions
- Total users and new users
- Conversions and conversion rate
- Engagement rate
This section helps stakeholders understand the story behind the Google Analytics data before looking at detailed visualization.
2. KPI Snapshot With Key Metrics
Next comes a compact KPI overview that highlights the most important performance metrics.
Common KPIs
- Sessions
- Total users
- Engagement rate
- Conversion rate
- Revenue or goal progress for Ecommerce sites
Chart type
- KPI tiles or scorecards
This snapshot anchors the entire performance report and sets a baseline for evaluating digital marketing results.
3. Website Traffic And User Trends Over Time
Trend analysis shows how performance changes across the reporting period.
What to include
- Total users compared to new users
- Sessions and page views over time
- Conversions plotted alongside conversion rate
Chart types
- Line charts
- Combined bar and line charts
These views help marketing teams understand website traffic patterns, user engagement, and real-time changes without digging through Looker Studio tutorials.
4. Engagement And Conversion Funnel Analysis
Google Analytics 4 uses an event-based model, so high-quality custom report templates translate events into a simple funnel.
Typical funnel steps
- Sessions
- Engaged sessions
- Conversions
- Total conversion rate
Chart type
- Funnel visualization
This section connects user experience, session duration, engagement rate, and retention into a format that supports data-driven decisions.
5. Traffic Sources And Marketing Channels Breakdown
This section answers where results are coming from.
What to include
- Organic Search
- Direct traffic
- Referral traffic
- PPC and Google Ads
- Social Media traffic from Facebook Ads and LinkedIn
- Email Marketing traffic
Metrics
- Sessions
- Conversions
- Conversion rate
- CTR for paid campaigns
Chart types
- Donut charts for distribution
- Tables for detailed comparison
This breakdown helps teams compare SEO, PPC, and Social Media performance across multiple data sources.
6. Campaign Performance Reporting
For paid and cross-channel marketing campaigns, this section is essential.
What to include
- Campaign name
- Sessions
- Conversions
- Conversion rate
Chart types
- Donut charts for top campaigns
- Tables for full campaign performance
This view supports budget decisions and optimization across Google Ads, Facebook Ads, and other digital marketing channels.
7. Geographic And Audience Insights
Strong Google Analytics report templates go beyond traffic volume.
What to include
- Sessions and conversions by country
- Conversion rate by region
Optional additions:
- Demographics
- Device categories
Audience segments
Chart types
- Tables
- Donut charts
This section is especially valuable for Ecommerce brands and global marketing strategies.
8. Behavior And Retention Patterns
More advanced dashboard templates include behavioral insights while keeping reports readable.
Examples
- Conversions by Nth day
- Engagement trends over time
- Retention indicators
Chart types
- Tables
- Time-based breakdowns
These insights help teams optimize landing page performance, improve user experience, and streamline marketing workflows.


