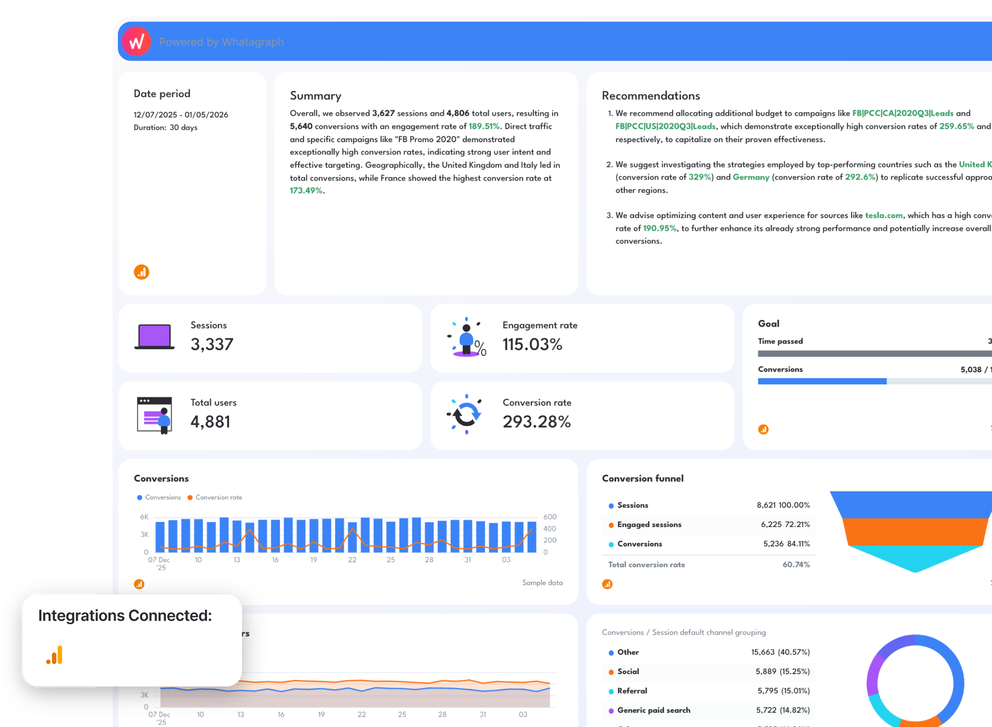
GA4 Report Template

Optimizing your client’s website for conversions?

Save time gathering web analytics insights and metrics with one stunning GA4 Report Template.

Wow clients with custom Google Analytics reports — built in seconds.

Help them improve customer experience on every page.

GA4 Report Template
You are in good company with 1,000+ marketing agencies and in-house teams worldwide
Dentsu
mc cann logo
Whatagraph image
Whatagraph image
Whatagraph image
Ogilvy logo
havas logo
n365 logo

How Whatagraph Saves You Time on Reporting

Automatically Collect Live Data From Your GA4 Property

Stop downloading Google Analytics report spreadsheets week after week. 


With Whatagraph, you can connect your GA4 data sources in just a few clicks.


Our Google Analytics 4 Report Template comes with the most important website analytics metrics and KPIs.    


Website performance reporting has never been easier. Just plug and go. 

Automatically Collect Live Data From Your GA4 Property - GA4 Report Template

Add More Data to Your Web Analytics Reports

Tracking paid ads, social, and SEO can tell you where your website traffic comes from.  


But there’s no need to create dozens of separate marketing reports.


Whatagraph seamlessly connects with 50+ marketing platforms for a complete view of your performance. 


Add as many data sources and integrations to your Google Analytics report as you like.

GA4 Report Template

Customize Your Google Analytics Reports

Impress clients with professional and polished Google Analytics dashboards. 


Customize your reports with your client’s logo. 


Create different visual themes. Host every report on a custom domain. The possibilities are endless. 


Save every report you create as a custom report template.

Customize Your Google Analytics Reports - GA4 Report Template

Share Data and Reports Your Way

Want to send automated emails to your clients every month? Or ship your data to BigQuery?


We got you covered.


Share live links to reports, send automated emails, export to CSV or Excel, and transfer data to Google BigQuery — all through Whatagraph.

Share Data and Reports Your Way - GA4 Report Template

It’s good to be loved! Our clients are not shy about expressing it.

I made a switch from GDS and Sheets for reporting to Whatagraph, and I am saving literal hours each week on performance report creation. Our small firm actually managed to onboard 2 new clients as a result of all the time we saved on managing data and reporting. The customer service is also really helpful and easy to reach.

Mindaugas S., Marketing Consultant Capterra logo for Whatagraph review

Capterra verified review by

Mindaugas S., Marketing Consultant

Having active customer support to help fix any issues was a big contributor, but we also really liked the ability to save templates and connect sources to multiple charts/widgets at once without having to edit them individually. And having the grid layout is much easier to stay consistent with than the free form setup that Data Studio has.

Nico T., Media Planner Capterra logo for Whatagraph review

Capterra verified review by

Nico T., Media Planner

The system has standard templates that are easy and fast to use. Also you can build your own report with lightning speed. It is very easy to use, has a lot of integration, and let get started very fast.

Rasmus Bernt K., External Senior Management Consultant Capterra logo for Whatagraph review

Capterra verified review by

Rasmus Bernt K., External Senior Management Consultant

We love Whatagraph - we would definitely recommend and our account manager is great! I love how easy this tool is to use, everyone on the team finds it much more user-friendly than other dashboards. Integration was easy, we sent some example reports to the team who duplicated these for us. We literally had to log in and send it to our clients!

Stephanie S., Digital Director Capterra logo for Whatagraph review

Capterra verified review by

Stephanie S., Digital Director

We are showing our clients the work that we're doing for them and this is incredibly important for our clients ROI. They want to see results and having a tool like Whatagraph that can show data from virtually every source we use is hugely important.

John S., SEO Strategist Capterra logo for Whatagraph review

Capterra verified review by

John S., SEO Strategist

The tool is easy to use; you do not need to have development resources. Even my junior project managers are capable of making campaign reports in minutes. There are a lot of pre-made templates you can use as well as many pre-made widgets.

Erman E., Marketing Specialist Capterra logo for Whatagraph review

Capterra verified review by

Erman E., Marketing Specialist

Really easy to connect data sources within the tool. The library of report templates has been helpful. The customer support team has been responsive to all of our needs. Our team enjoys the simplicity of setting up the reports and how the data is presented.

Brent N., Director of Operations Capterra logo for Whatagraph review

Capterra verified review by

Brent N., Director of Operations

Easy to create really beautiful graphs and reports which can help other team members to understand the most important takeaways. I especially like the automated report function, so I don't have to check on the same thing repeatedly.

Orsolya S., Online Marketing Manager Capterra logo for Whatagraph review

Capterra verified review by

Orsolya S., Online Marketing Manager

More Sources for Your Google Analytics Report Template

Connect all your web analytics, SEO, social media, e-commerce, and other digital marketing platforms. Hook up the sources, and data flows automatically. No coding needed.

How Do You Track GA4 Data?

Tracking Google Analytics 4 data is the first step in discovering user experience hot spots and optimizing your site for conversions. 

There are several ways you can do this: 

Native GA4 Reports

GA4 comes with several report types that you can use to track your website activity:

  • Exploration reports 
  • Funnels 
  • Custom dashboards 

Google Analytics is free and readily available, but its reports are not flexible at all.

You may find it difficult to tell a story with data, explore the conversion funnel in more depth, or visualize that data the way you want. 

Here are some of the key issues with native GA4 reports:

❌ Limited customization: There are just a few ways you can customize these reports. 

❌ Fixed templates: GA4 offers seven report templates called exploration reports, but you can’t change any of them or create one template with everything you need. 

❌ Complex report builder: Creating a new report is hard for inexperienced users. Even worse, you need to retrace the steps for every client, since you can’t save anything as a template. 

❌ Basic visualizations only: No way to create charts or tables with blended data or custom metrics.  

❌ Manual sharing: You can either download and send PDF reports to every client or give them a link to the whole GA4 dashboard and hope they’ll find what they need. 

Looker Studio GA4 Report Templates

Looker Studio is a popular and versatile data visualization tool with multiple perks:

✅ Free to use with GA4 data: You can pull real-time data from GA4 for automated reporting.

✅ Customizable templates: Create or use pre-built templates to track the clients' KPIs. You can also brand these reports with your agency’s logo. 

✅ Wide choice of visuals: Tell the story with time-series graphs, bar charts, pie charts, and many more. 

On the other hand, Looker Studio has serious limitation that make it less ideal for large marketing teams:

❌ Gets slow with more dataLooker Studio often slows down when handling large datasets, more sources, or several visualizations in one report. 

❌ Delays in refresh rate: With some sources, you don’t have real-time data update. Different third-party connectors have different refresh rates, so your data may not be accurate. 

❌ Hard to customize: You will most likely need help from a data analyst or developer to customize your dashboard the exact way you want.

❌ Limited data transformation: You run into more limitations when you try to blend data. Also, there’s no way to create a custom formula on a source level.  

❌ No bulk report edits: If you need to change a same detail on 50 reports, you need to do it one by one. 

❌ No widget templates: If you create a custom widget, there’s no way to save it for future reports. What happens in a report stays in the report.

❌ Free only with Google sources: If you want to add social media, PPC, or other data to your GA4 report template, You need to buy third-party data connectors.

Also, if you get stuck with Looker Studio, the only help you can get is from Google’s help sections, tutorials and user forums.

Whatagraph’s Google Analytics 4 Report Template

Whatagraph is hands down the easiest, fastest, and best-looking solution for reporting website metrics from your GA4 account. 

Flexible and easy to use, Whatagraph is a great choice for large marketing teams who report on GA4 metrics for many clients.

Whatagraph’s_Google_Analytics_4_Report_Template.png

But why should you use our Google Analytics 4 Dashboard Template instead of native GA4 reports or Looker Studio?

✅ Easy to set up and use ✅

When your Google Analytics reporting template is easy to use, you spend less time figuring out how the software works and more time delivering results for clients (and onboarding new ones!).

With our GA4 Dashboard Template, you can:

  • Set up automated GA4 connections that refresh in real-time (no maintenance needed)
  • Rearrange or add new widgets, graphs, and charts using drag-and-drop
  • Customize each report for a specific client ( without coding or design skills)  
  • Create any report you want within minutes with little or no training 
  • Automate the report sending on a schedule that fits the client

This means you can put the whole GA4 reporting workflow on autopilot. 

You can use the template to create engaging reports in less than an hour without asking help from developers or data engineers. 

It’s also easier and faster to onboard new members and clients. Plus, you can use the time saved for more creative and billable tasks. 

✅ Highly customizable ✅

Different clients will be interested in different metrics. This means your GA4 templates must allow you to choose which key metrics to highlight in your reports. 

In Whatagraph, for example, this is very easy to do using drag-and-drop metrics widgets. All metrics from your Google Analytics account are available as single-value widgets, graphs, charts, or tables.

We use Whatagraph for all our client’s reports. The ability to title metrics differently is important to us because we often report the same metrics to different clients and just need to call them differently because many clients have internal terminology that is very different from one another.

Drew Cove - Senior SEO Manager @ DigitalParc

Anyone on your team can easily build reports without hiring a data scientist.

On the visual side, you can:

  • Upload your or the client’s logo to the report
  • Create color schemes that match your or your client's brand colors
  • Add text, headers, and footers
  • Create more tabs to organize your GA4 report into sections

In other words, you can do everything to create Google Analytics custom report templates for different clients without assigning complex set ups across your team. 

✅ Easy to integrate data from other platforms ✅

A client may hire you to improve the user experience and conversions on their site. But more likely, they will want to know how visitors land on their pages. 

Is it mostly socials? Organic search? Paid ads?

So your Google Analytics report templates should easily integrate data from sources like: 

  • Google Search Console
  • Ahrefs
  • Semrush
  • SE Monitor
  • SERanking
  • AccuRanker
  • Facebook
  • Instagram
  • X
  • Pinterest

But creating separate reports for all these channels would take so much time.

You don’t need to do that.

On Whatagraph, you can easily add data from any source you have to any report template and organize it in logical sections or tabs. 

Every integration refreshes automatically, so you only need to send one report to each client.   

✅ Stable and reliable ✅

Even the most beautiful report is useless if the connected data is unreliable. 

What does that mean? 

It means your dashboard can crash in the middle of a client call.

Or just minutes before the marketing review meeting.

Imagine the horror — You worked so hard for those results, and now you can’t show them to the client or leadership.

Luckily, you won’t have synch problems with GA4 custom reports templates from Whatagraph. 

All our integrations, GA4 included, are in-house built and fully managed. There’s nothing to set up on your side. They’re all maintained and updated by our dedicated Engineering team. 

You can also create a blend of different sources with custom metrics and dimensions. Add this blend as a source to your template — alongside any other “regular” data sources.

When your integrations are made in-house, the Engineering team can resolve any bugs much faster than if you go through a third-party company. 

✅ Dedicated customer support ✅

No matter how easy it is to use a report template, there might be times when you need help from a real person to get you through things. 

At times like this, it’s so much easier when you can contact your reporting software provider and get help quickly.  

At Whatagraph, you can reach out to us via live chat on our website or email. And our amazing Customer Support team will get back to you within 34 seconds to 4 minutes, and resolve issues within 5 to 24 hours. 

Can I Automate Google Analytics Reports?

Yes, you can automate Google Analytics if you use Whatagraph. 

Once you connect your GA4 source to our report template, every metric updates automatically. There’s nothing for you to re-run or reload. 

By automating our data collection and reporting, we have not only made our own operations more efficient, but above all improved our customers' access to information. They can now benefit in real time from deeper insights presented in a clear and user-friendly way. We can now together make faster and even better decisions!

Andreas Sandgren - CEO @ Market Solutions

You can also choose how to automate report sharing. 

You have two options:

  • Scheduled email reports: Pick the frequency and time of sending, and the PDF report will go straight into your client’s mailbox without misses or delays.  
  • Live dashboards: Share a password-protected link to a live GA4 dashboard so clients can always check the live data. 

In both ways, once you set up the reporting automation, there’s nothing more to manage. Everything’s on autopilot. 

What Questions Can a GA4 Report Template Help You Answer?

Depending on what kind of report you create, a GA4 report template can answer many questions about your website and the people who engage with it. 

Here are the most useful reports you can create with this template. 

Audience reports

These reports give you more info about the people who visit your website. You can use the data to create more targeted ad campaigns or understand if your website visitors match your ideal customer profile.

You can find out where users come from. From what country and which city? What language do they speak, and what’s their age? 

You can also create tech reports to find out what platforms, devices, OS, or browsers your visitors use.

This information can help you optimize your site and develop new UX features. 

Acquisition reports

These reports tell you which channels visitors use to get to your site and even what campaign brought them there.

This report can help you spot more effective marketing campaigns. It also tells you whether you should prioritize attracting new users or retaining returning customers.

There are two types of GA4 acquisition reports:

  • User acquisition reports: How do new users find your website for the first time?
  • Traffic acquisition reports: Where do new sessions come from, both for new and returning users?

Engagement reports

You can use these kinds of reports to discover what content or landing pages your visitors engage with.

  • Page and screens report: This shows how your website performs by the number of page views. It contains metrics like average engagement time, views per user, etc.
  • Events report: This shows how often visitors trigger events on your website. For example, you can use it to see if visitors click on your special offer banners or how far they scroll down your site.

Conversion reports

What used to be Goals in Universal Analytics are now Conversions in GA4. Conversion reports can tell you how many signups you have today or how much you spend. 

With GA4, you can define your conversion events for a whole site or a specific lead generation campaign. This way, you can focus on keywords that drive the most results for your business.

Retention reports

These reports tell you what percentage of visitors return to your website over time. It includes metrics such as average time on site and returning users in 42 days. 

What Metrics Can You Track With This GA4 Report Template? 

You can track all the metrics available from your Google Analytics 4 account and even create new ones using our custom formulas. 

Still, the metrics you should track depend on the type of website and your client’s objectives. 

Here are some key metrics that you can’t go without: 

  • Users: Active Users, New Users, and Returning Users
  • Acquisition: Source/Medium, Channels, and Campaigns
  • User behavior: Pageviews, Average Time on Page, Engagement Rate (including Bounce Rate from Universal Analytics), and Events (specific to client goals)
  • Conversions: Goal Completions, E-commerce Conversions (e.g checkouts), and Conversion Rate (First Time and Total)
  • User engagement: Sessions, Session Duration, Interactions per Session, Retention
  • Audience: Demographics, Interests, Device Category
  • Events: Specific events related to key actions, Event Count
  • E-commerce (for e-store websites): Total Revenue, Purchases, Average Order Value
  • Custom metrics: Any custom metrics that are specifically relevant to the client's objectives

How Do I Customize Google Analytics Reports?

When you present a personalized report to clients, you show that you’re ready to take extra steps and commit to their specific needs. 

It’s pivotal that agencies don’t take a ‘one-size-fits-all’ approach to their service. While they can have some type of ‘template’ for how their processes work or a general list of what they can offer, every client should have a personalised approach.

Gareth Bull - Founder of Bulldog Digital Media

You can use Whatagraph to demonstrate value by customizing every report you send.

Here’s what you can do:

Customize any report in minutes: Building a custom Google Analytics 4 report template doesn’t take hours every time. You can personalize the existing template in just a few minutes. 

Remove any mention of Whatagraph: You can easily replace Whatagraph’s branding with your agency’s logo, brand name, colors, and text style. Make all Google Analytics custom reports templates truly yours. 

Make the report look like your website: Pick the exact color code from the palette and make every report template look like a part of your website. 

Create different visual themes: The best way to impress a big corporate client in 2 minutes? Personalize their report with their branding and colors to show the extra care. Choose a global visual theme for your agency and create multiple themes for different dashboards or even widgets. 

Share live reports on a custom domain: Use a custom domain that includes your agency name to host each report or dashboard. Clients won’t see “whatagraph” mentioned anywhere and think you built the whole thing yourself. 

Use a custom email address: If your client prefers PDF reports, send them scheduled reports from a custom email address with a custom subject line.

FAQs

All your questions answered. And if you can’t find it here, chat to our friendly team.

What marketing channels can you connect with Whatagraph?

You can connect over 55 digital marketing channels, including SEO tools like Ahrefs, Semrush, and Google Search Console, and PPC tools like Facebook Ads, Google Ads, and LinkedIn Ads. 


Pull data from social media platforms like Facebook, Instagram, and Twitter, email marketing tools like Mailchimp and ActiveCampaign, eCommerce platforms like Shopify, and CRMs like HubSpot and Salesforce.

What if my data source is not among supported reporting integrations?

In that case, you can ask your developers to build a custom API — a routine procedure — or export your data to Google Sheets or BigQuery and add them as a source.

What happens with my old Google Analytics reports?

Universal Analytics doesn’t collect data anymore, so any reports or templates you created with your UA properties are no longer usable.
 

We suggest you add your Google Analytics 4 account as a source and use our GA4 report template to create new reports with fresh data.