


What is a Stackadapt dashboard?
A StackAdapt dashboard is a centralized marketing dashboard that pulls your programmatic campaign data into one place - so you can track performance and share results without manually exporting from StackAdapt's native interface every time.
The need for StackAdapt dashboards is only growing. StackAdapt is one of the fastest-growing demand-side platforms (DSPs) on the market, used by over 12,900 companies. With programmatic ad spend hitting $595 billion in 2024 and forecast to reach nearly $800 billion by 2028 (Statista, 2025), more budget is flowing through DSPs than ever - and clients expect to see where every dollar went.
A well-built StackAdapt dashboard gives you a system to prove ROI. The right setup should help you:
✅ Track the programmatic metrics that matter most - impressions, clicks, conversions, CTR, video completion rate, and ROAS - all in one view
✅ Break down campaign performance by campaign type, ad name, city, and device - so you know exactly where to shift budget
✅ Visualize performance trends with charts, goal widgets, and period-over-period comparisons - not just raw numbers
✅ Tailor the layout to each client's goals and brand without rebuilding from scratch each time
✅ Share results through live links, scheduled PDFs, or automated email delivery
All of that is possible with Whatagraph. Here's the full workflow:
1. Connect directly to your StackAdapt account. No CSV exports, no manual data pulls.
2. Build (or customize) your dashboard. Use a pre-built StackAdapt template, or use Whatagraph IQ to generate one from a simple prompt
3. Add AI-insights with IQ summaries. IQ reads your actual data and writes a summary automatically - in 18 languages.
4. Automate delivery via Slack or Email. Send live links, export as CSV or PDF - whatever your workflow, Whatagraph supports it.
5. Query your data with Whatagraph MCP. Once your StackAdapt data is connected, Whatagraph MCP lets you connect your account directly to Claude or ChatGPT for further analysis.
You can ask plain-language questions about your campaigns - without opening a dashboard or pulling a report.
Try prompts like:
- "Which StackAdapt campaigns have the highest CPM this month?"
- "Show me CTR and conversion rate by ad type for the last 30 days."
- "Which campaigns are overpacing on budget this week?"
Full setup guide: Connect Whatagraph to your AI assistant with MCP.
What To Include In A StackAdapt Dashboard Template
A good StackAdapt dashboard template doesn’t dump data.
It tells a story about your campaign performance, highlights what’s working, and makes it easy to optimize your programmatic advertising.
Based on StackAdapt dashboards created by marketers on Whatagraph, here’s how to build a marketing dashboard that actually drives decisions.
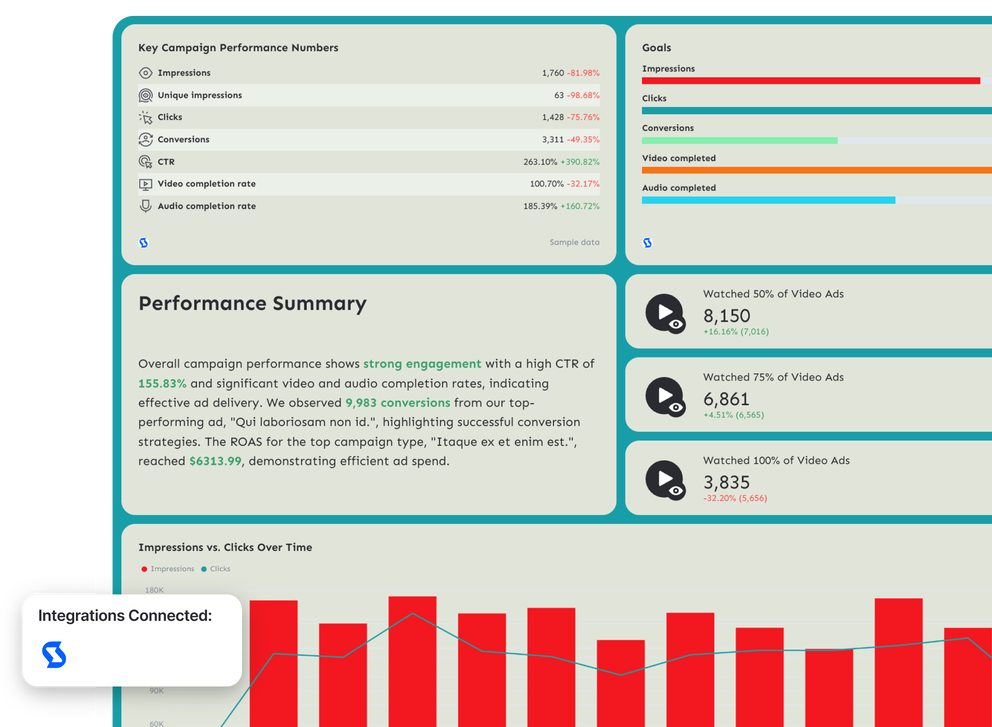
1. Key Campaign Performance Numbers
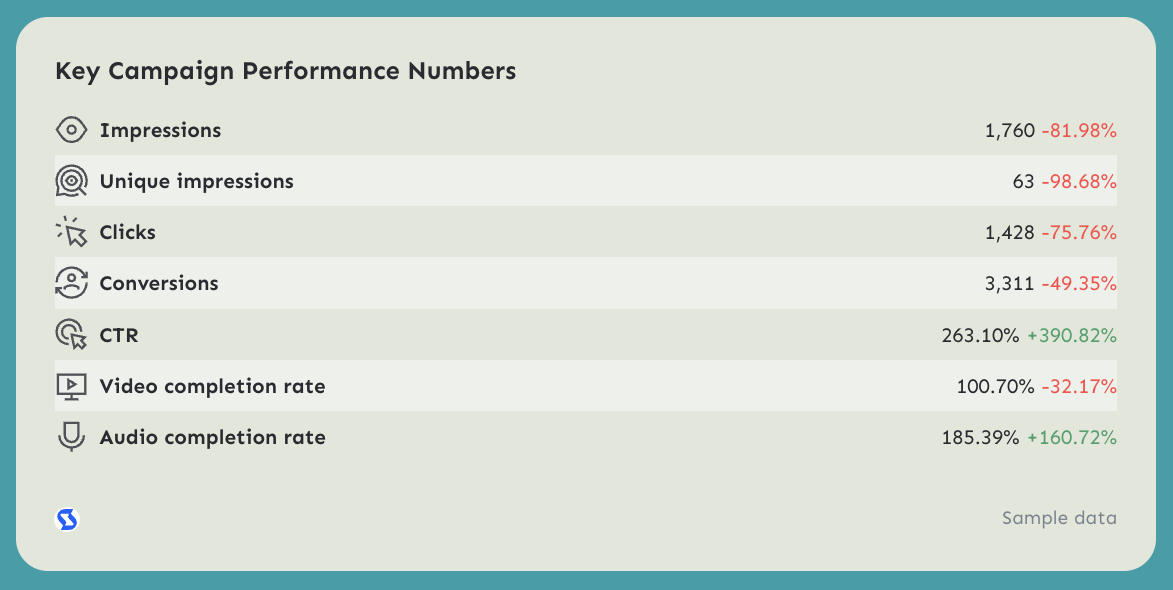 This is your executive snapshot.
Core StackAdapt Metrics To Visualize
- Impressions
- Unique impressions
- Clicks
- Conversions
- CTR
- Video completion rate
- Audio completion rate
If you’re running PPC or programmatic ad campaigns, these are your non-negotiables.
Optional additions:
- Spend
- Revenue
- ROAS
- Conversion rate
- CPM
- CPC
These KPIs prove ROI fast.
There's a ton of metrics that we as marketers look at that would make no sense and probably overwhelm the customers. So we always try to be very specific about what the client's goal is and then just show the metrics for that. - Cheyenne Skye, Digital Marketing Analyst, Noise New Media
2. Goal Pacing
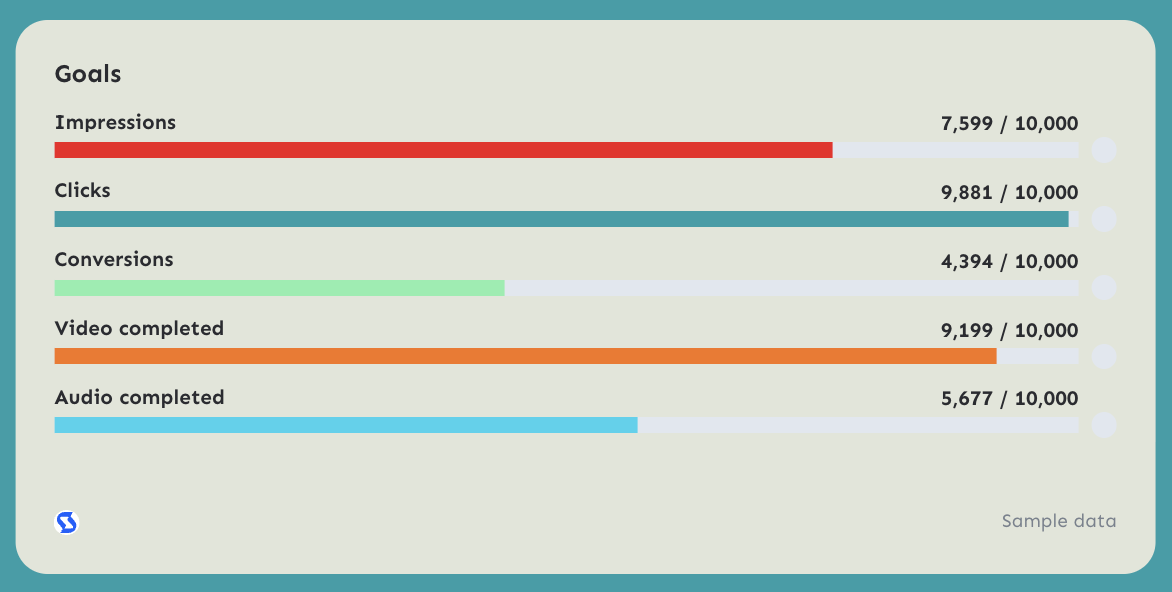
Your StackAdapt dashboard template should include a goals vs. actual module.
- Impressions goal
- Clicks goal
- Conversions goal
- Video completed goal
- Audio completed goal
3. Performance Summary + Insights
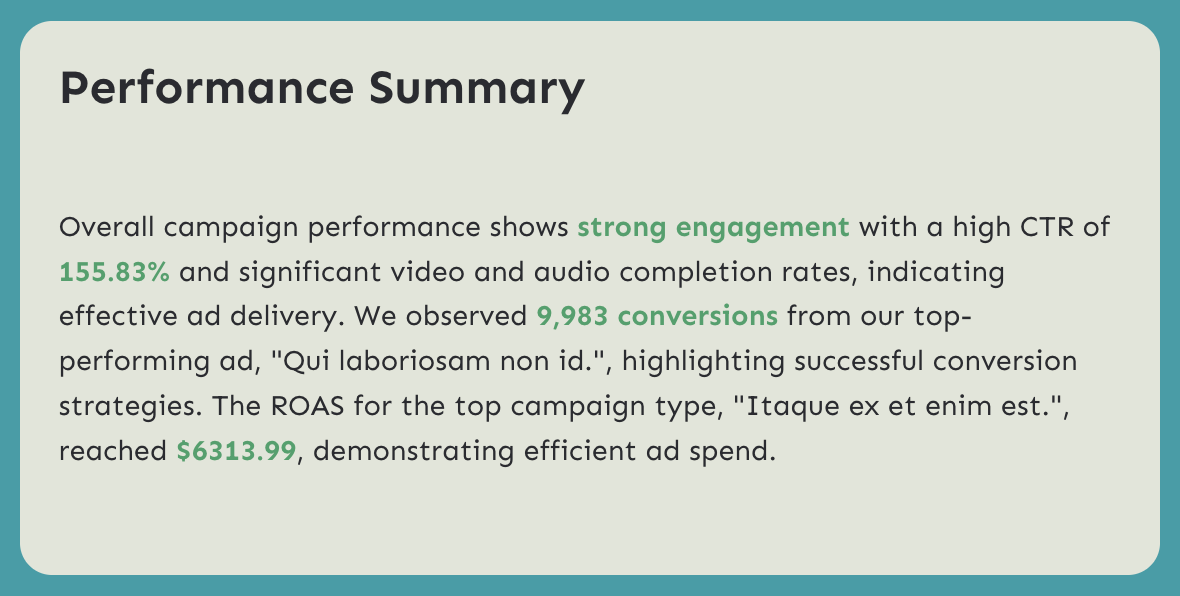
Add a written performance summary widget. Include:
- Highlights (e.g., high CTR, strong ROAS)
- Top-performing campaign
- Top-performing ad
- Optimization direction
This is where Whatagraph IQ can help you save time. It auto-generates actionable insights based on your connected data instead of having to manually write them out. No hallucinations.
One of the biggest mistakes that marketers make when creating reports is just adding screenshots of performance charts without any context or analysis. Your role is to be a non-fiction storyteller. - Janet Mesh, CEO and Co-Founder, Aimtal
4. Impressions vs Clicks Over Time
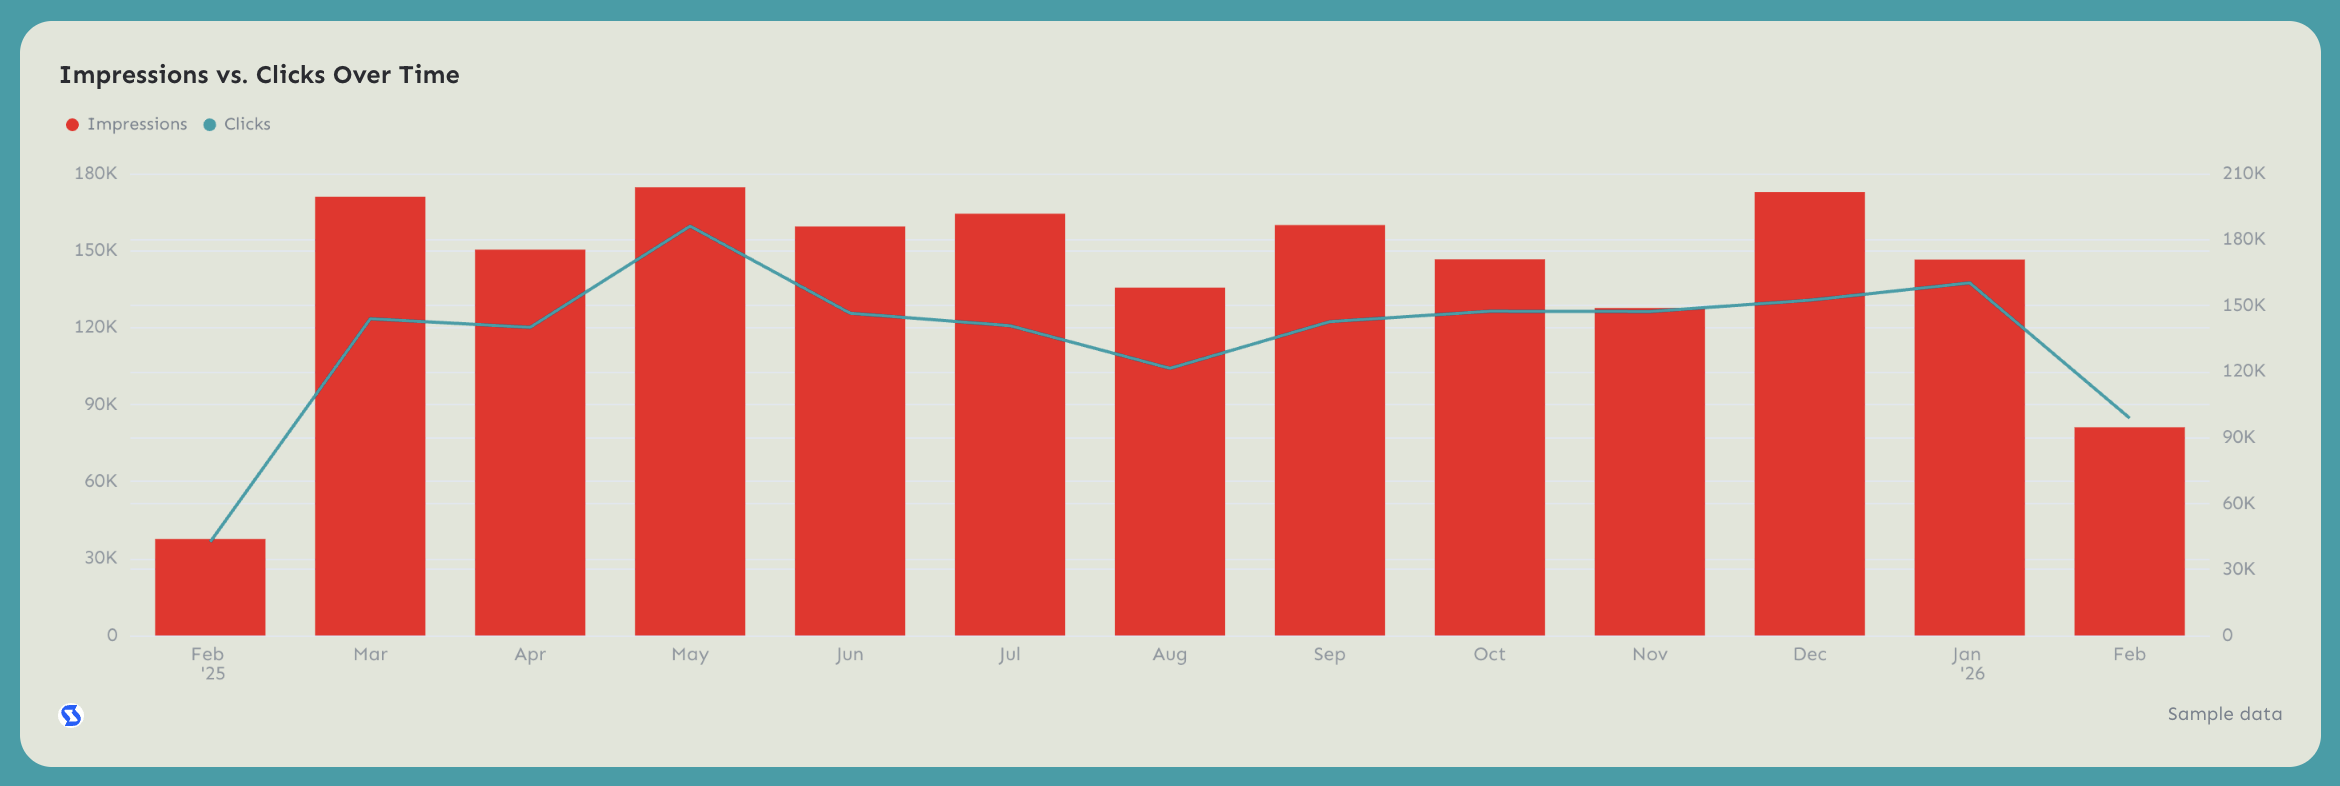
The template includes a time-series dual-axis chart showing:
- Impressions (left axis) - bar graph
- Clicks (right axis) - line graph
This helps visualize:
- Engagement consistency
- Seasonal spikes
- Delivery pacing
- Campaign fatigue
Optional: add Conversions as a third line.
5. ROAS Breakdown
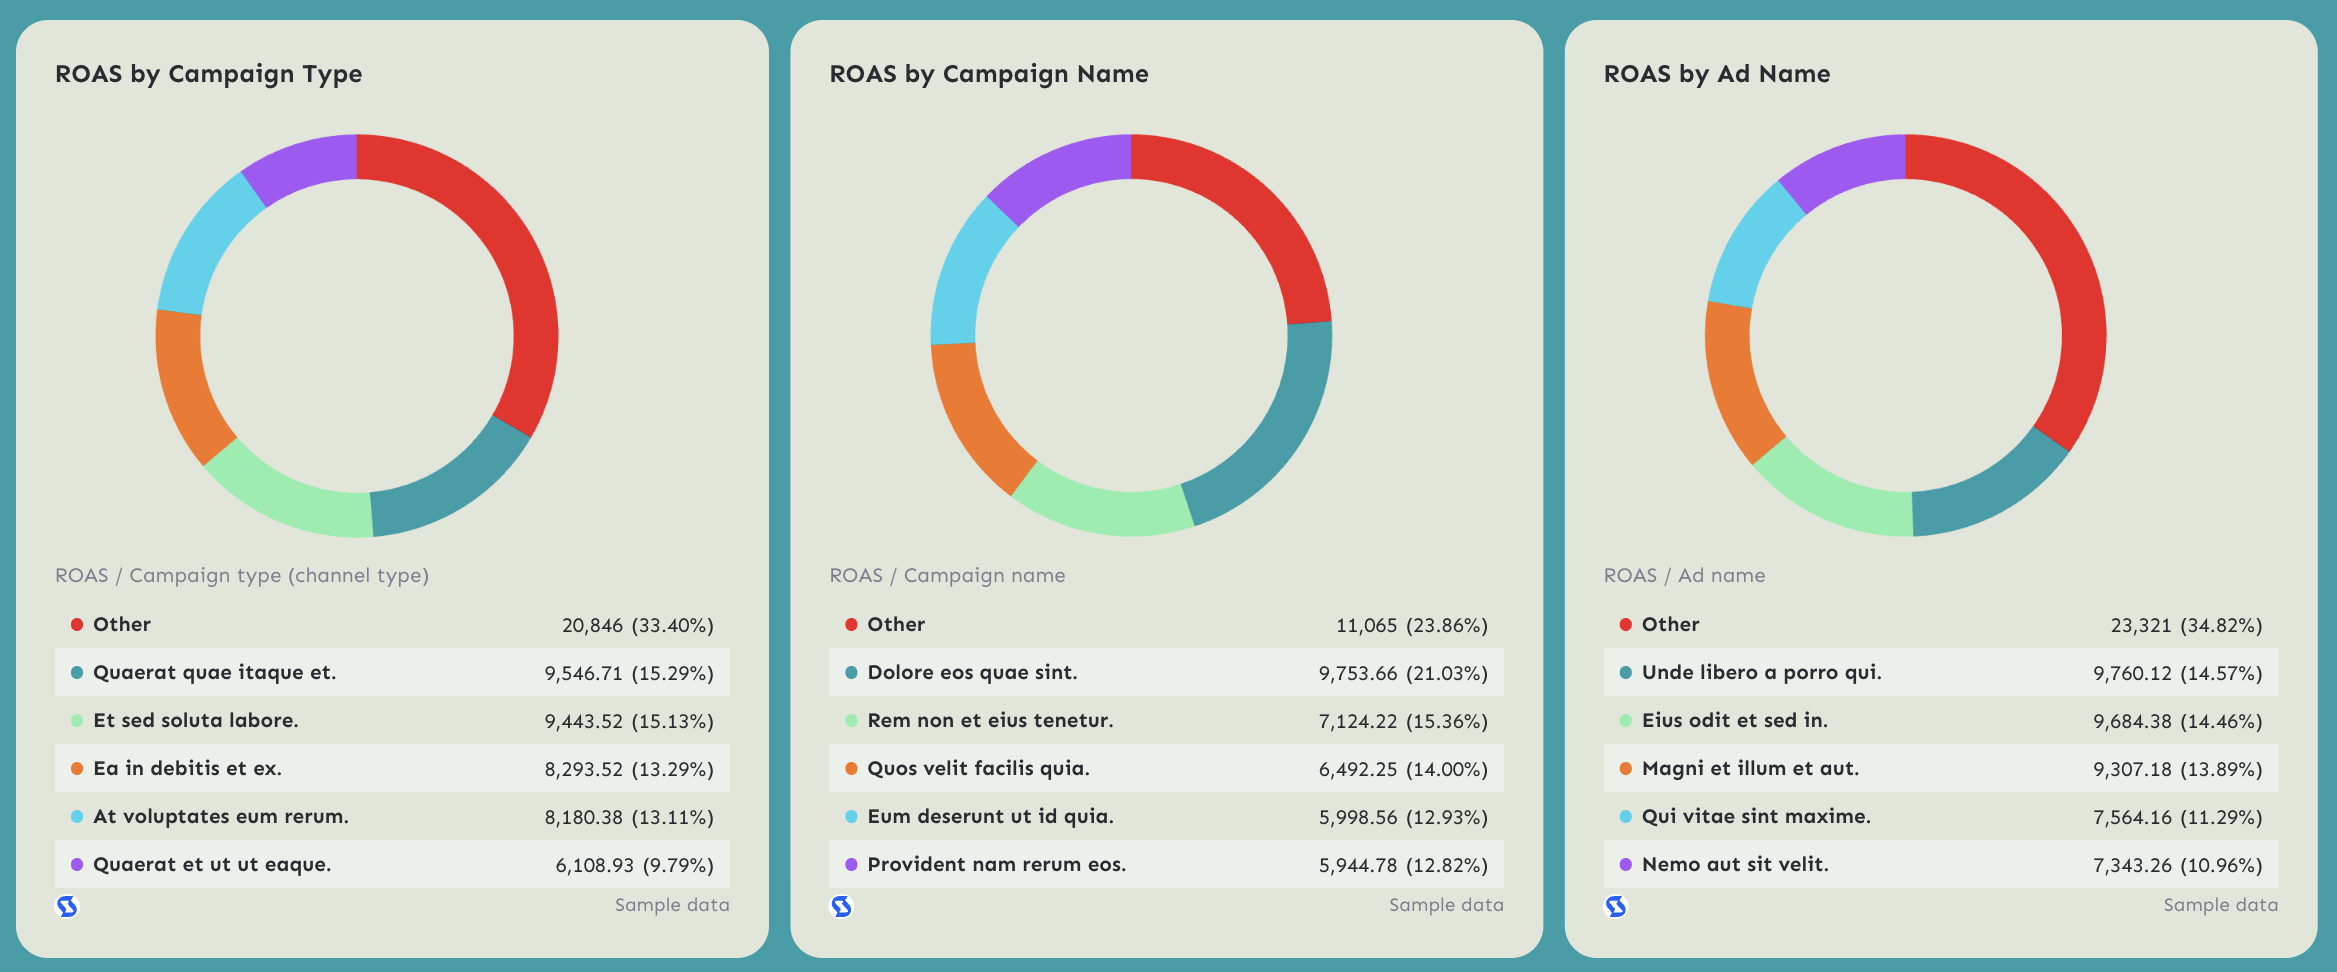
Programmatic advertising lives and dies by ROAS.
The template breaks down:
- ROAS by Campaign Type
- ROAS by Campaign Name
- ROAS by Ad Name
Visualizing ROAS this way helps you:
- Identify top spend drivers
- Reallocate budget
- Optimize faster
This section proves return on ad spend clearly.
Most clients don't care about every minor metric; they want performance related to buying revenue or leads, customer acquisition, and the like. I build reports around insights and trends rather than drowning clients in data tables. - Anton Kovalchuk, the founder of QliqQliq
6. Campaign Performance by City
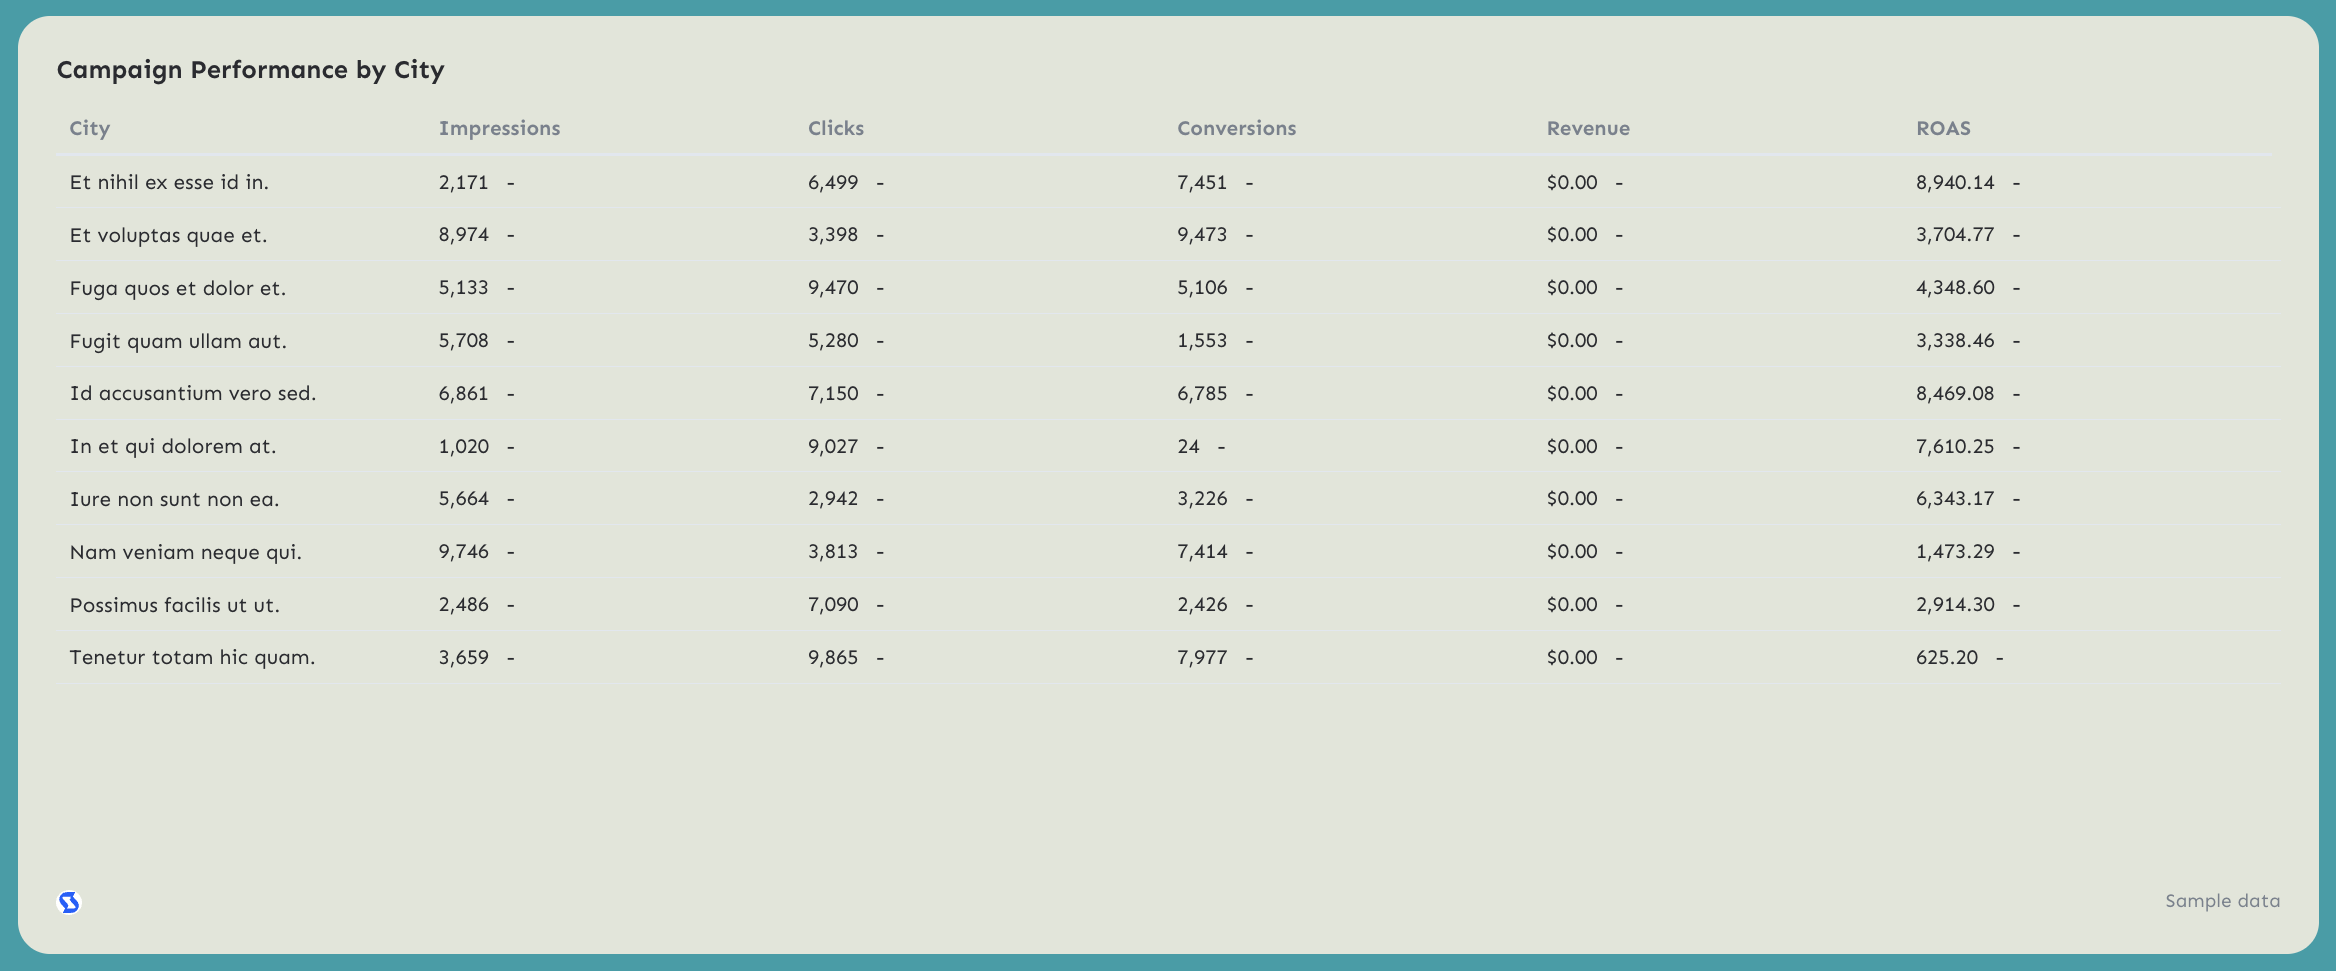
Break down Campaign Performance by city, region, or any other dimension your clients or stakeholders want to see.
Metrics to include:
- Impressions
- Clicks
- Conversions
- Revenue
- ROAS
→ Shift spend to cities generating higher conversion rate and ROAS.
7. Ad-Level Performance
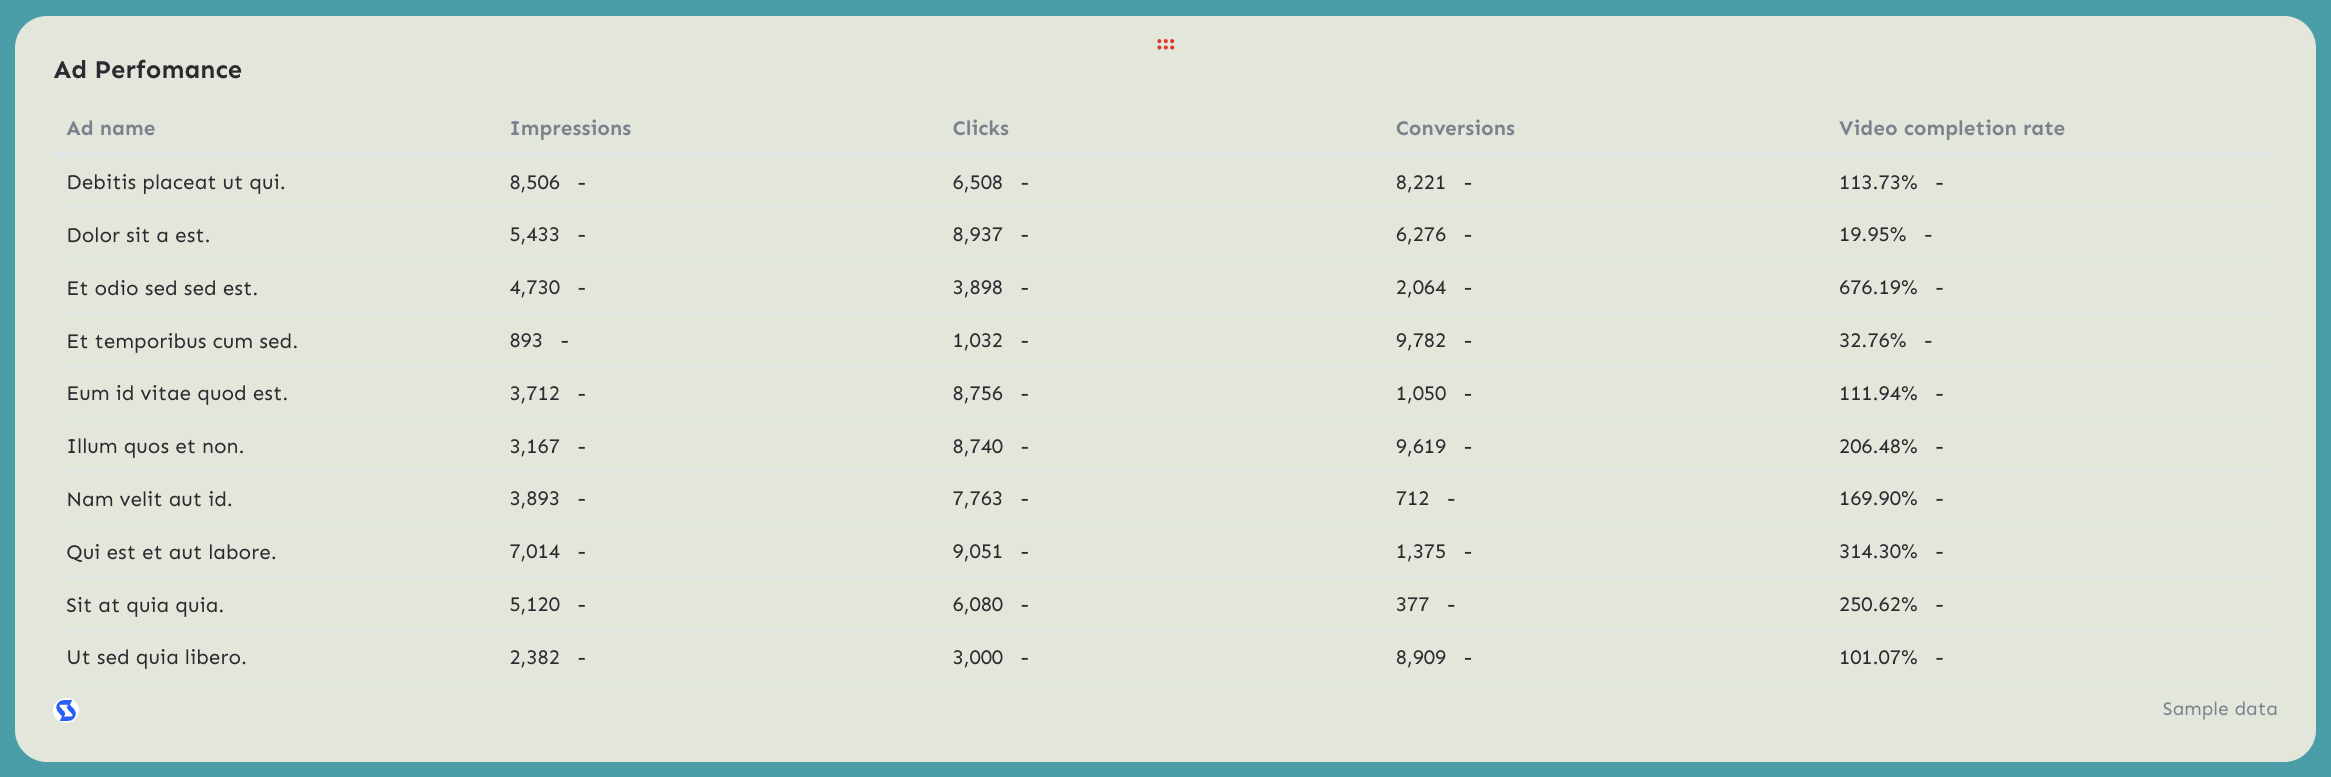
Break down performance by ad name. Include:
- Impressions
- Clicks
- Conversions
- Video completion rate
- CTR
- ROAS (if available)
This helps media buyers optimize ad creatives fast.
8. Device Breakdown (Audience Behavior)
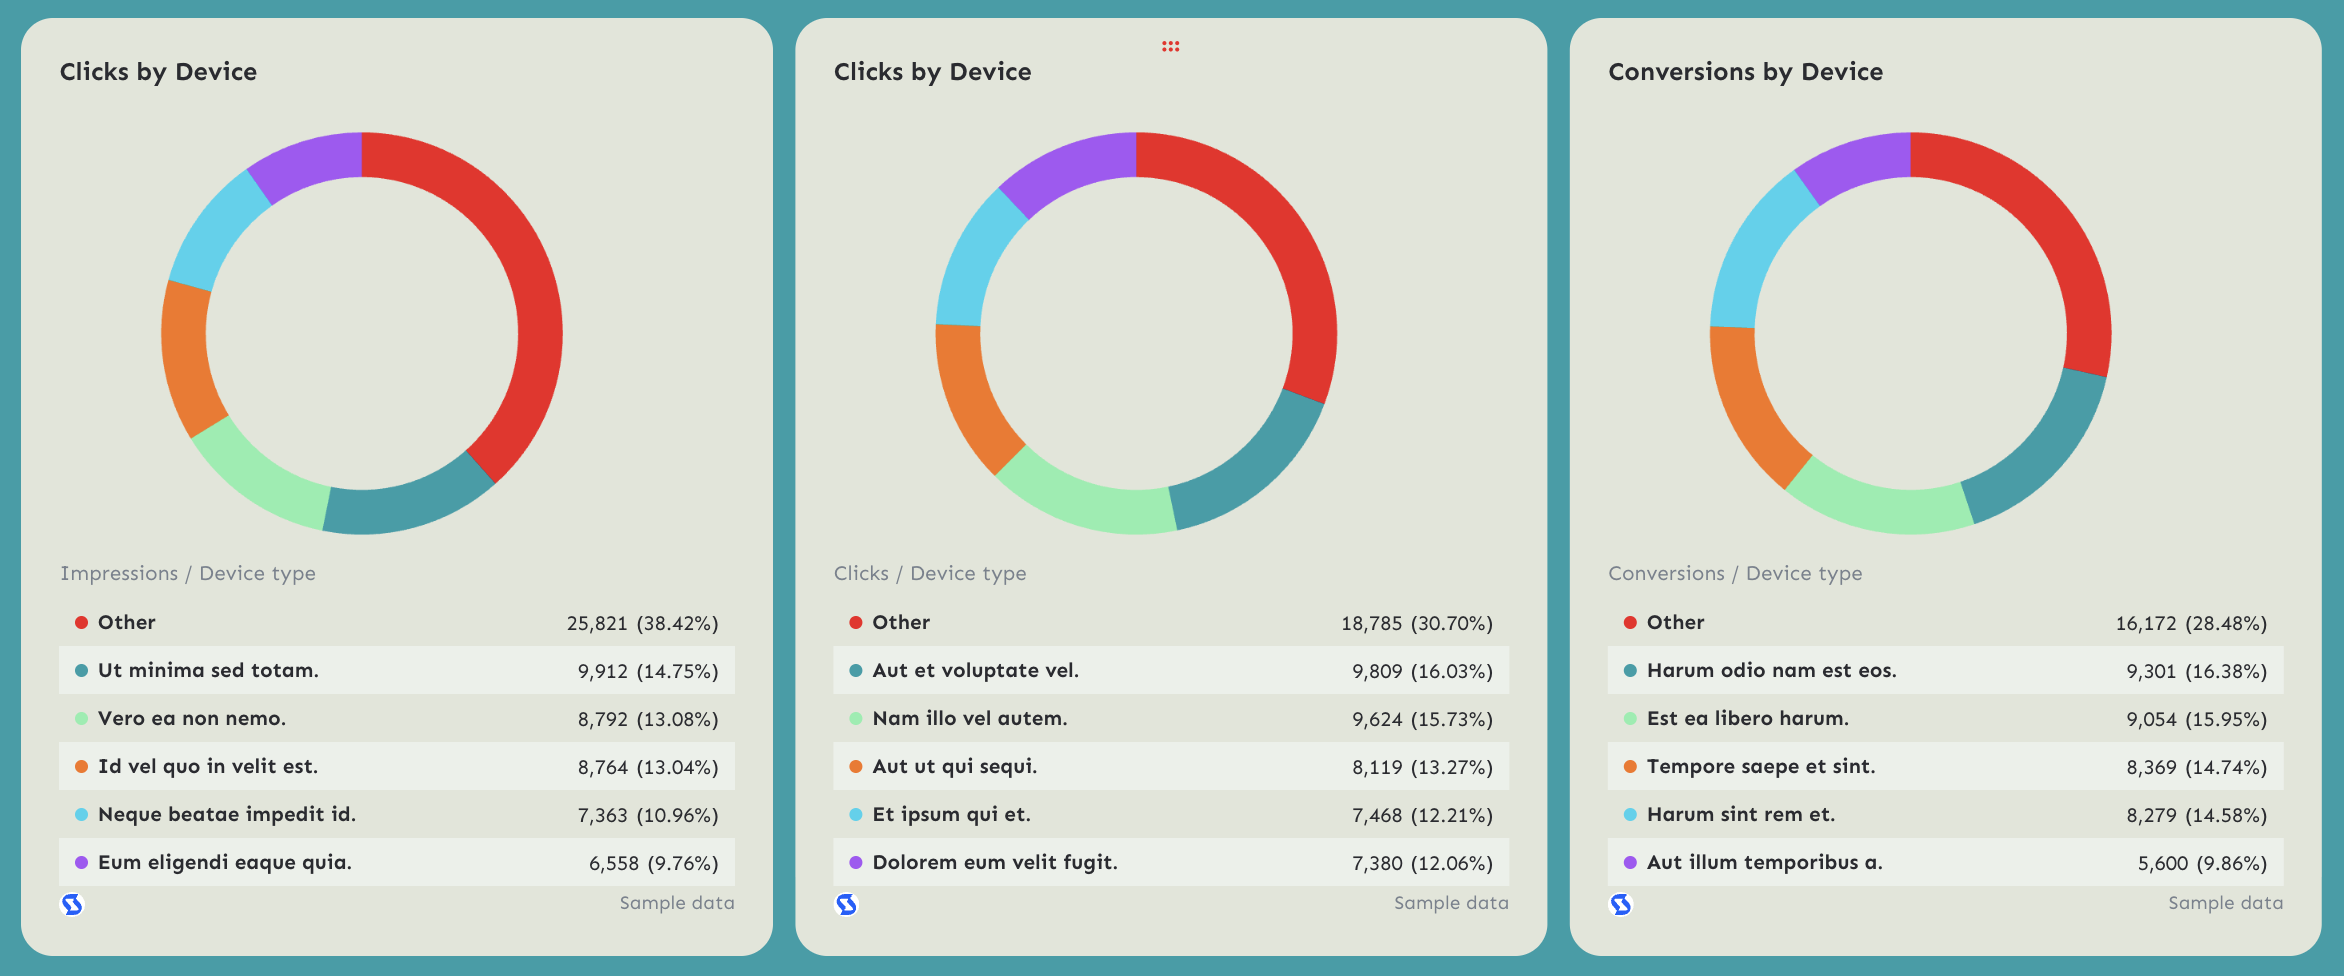
Visualize device performance using donut charts.
- Impressions by Device
- Clicks by Device
- Conversions by Device
Device insights help you:
- Adjust bids
- Refine targeting
- Optimize landing pages
- Improve conversion rate
This is especially important for cross-device digital advertising strategies.
9. Recommended Next Steps
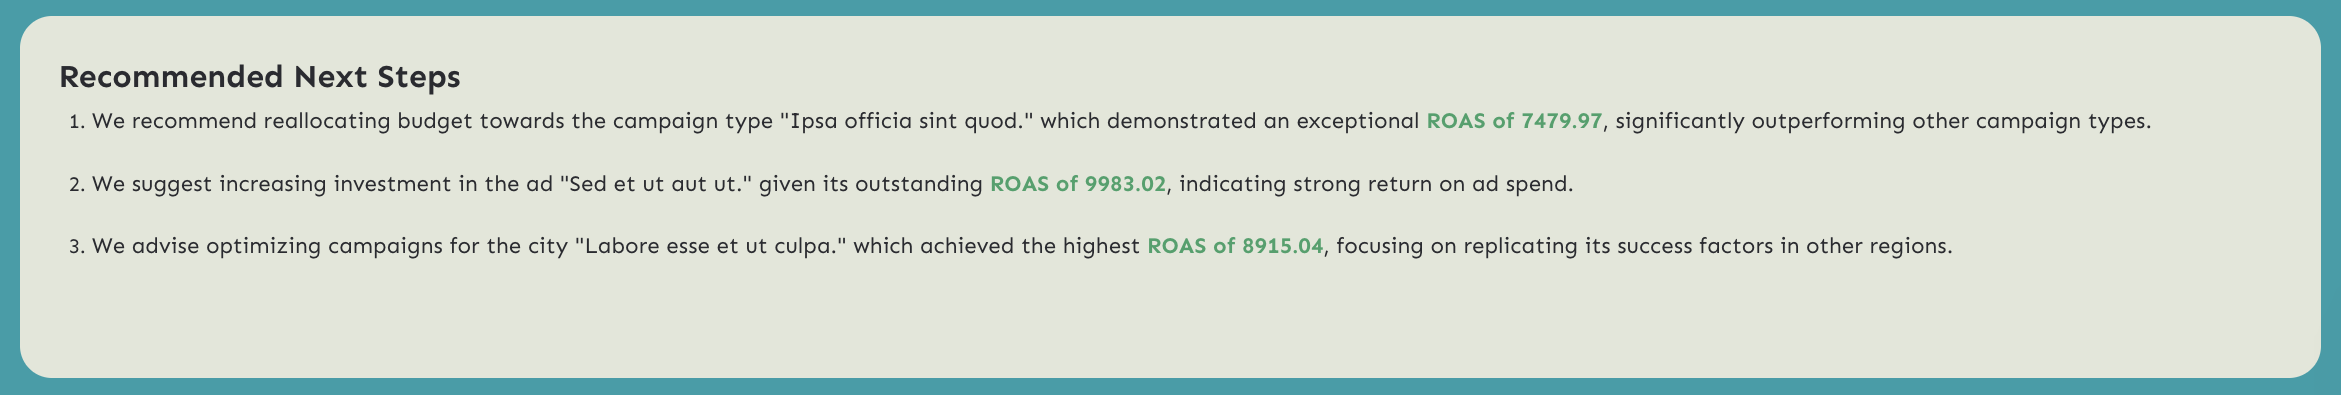 End your dashboard with clear optimization recommendations such as:
- Reallocate budget to high-ROAS campaign types
- Increase investment in top-performing ads
- Scale winning cities
If your report doesn't include 'what we're doing next', it's incomplete. - Alexander Mitrofanov, Senior Paid Media Specialist, Tag Worldwide