AdRoll Dashboard Reports: a How-to Guide for Agencies
Adroll provides a great solution for e-commerce-centric marketers. Diving deep into Adroll campaign performance metrics must be done to really understand what drives the best results. Create your very own Adroll campaign dashboard reports to make data analysis that much easier.

Jan 22 2021


Whatagraph is a tool used to aggregate digital marketing data and present it in a visually appealing way. This tool works with a variety of popular digital marketing platforms, one of which is AdRoll through its direct integration.
For those who spend a lot of time managing e-commerce campaigns on AdRoll, presenting performance data to clients or executives can be difficult. Building a personalized performance needs to be simple and time-efficient – this way, you can focus on driving better results.
We’ve prepared a walkthrough for you that simplifies your AdRoll campaign reporting process. There’s also a pre-built report template for you to use – the link is placed at the bottom.
Let’s begin.
What makes a report great?
A report provides zero value if it shares no data insights. In other words, you need something that transforms plain numbers into information.
- A client report should help facilitate effective decision-making. It improves collaboration and information transferring;
- Reports must guide your client’s (or executive’s) attention to the key metrics and campaign activity;
- Add context and clarity if the person you’re reporting to isn’t present during your day-to-day activities.
So, where should you begin when creating an AdRoll report?
Start the report off with KPI’s
Chances are, you already have some specific KPIs in mind that gauge effectiveness of AdRoll campaigns. Without KPIs, your efforts as a marketing specialist are nearly impossible to quantify.
So, let’s look at how your budgets are performing. Is the money spent bringing in customers and converting traffic?
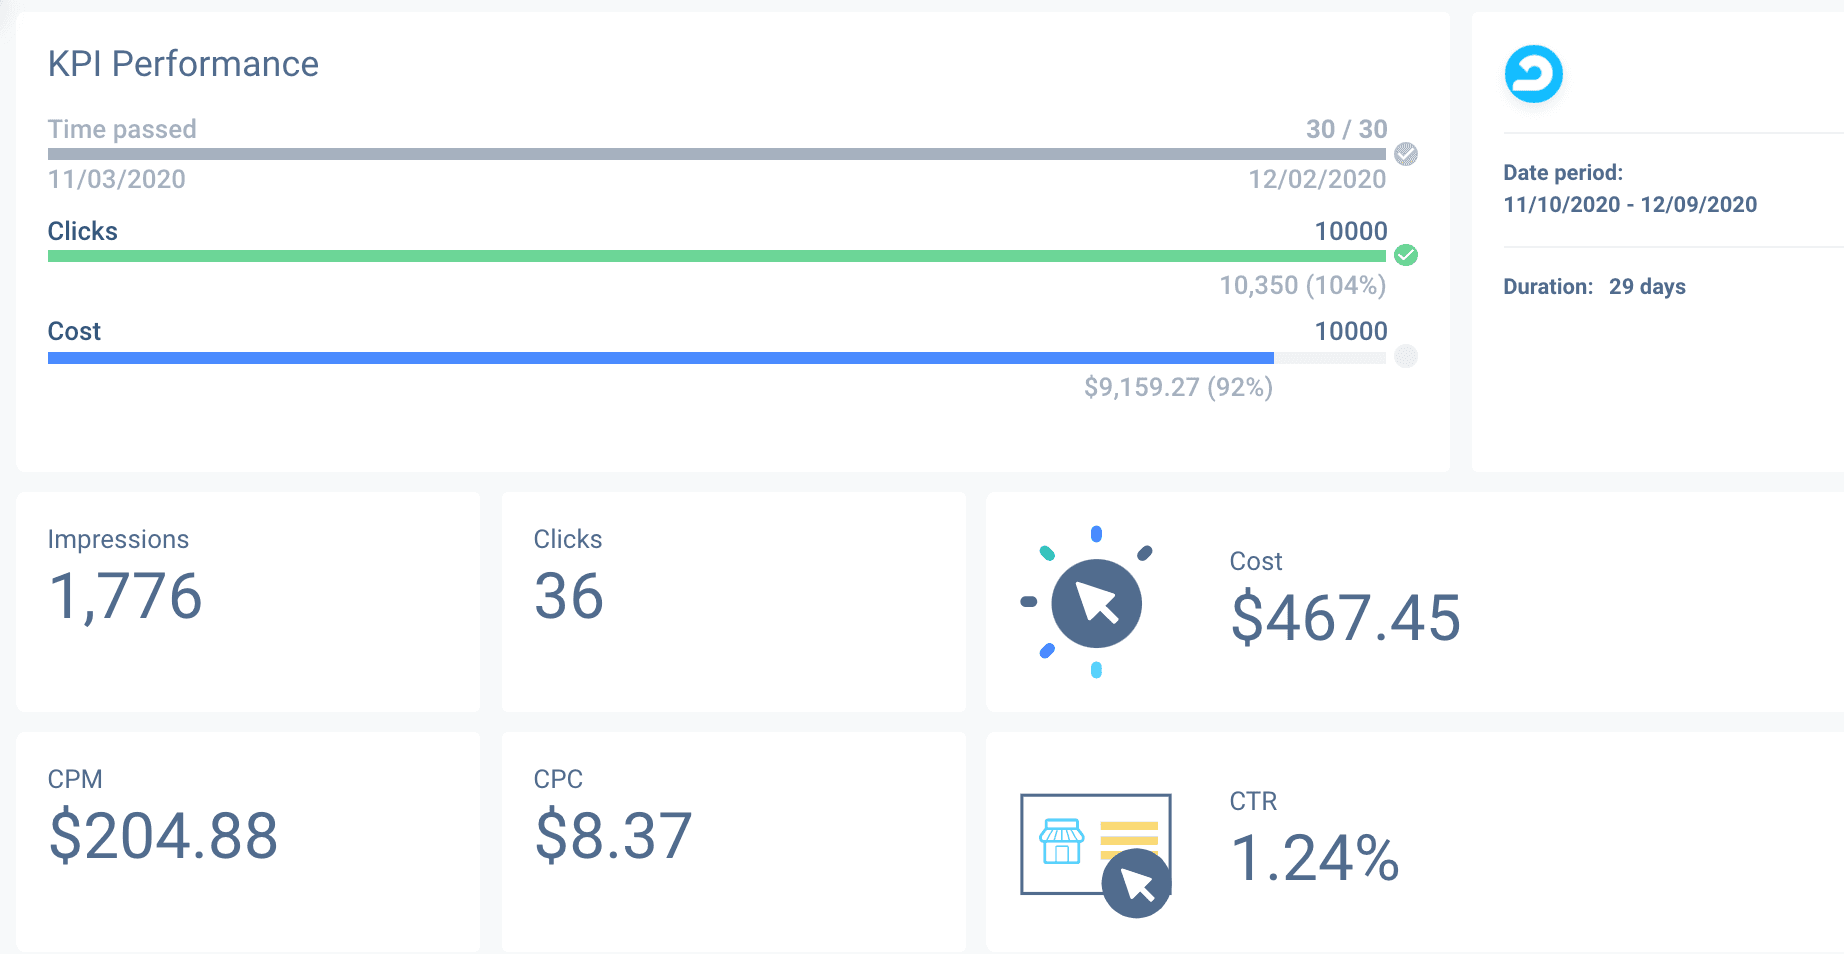
In the example above, we placed the essential metrics at the top of the report. It allows you to measure expenditures against CTR and impression targets.
The top-left portion of the overview is goal tracking. Clearly illustrated goals and current standing is essential when disclosing your KPIs. CTR is another KPI that needs to be within the top of the report. After all, CTR dictates just how compelling the ads are and if they captivate your audience’s attention enough for them to click.
Compare KPIs against previous reporting periods
To measure progress effectively, provide a date comparison option on any performance report you create.
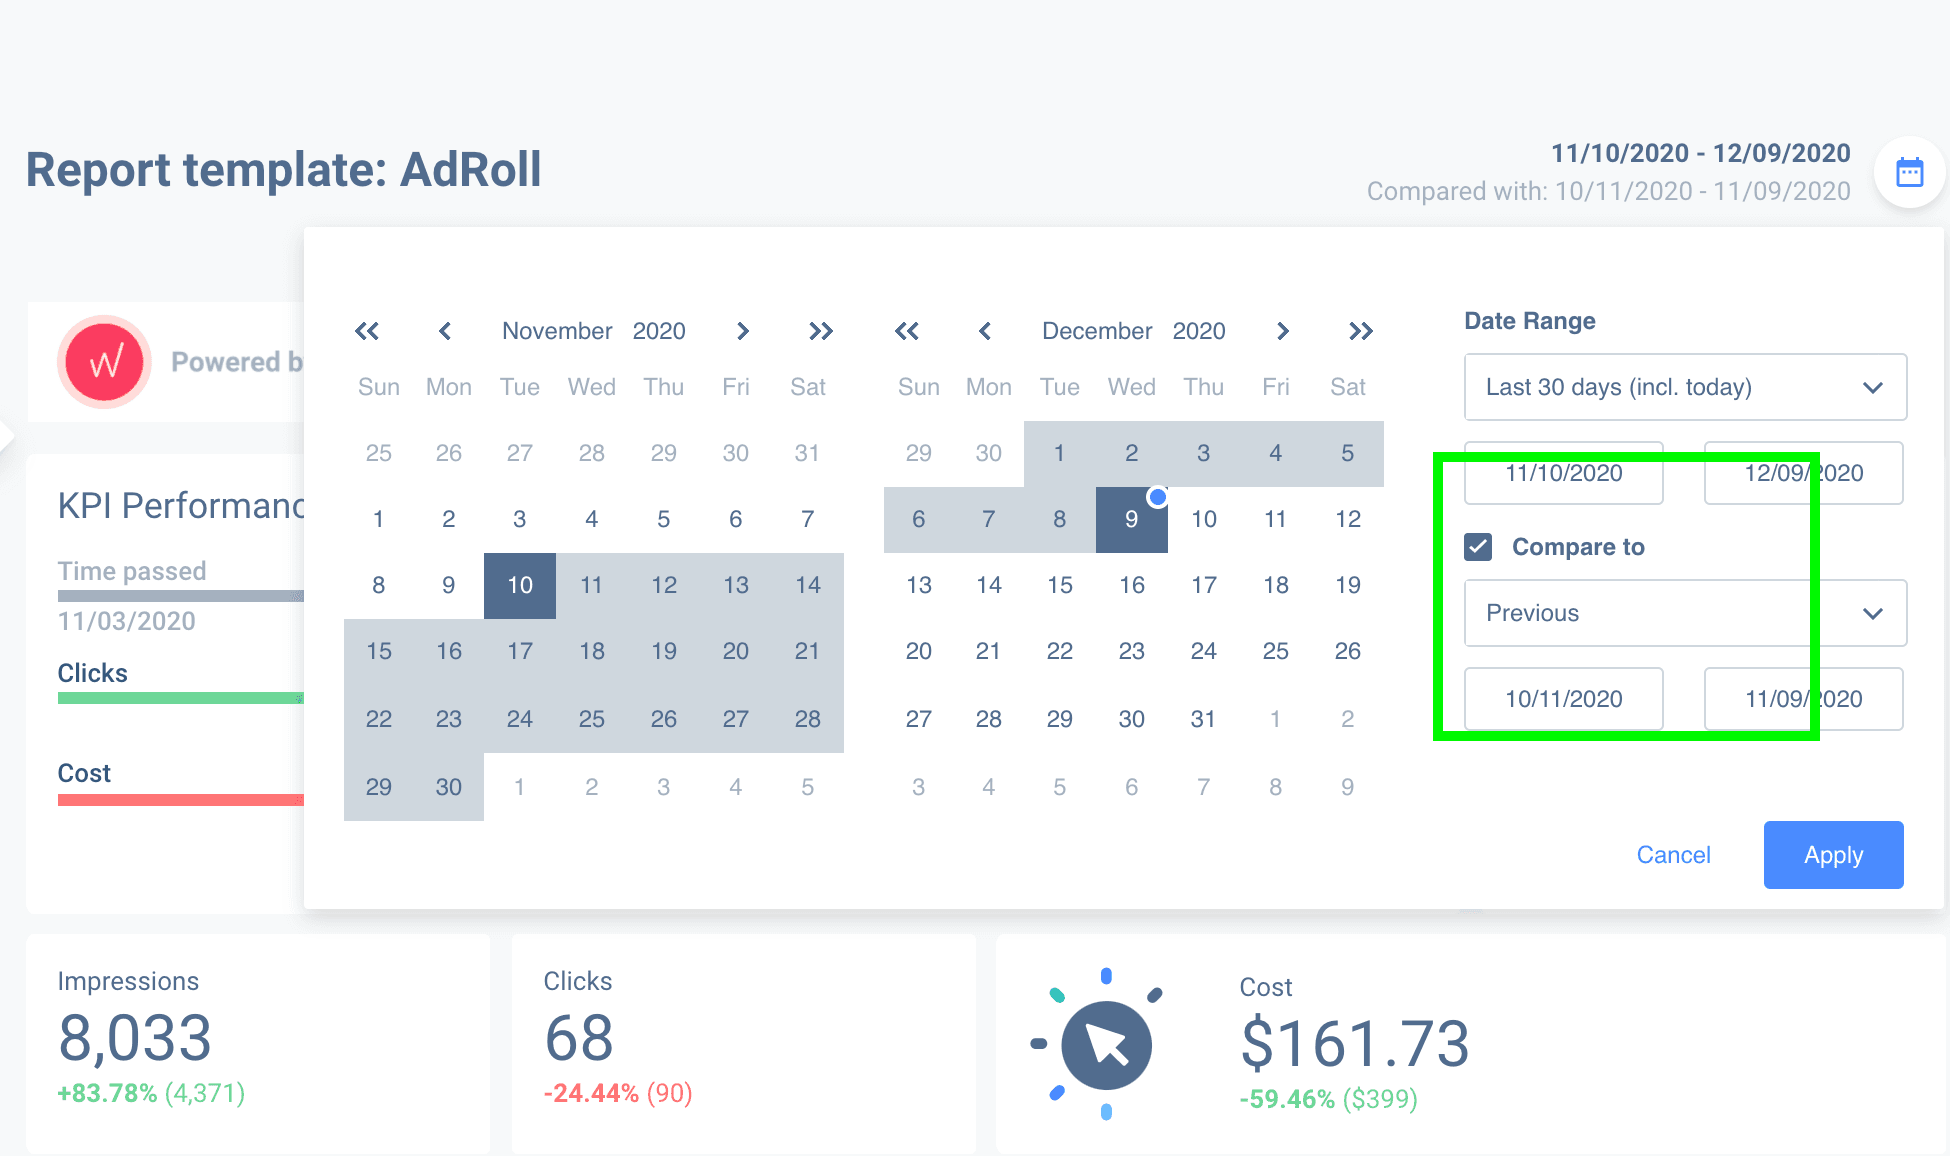
It helps you and your client (or an executive) understand performance metrics and their development throughout multiple reporting periods.
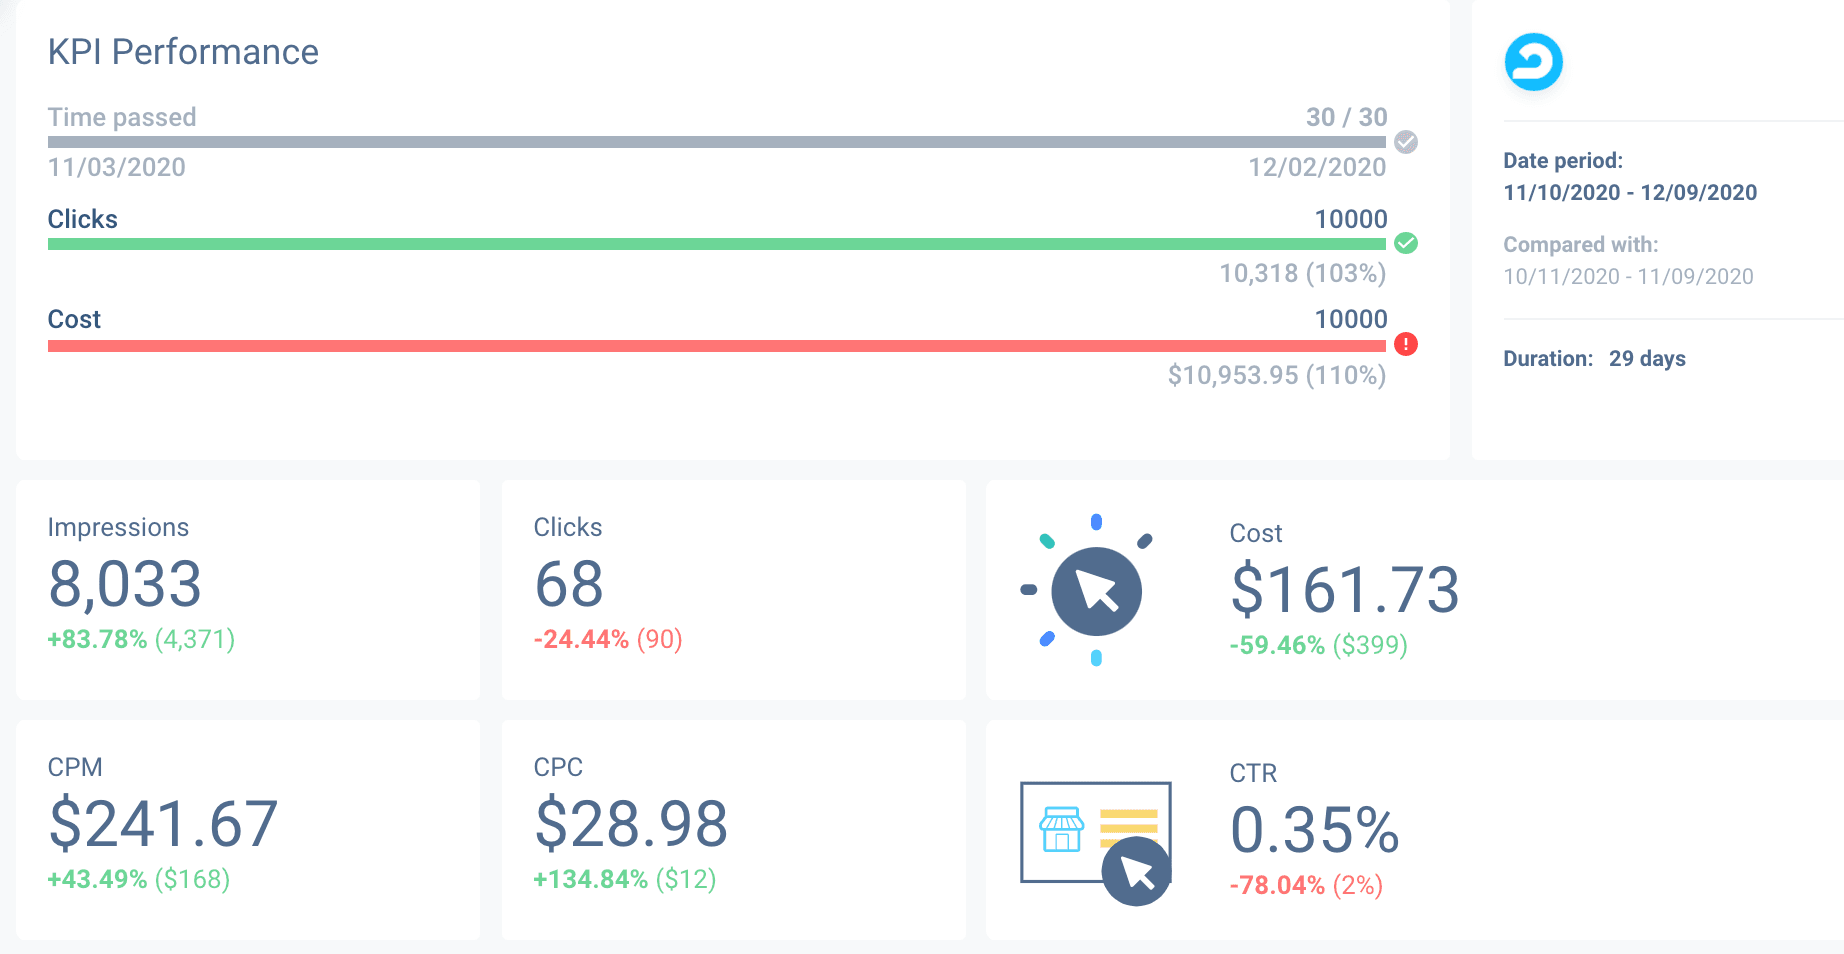
In our example above, the growth % along with real numbers are all clearly labeled under the current metrics.
Daily campaign performance
Some clients or executives may also take an interest in daily campaign progress. That’s perfectly normal and can give some additional insight into what days perform better and see fluctuations of the day-to-day activity.
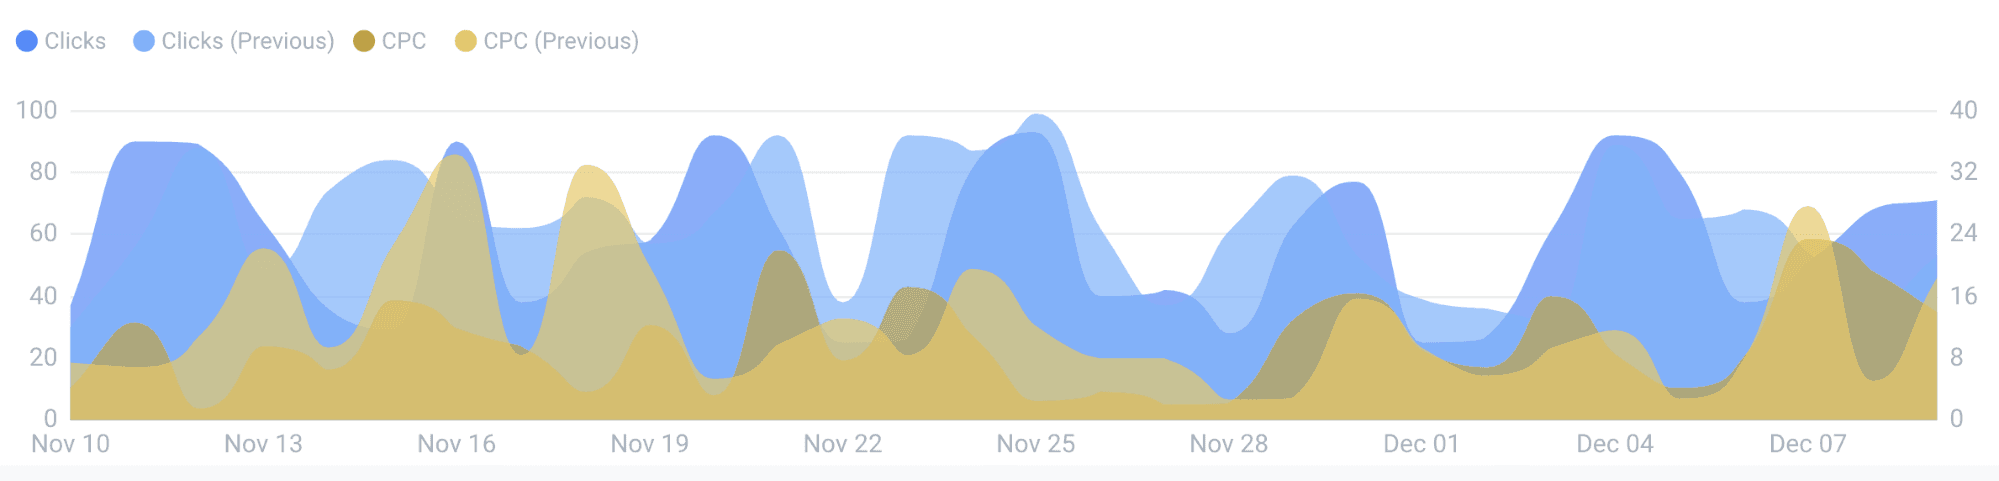
Having a clear graph to illustrate AdRoll campaign progress is paramount to the overall report – don’t overlook this.
If you deliver campaign performance reports by email, being able to leave detailed comments on the report is essential. It provides additional context to specific situations, conversion fluctuations. This way, a client doesn’t have to reach out to you for further clarification – convenient for both parties, isn’t it?
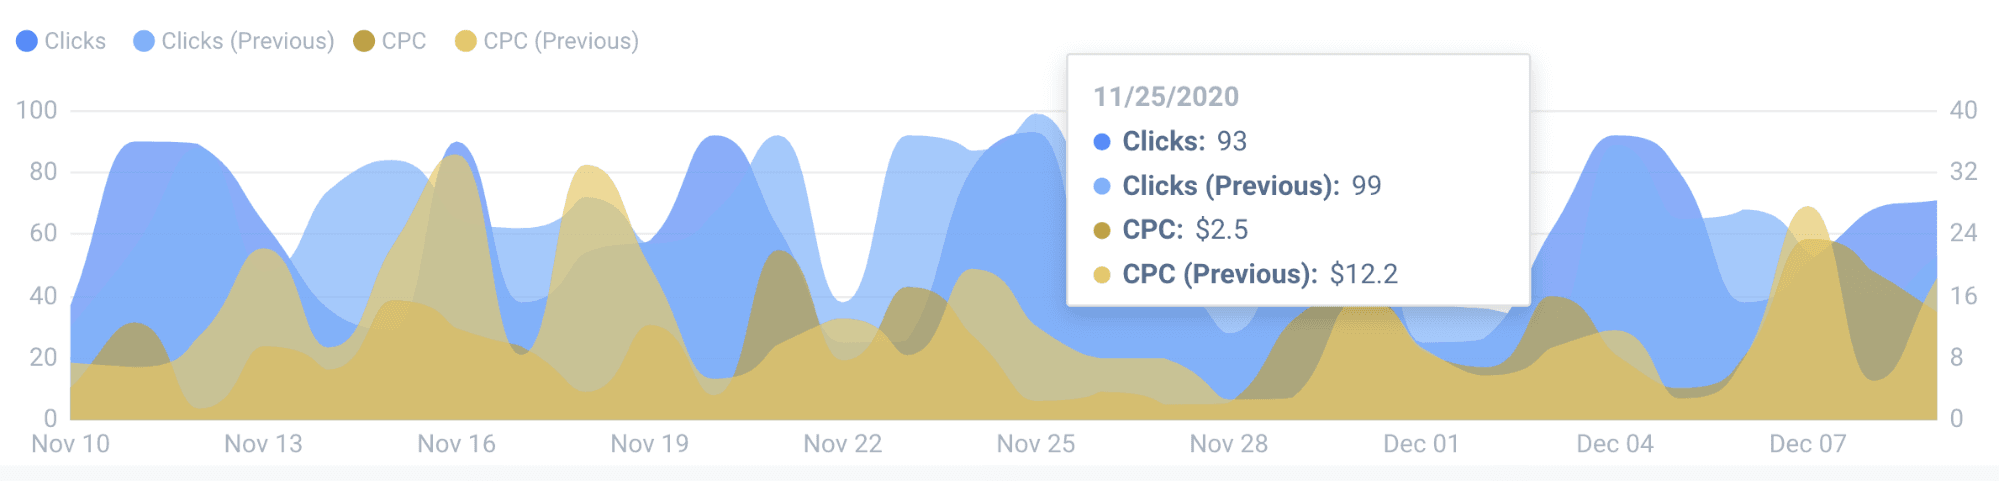
As you can see in the example above, CPC took a massive dive on November 25 while clicks remained stable. Leave a comment telling the client or an executive what you did to cause such a result.
Building insightful reports with context and details is a great way of creating long-lasting relationships with your clients.
Assess specific campaign performance
Not all of your campaigns are created equally – they all have their nuances and perform differently. In addition to the big-picture, aggregated data, it’s wise to break down individual AdRoll campaigns’ performance within the report.
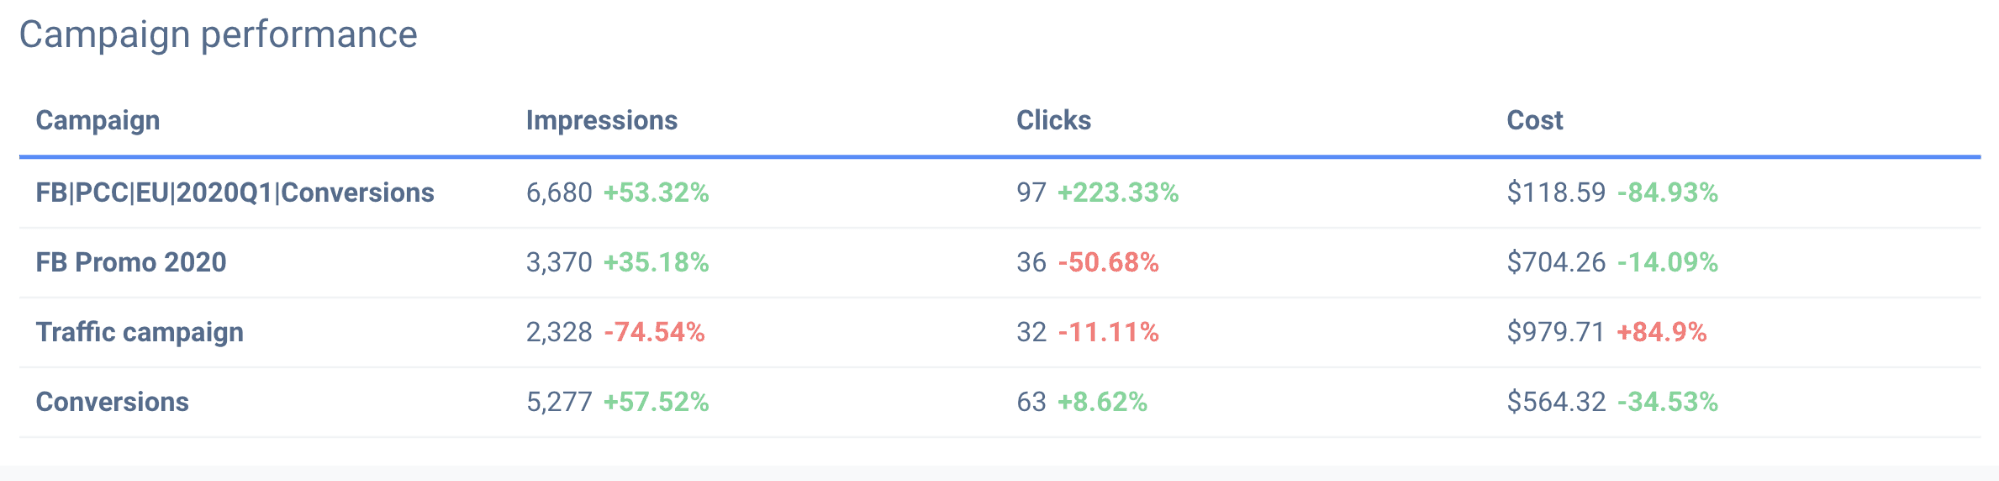
This data is relevant to you as a campaign manager and gives valuable insights to your client. They may wish to look deeper into which campaigns perform best and what budget allocation looks like.
Clicks and impressions aren’t your only problem. Having adequate design and content on the webpage is what helps convert visitors into customers. Campaign metrics help you further improve ad copy and reallocate budgets to the most effective campaigns.
Metrics must tell a story
Whether you’re reporting to your clients or firm executives, your report needs to tell a story. All of this rests on two things – data and visuals.
Data is used to showcase results and explain the reasoning for specific actions that you’ve taken. Most people – especially in marketing – aren’t too keen on making changes if the change is not supported by data; hard numbers.
Visuals are there to help translate data into something that’s easier to digest. The simple reporting process you’ve come to dread is turned into extensive storytelling, engaging your clients and executives.
A tool with customization and pre-made templates is essential
Insightful client-centric reports are there to tell the story of your progress via visuals and precise information.
Great internal reports help your team monitor the current situation and quickly find any shortcomings within your processes.
You are welcome to try out our pre-built AdRoll dashboard template for free. We’ve already built the report for you: all you need to do is connect your AdRoll account, and your data will be extracted automatically. Enjoy!
Published on Jan 22 2021
WRITTEN BY
Mindaugas SkurvydasMindaugas is the SEO specialist at Whatagraph with experience in driving organic traffic and improving SERP visibility for industries like B2B martech, B2B and B2C finance. He loves to be at the edge of new developments by maintaining numerous contacts with other publishers in the SaaS niche. When he’s not writing he’s pushing our technical SEO strategies into implementation.