6 Best SEO Reporting Tools & Software for Agencies in 2026
Time is money in SEO.
That's why I’ve done the exhausting work for you—tested dozens of SEO reporting tools for agencies, analyzed hundreds of real user reviews, and evaluated six shortlisted solutions against the five key features marketers actually need.
Find out which platforms really deliver—before you waste another weekend manually stitching together reports from a dozen different platforms.

Jun 22 2026●10 min read


When I was Head of Content at an SEO agency, I hated having to put together reports.
Clients wanted weekly updates about which articles are ranking 1 to 3, how much traffic they’re bringing in, how many impressions they got, how many leads they’re getting, etc.
So, every Friday, I had to:
- copy data from three different platforms: Ahrefs, GSC, and Google Analytics
- paste it into a Slack message
- type out performance summaries manually
…and repeat this entire process for every client we had.
It was so time-consuming that my entire Friday was dedicated just to reporting.
If only I had an SEO reporting tool that would do all this automatically…
If you’re anything like me, you want the same too.
In this article, I’ll help you find the best SEO reporting tool that automates reporting—and gives you back Fridays.
What features should agencies look for in SEO reporting tools?
According to Fluent's 2025 study, agencies spend 20-30 hours per client per month on reporting. For a 10-client agency, that's up to 300 hours a month - time that could go toward strategy, pitching, or actually improving campaign performance.
The right SEO reporting tool changes what your team does with that time. Here's what to look for:
✅ Integrations that cover your stack. Google Analytics, Ahrefs, Semrush, SE Ranking, Google Search Console - your tool needs to pull from all of them without manual exports or connections you have to babysit.
✅ Automation that runs without you. Scheduled reports, linked templates, and broken-source alerts. Reporting should be a background process, not a recurring task.
✅ AI that writes the narrative. Look for tools that generate performance summaries and surface recommendations automatically - so your team isn't writing the same analysis paragraph 15 times a month.
✅ MCP support. The best tools connect directly to Claude or ChatGPT via Model Context Protocol, so your AI assistant can answer questions using your actual client data - no CSV exports needed.
✅White-label reports clients actually open. Custom domains, logos, and branded email delivery. A report that looks like it came from a generic dashboard undermines the work behind it.
✅ Cross-channel data blending. SEO doesn't exist in a silo. Look for tools that let you combine search data with paid, social, and email in a single view - so you can show the full picture without stitching spreadsheets together.
As Henry Smith, the head of SEO at Dark Horse puts it: “Most clients won't care about vanity metrics, such as impressions or an average position increase, but rather how the work that has been completed is driving more traffic and revenue for the business."
The right SEO reporting tool helps exactly with that - showing only the metrics that map to business outcomes and leaving the rest out.
6 Best SEO Reporting Tools for Agencies in 2026
Here's a snapshot of our top 6 choices for SEO ranking reporting software:
| Tool | Best for | Pricing (Annual) | Key differentiator | MCP/AI |
| Whatagraph | Mid-size agencies managing multiple clients | Paid plans from $199/mo + free forever plan | Cross-client governed data layer; Whatagraph IQ + MCP server | Yes (IQ + MCP) |
| TapClicks | Enterprise agencies and media companies | Custom (~$599/mo+) | Full marketing ops stack (250+ connectors, ETL, AI agents) | Yes (tapAI, no MCP) |
| Databox | Teams needing real-time dashboards and BI | From $79/mo | MCP access on all plans, including free | Yes (MCP + Genie AI) |
| AgencyAnalytics | SEO agencies, per-client reporting | $20/client/mo | Built-in rank tracking and site audits, per-client | Yes (MCP + AI insights) |
| DashThis | Small agencies wanting simplicity | From $44/mo | Dashboard-based pricing, unlimited data sources | Limited (AI Insights add-on) |
| Swydo | PPC-focused agencies on a budget | From $69/mo | Per-data-source pricing; lowest entry cost | Limited (Swydo AI, no MCP) |
1. Whatagraph
Best for: Marketing agencies and teams that want an easy-to-use tool with powerful AI features that save them time and energy, and flexible pricing options
I can practically hear your eyes rolling from here. “Of course they put their own tool first!”
Look, I get it. This is our blog, and Whatagraph is our product.
But no tool is perfect, including ours, and I'll tell you exactly where Whatagraph shines and where it occasionally stumbles.
Best for: Mid-size agencies that want to scale client count without scaling reporting headcount
Whatagraph is a marketing intelligence platform built on one governed data foundation. The same numbers that power your client reports also power your internal dashboards, your BigQuery export, and your AI assistant - so CAC means the same thing on Monday as it does on Friday, in the client deck and in the AI chat.
Here's what that looks like in practice:
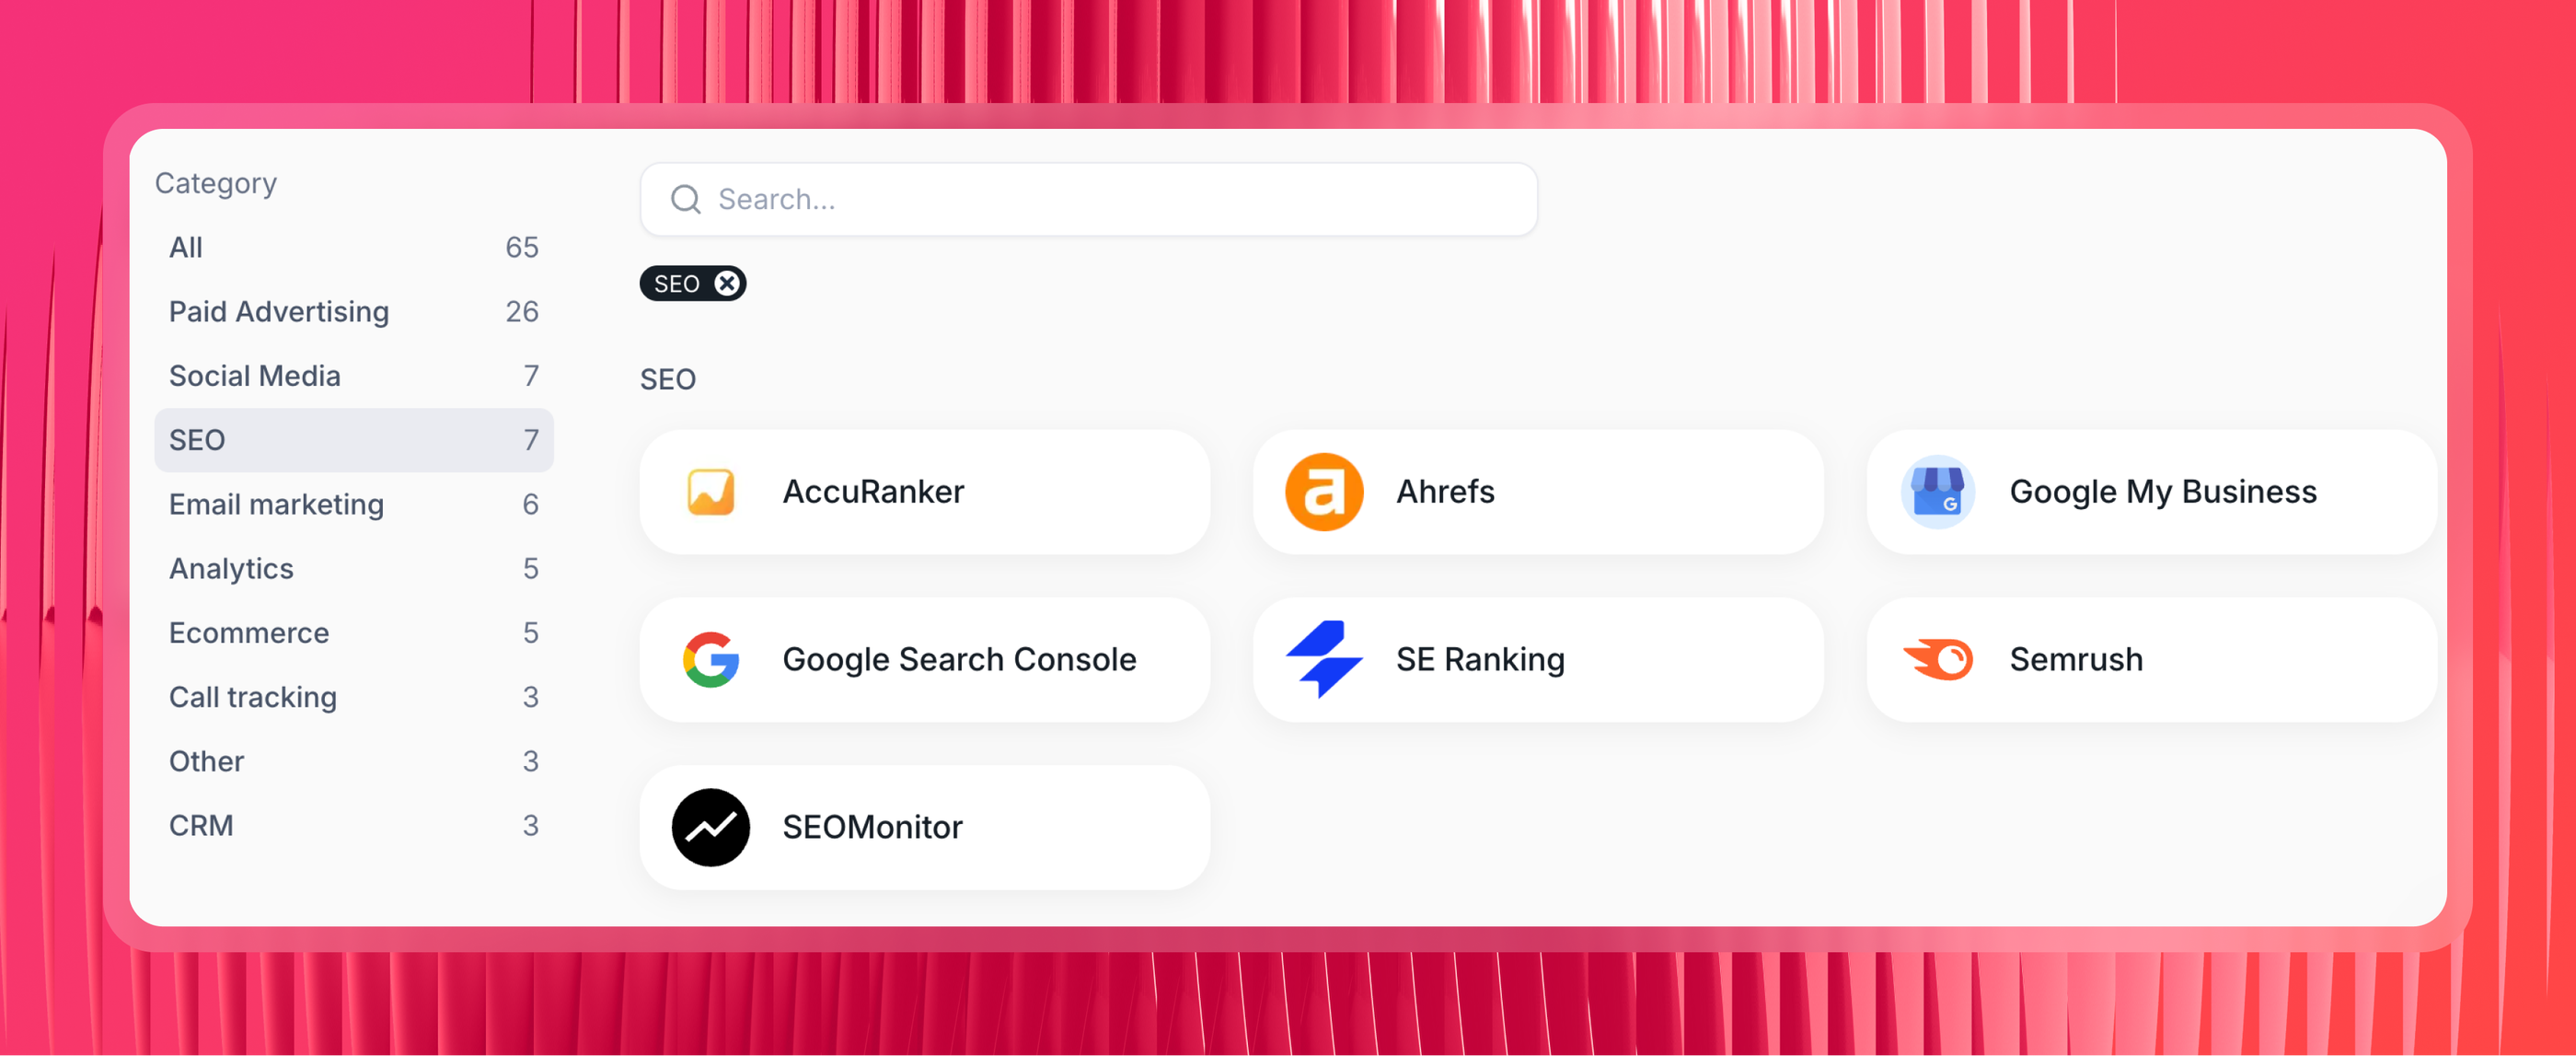
- 60+ native connectors: Fully managed integrations with 99.95% average uptime - no third-party pipelines to babysit. Includes Google Search Console, GA4, Ahrefs, Semrush, SE Ranking, SEOMonitor, AccuRanker, and Google My Business for local SEO. If a connector has a bug, Whatagraph's own engineers fix it.
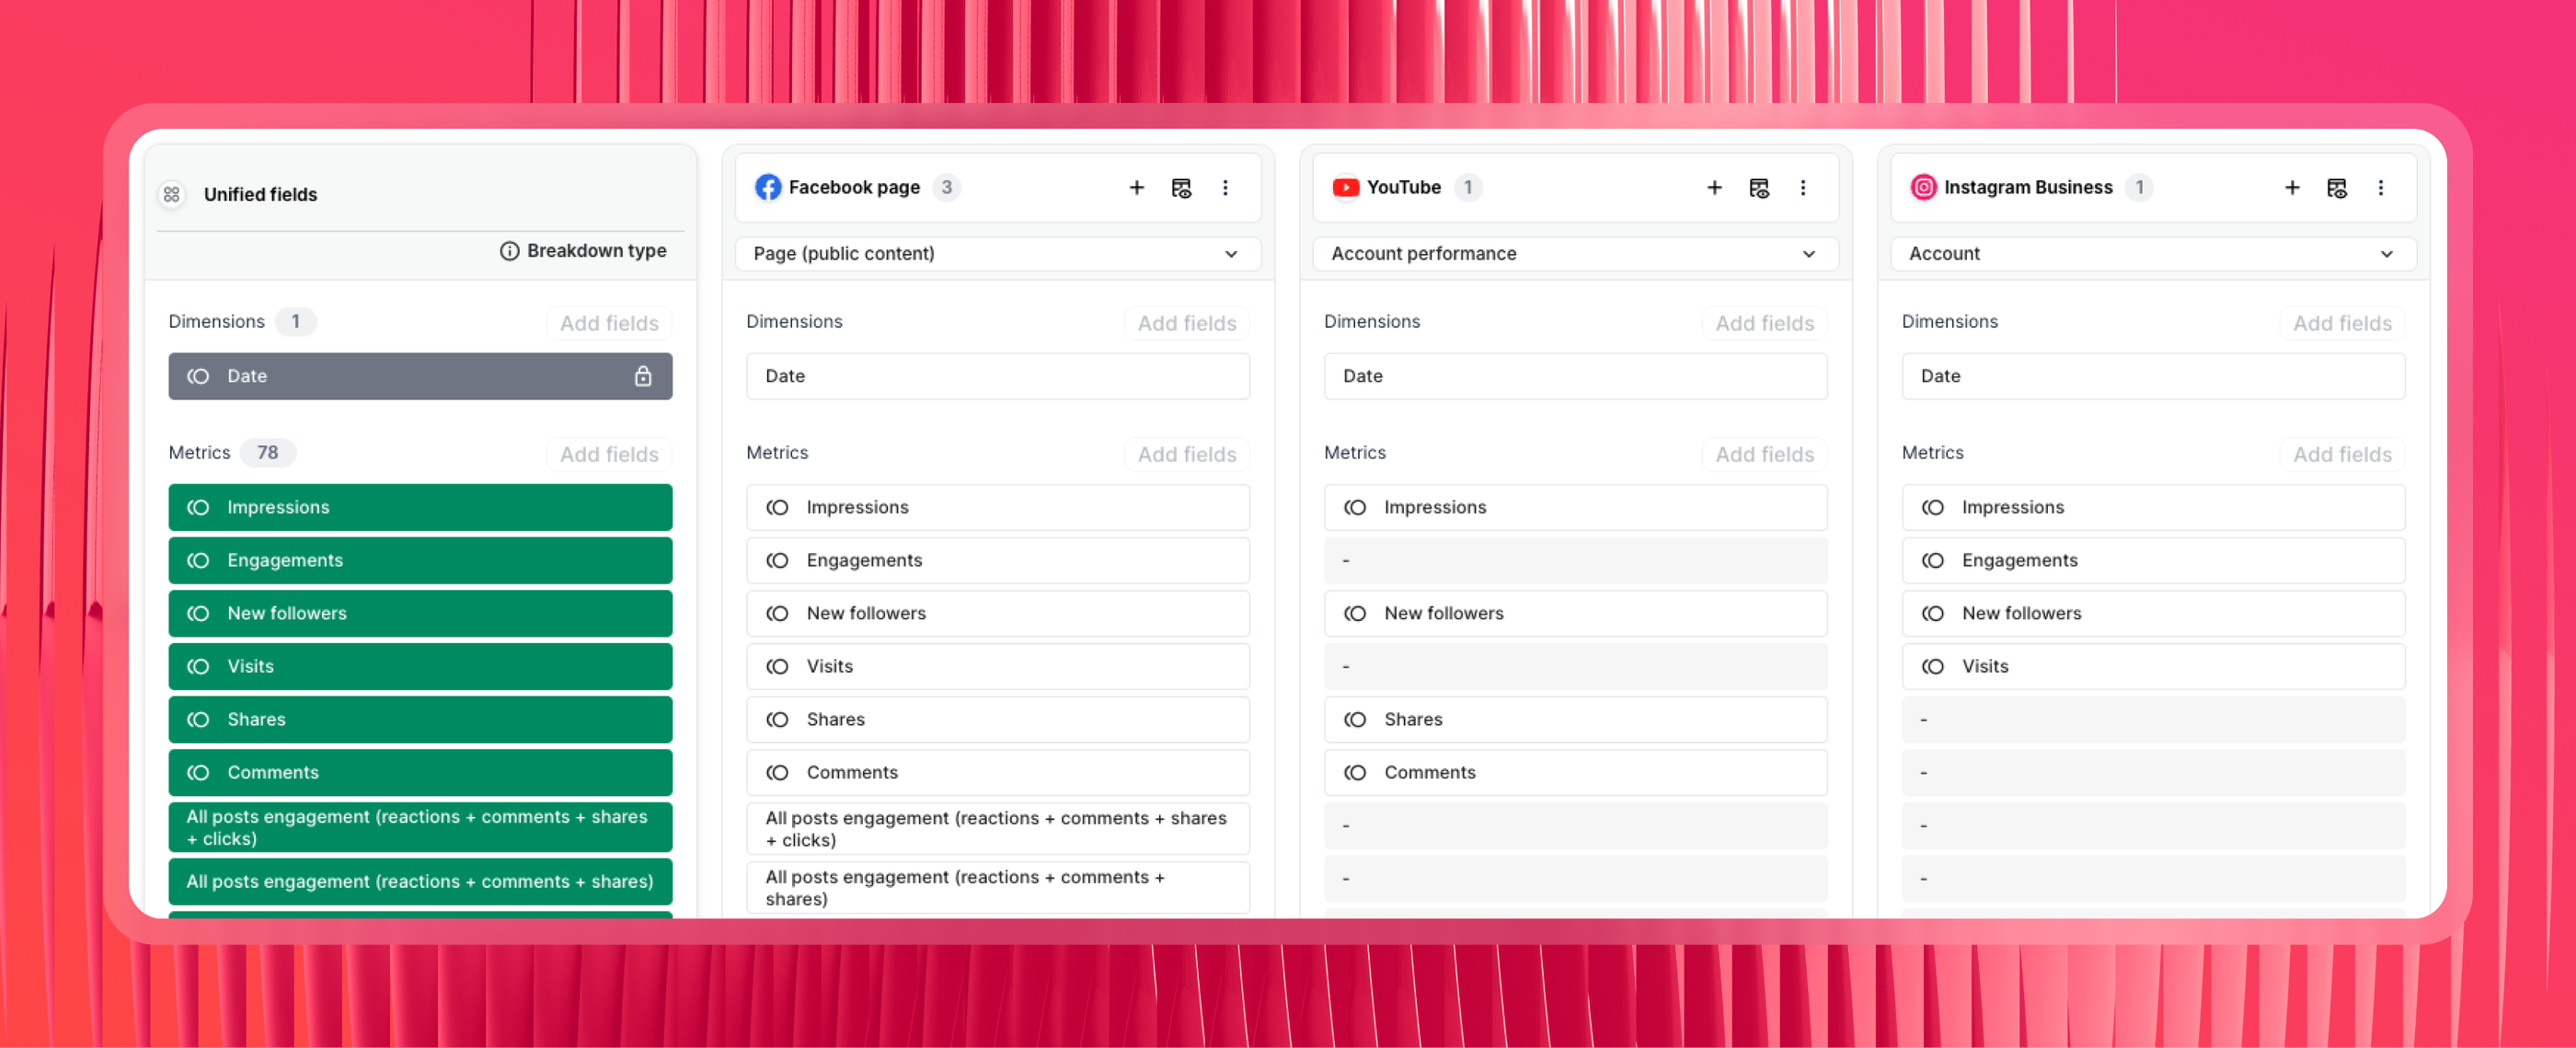
- Define your data once, use it everywhere: Build custom metrics, blends, and dimensions without writing code. Source Groups let you combine a client's Google, Meta, and LinkedIn accounts into one aggregated view - no custom formulas needed.
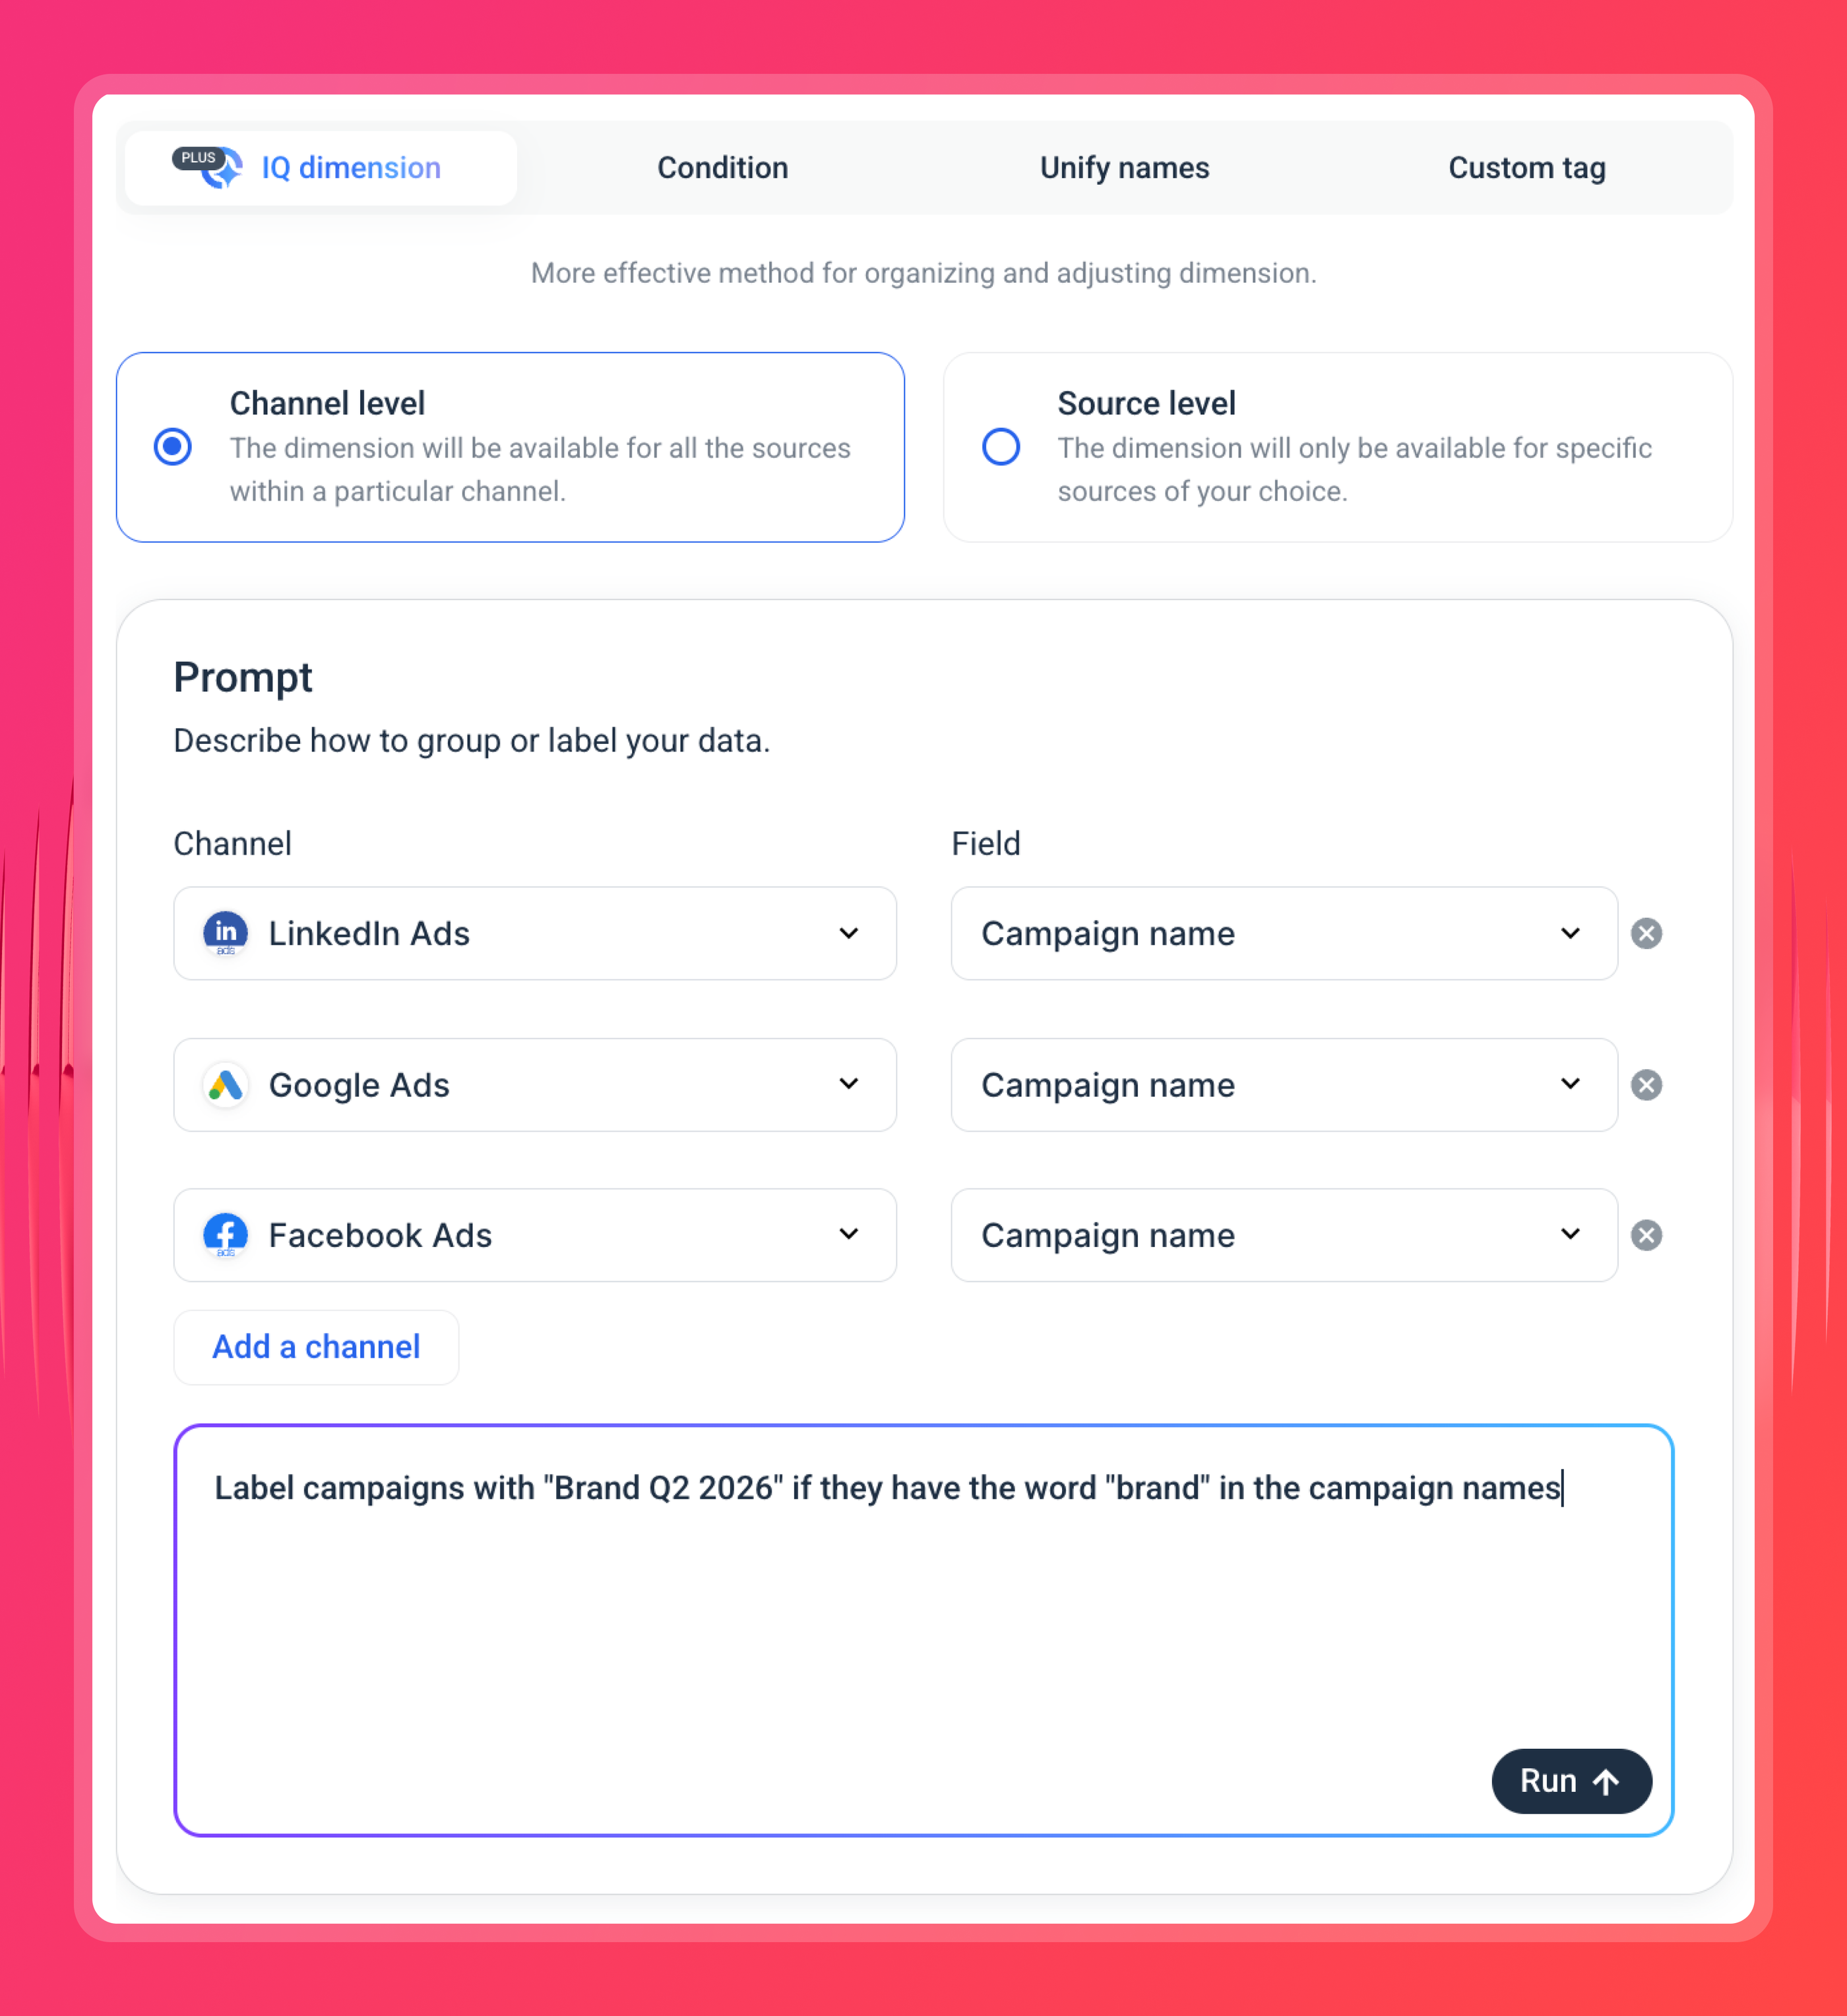
Whatagraph IQ can also generate a custom dimension from a text prompt. Once defined, those definitions flow into every report, dashboard, and AI answer automatically.
- IQ builds reports and summaries from a prompt: Describe what you need, and Whatagraph IQ builds the report, applies client branding from a logo or screenshot, and writes performance summaries directly inside it. Your team edits for voice and context; the data pull and narrative draft are already done.
- Linked templates scale your entire client base. Edit one master template, and the change cascades to every client report. Custom Tags let you label sources by region, account manager, or client tier and filter your entire portfolio in seconds.
- Connect your AI assistant to your governed data via MCP. Whatagraph's MCP server links Claude or ChatGPT directly to your data layer - custom metrics, blends, and dimensions already built in. Ask "which keywords lost the most rankings across all clients this week?" and the answer matches what's in your client report. Five-step setup, no coding required.
Here's how Maeva Cifuentes, Founder at Flying Cat Marketing SEO and GEO agency uses Whatagraph's MCP to analyze SEO data with Claude:
- Flexible report automation. Share reports as live links, scheduled white-label emails, PDFs, Excel, or push data to BigQuery and Looker Studio. All on a custom domain - clients never see Whatagraph branding.
Basically, on Whatagraph, you can get the full picture of your search engine optimization efforts:
- Detailed keyword rankings alongside insights into search volume.
- Website traffic analytics, including key metrics like click-through rates (CTR).
- Technical SEO site health checks.
- Comprehensive backlink analysis.
- Top-ranking pages and search terms
Whatagraph's AI saves time and energy for our marketing specialists. And the hours we're saving is just pure profit. We now have the time to focus on more strategic things that help both our agency and our clients grow. - Lars Maat, Co-Founder, Maatwerk Online
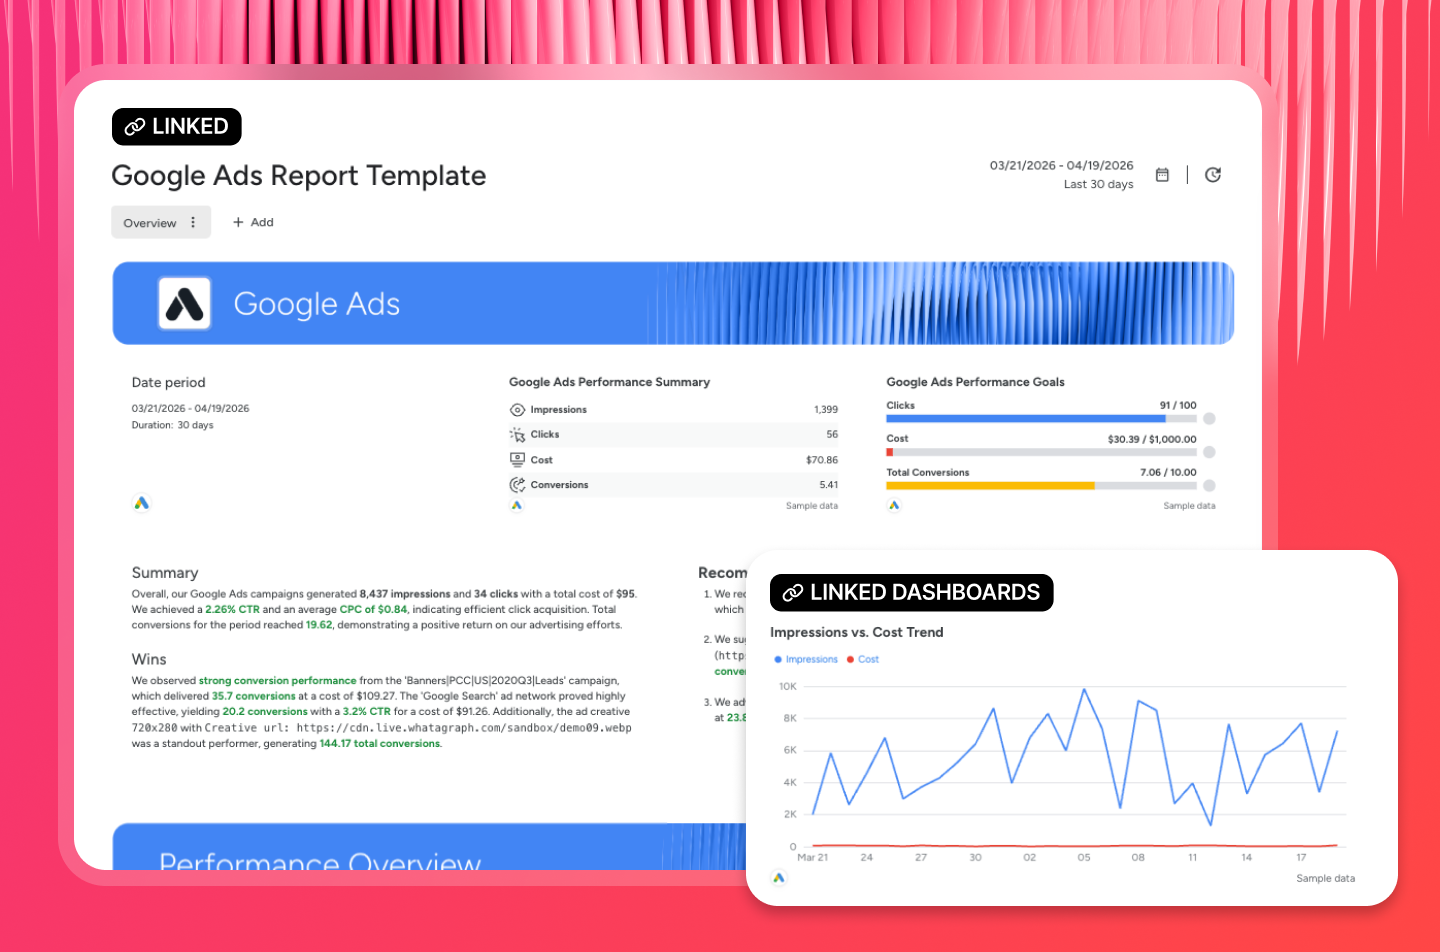
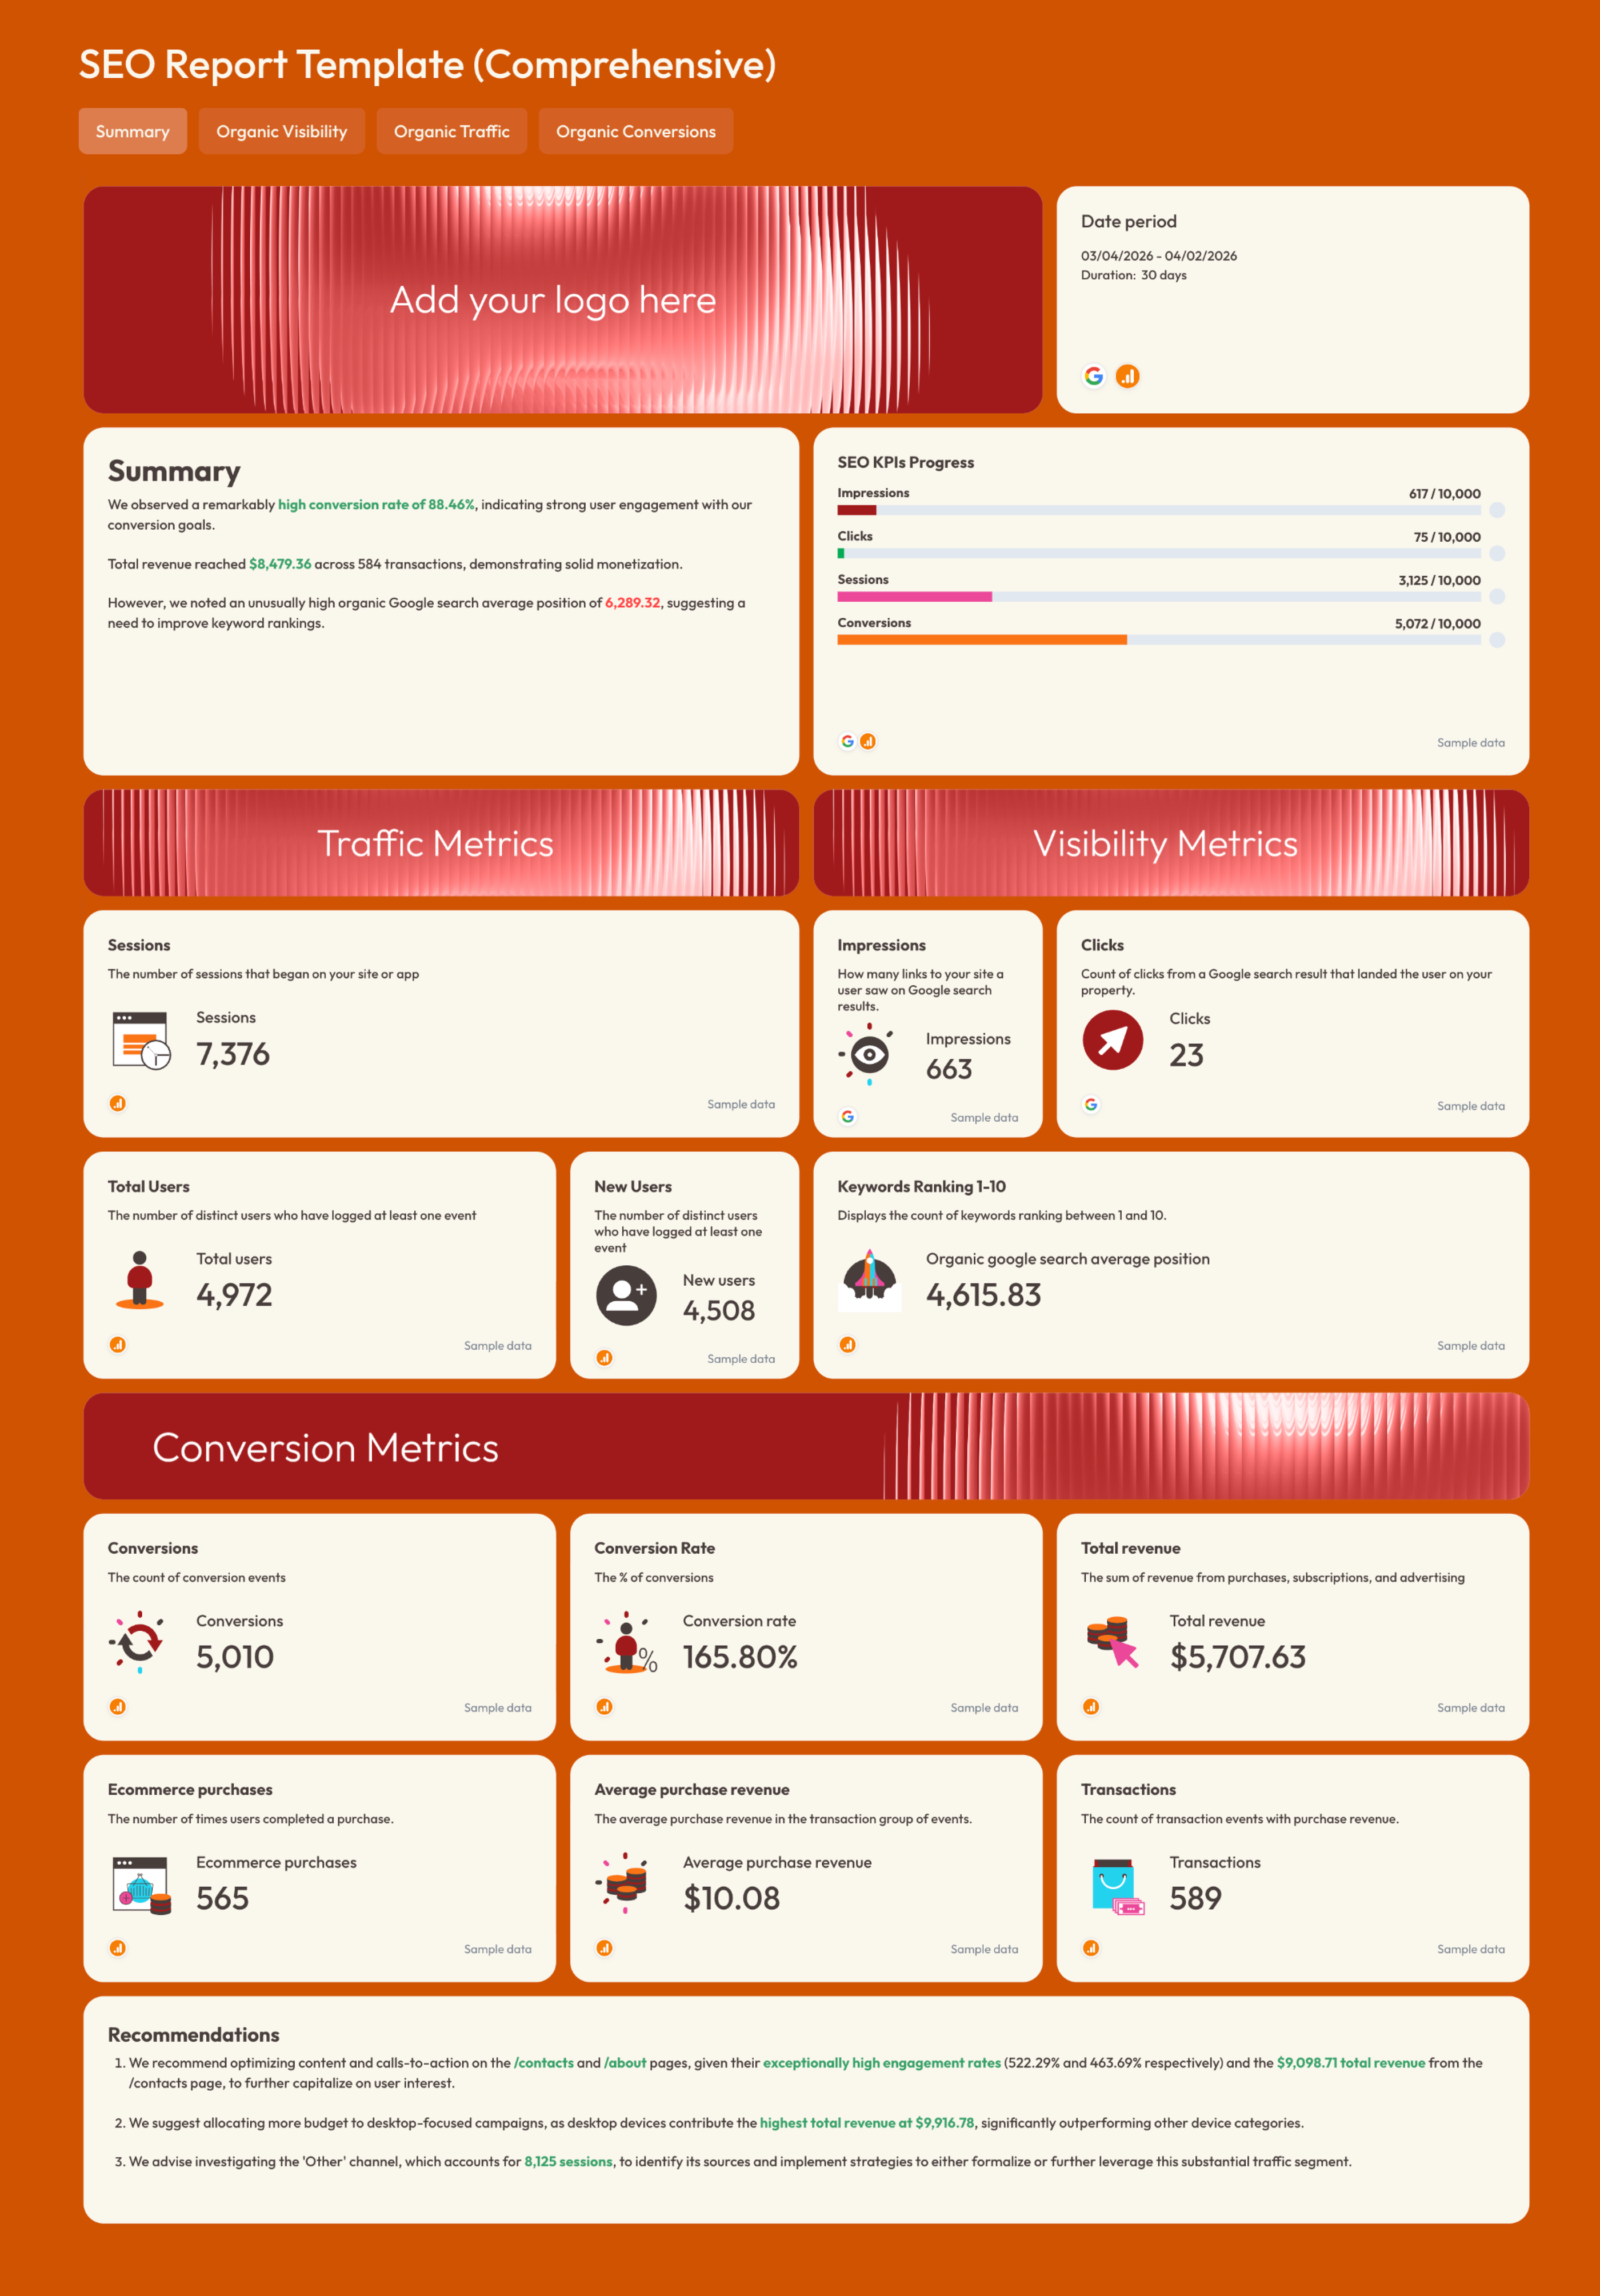
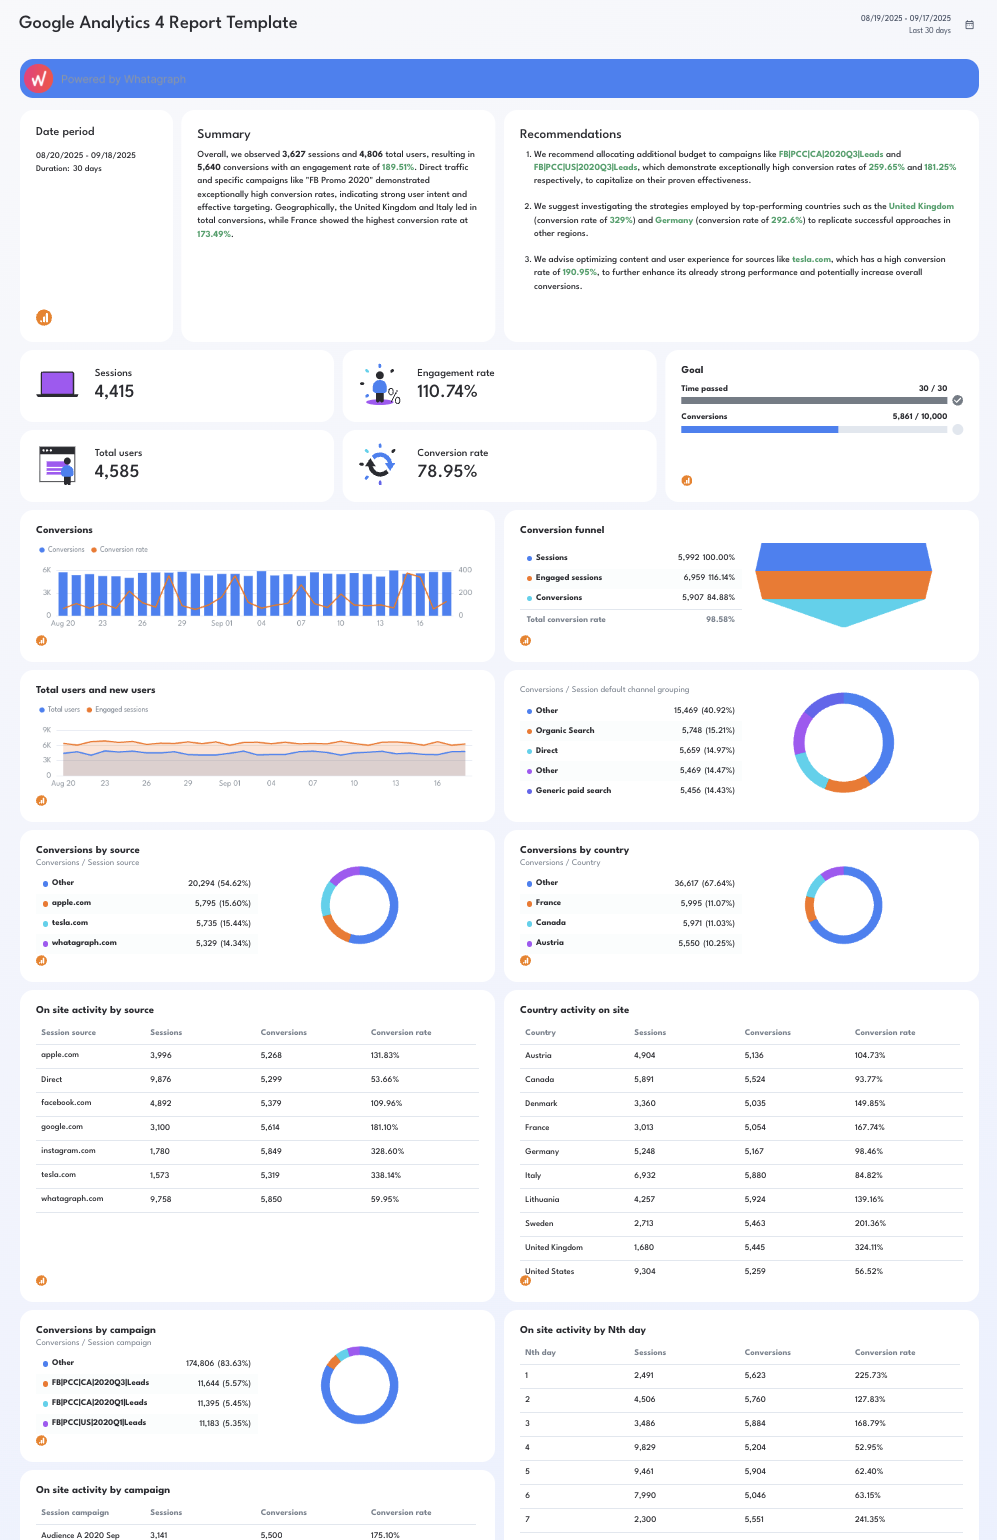
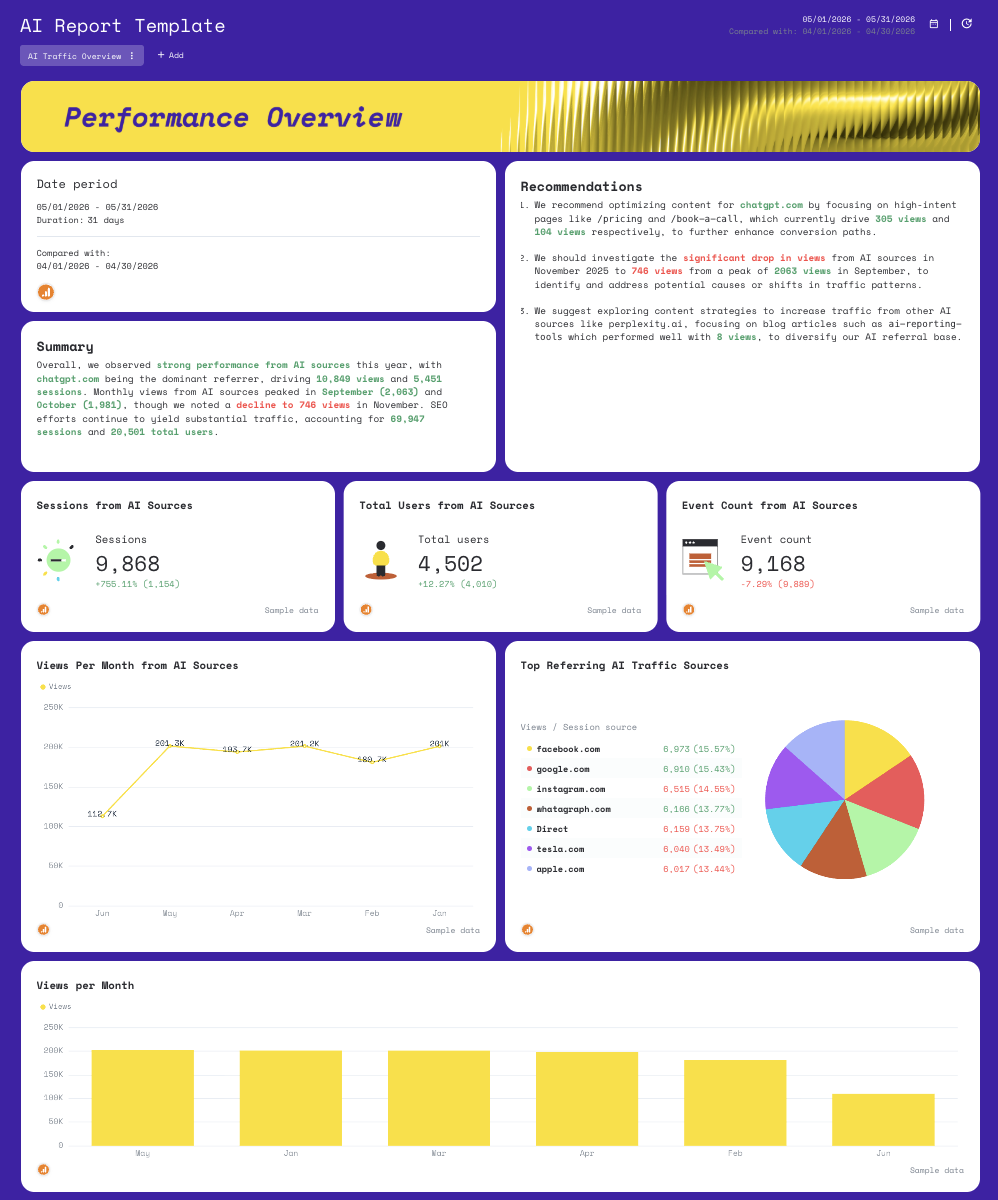
Want to get started quickly? Grab one of these SEO report templates:
What do real users say about Whatagraph?
- “Your reporting tool should work for you. This one does! Amazing reporting tool to showcase channel performance and to create blended performance reports for yourself or for clients.” (Source)
- “Apart from all the valuable things the tool has in itself, throughout the years we've chatted with their support for minor issues multiple times, and they were very quick to fix everything of even make improvements based on our feedback. Stellar group of people, these.” (Source)
- “Both we and our clients use this reporting tool daily, and we are extremely satisfied. The best and most flexible reporting tool I have come across.” (Source)
Pros:
- Governed data layer: the same numbers flow to reports, dashboards, and AI - no reconciling figures that should already match.
- Linked templates: one edit cascades across every client report instantly, without touching each one individually.
- AI narrative built in: IQ writes performance summaries in 18 languages directly inside reports - your team edits for voice, not from scratch.
- Grounded MCP: AI assistants connect to your governed data layer, not raw API output, so the numbers they return match your client reports.
- Unlimited users: all paid plans include unlimited users - no per-seat costs as your team grows.
Cons:
- Limited free plan: the forever-free plan is useful for testing, but fast-growing agencies will outgrow it quickly.
- Blending restrictions: some API restrictions (e.g. YouTube) mean not all dimensions can be blended across sources.
Pricing
Whatagraph offers a forever-free plan to get started. Paid plans scale with your usage - source credits, integrations, and AI features. See the full pricing breakdown here.
Start free with Whatagraph today.
2. TapClicks
Best for: Large agencies, brands, media companies, and enterprises managing complex, multi-location, or franchise marketing operations at scale
TapClicks is an AI-powered marketing operations and intelligence platform designed to unify data, automate reporting, and surface actionable insights.
Rather than forcing teams to stitch data together across dozens of tools, it acts as a centralized semantic layer built on a structured marketing context graph.
The platform is designed to eliminate manual data entry, turning complex data into executive-ready narratives so teams can focus on strategy and scaling client management without expanding headcount.

Key features
- 250+ connectors: TapData ETL plus ImportWizard for pulling data from virtually any source.
- SmartReports: AI-generated branded PowerPoint decks (SmartSlides) and email summaries (SmartEmail) delivered on a schedule.
- AI Operator Agent: build widgets, calculations, and custom API connectors from natural language prompts - no technical expertise required.
- Build-Your-Own Agent: create custom multi-step analysis workflows on your marketing data.
- SmartAnalytics dashboards: real-time dashboards with margin and markup rules built in for financial reporting.
- White-label reporting: full branding customization across reports and dashboards.
Pros:
- Connector depth: 250+ integrations that cover virtually any marketing stack.
- Automated delivery: SmartSlides and SmartEmail handle the full reporting cycle without manual work.
- No-code AI: the AI Operator Agent lets non-technical users build custom reports and connectors from prompts.
- Enterprise scale: built to handle high data volumes across many clients and stakeholders.
Cons:
- Learning curve: the extensive feature set requires real-time investment to master.
- No public pricing: requires a sales conversation before you can evaluate cost.
- Reliability issues: some users report connector gaps and occasional display bugs.
- Overkill for smaller agencies: most of the platform goes unused below ~50 clients.
Pricing
TapClicks doesn't publish pricing. Based on market data, plans start around $599/mo and scale up depending on data sources, client volume, and AI Agent seats. Contact their sales team for a quote.
What do real users say about TapClicks?
Users like TapClicks for its data visualization and the depth of its integrations - pulling campaign data from dozens of platforms into one place is genuinely one of the things it does well.
The trade-off is cost. As one Capterra reviewer puts it: “It can get very expensive if you go into premium elements. As for a small company the price can rise very fast.”
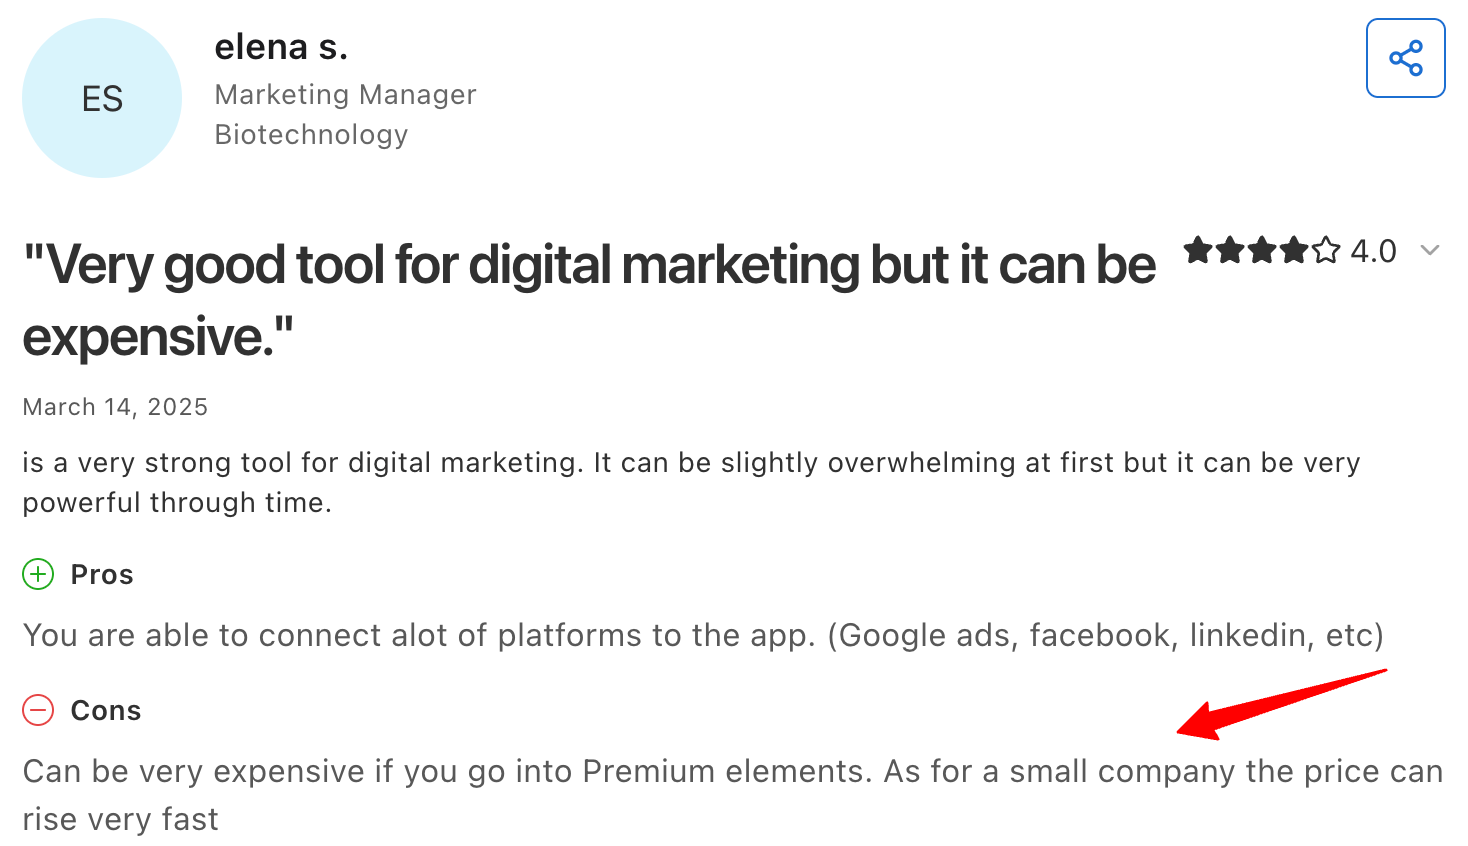
For enterprise agencies with complex marketing ops needs, the investment may be justified. For everyone else, the pricing ceiling and the learning curve are real barriers.
3. Databox
Best for: Teams that need real-time dashboards and BI features for internal performance tracking
Databox is a business analytics platform that consolidates marketing data into interactive dashboards. There's also a dedicated agency offering with client account management and bulk operations built in.
 The most notable addition to the platform is Genie, a conversational AI analyst that lets you ask plain-language questions and get visual answers with explanations. MCP is also available, connecting Databox to Claude or ChatGPT so your AI assistant can query your Databox data layer directly.
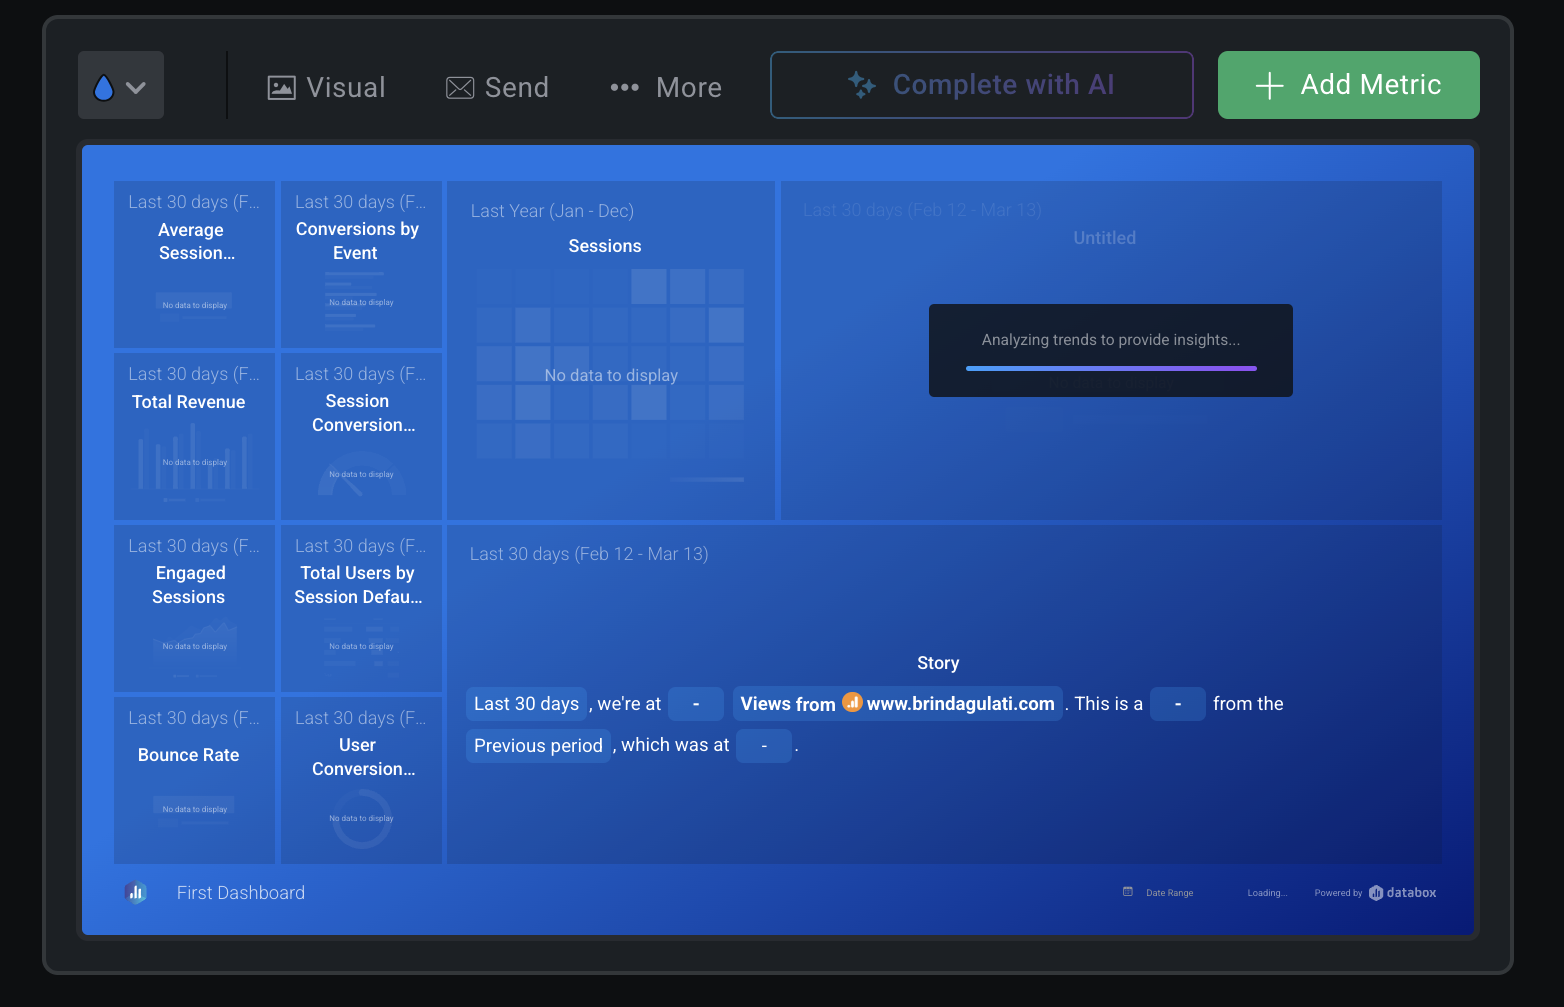
The reporting experience is still dashboard-first rather than report-first, which works well for internal performance monitoring but can feel limiting when building polished client-facing deliverables that need white-labeling, custom structure, and narrative commentary.
You kind of feel like you’re trapped in a Microsoft Presentation window instead of building a report in a truly intuitive SEO reporting platform like Whatagraph.
Key features
- 130+ integrations: connects major SEO and marketing platforms, plus custom integrations for niche data sources.
- Genie AI Analyst: ask plain-language questions and get visual answers with explanations - available on Growth plan and above.
- MCP support: connect Claude or ChatGPT to query your Databox data layer directly - available on all plans including free.
- Anomaly detection and forecasting: automated performance alerts and trend modeling, available on Growth plan and above.
- Dataset merging: combine multiple data sources with custom columns for cross-channel analysis.
- Agency pricing track: separate plans with client account management, bulk operations, and lower per-source overage rates.
Pros:
- MCP access: available on all plans, including free - one of the lowest barriers to AI assistant integration in the category.
- Conversational AI: Genie AI Analyst is a strong feature for teams that want to explore data without building dashboards.
- Agency entry point: Agency Starter at $79/mo with lower per-source overage rates than the Business track.
- Generous free plan: usable for solo users or extended evaluation before committing.
Cons:
- Source limits: only 3 data sources included on most plans - additional sources cost extra on top of the plan price.
- White-label cost: white-labeling is a $200/mo add-on on most plans, only bundled on Premium ($799/mo).
- AI gating: Genie AI Analyst is locked to the Growth plan ($399/mo) and above.
- Cross-client filtering: limited below premium tier, making portfolio-level management difficult.
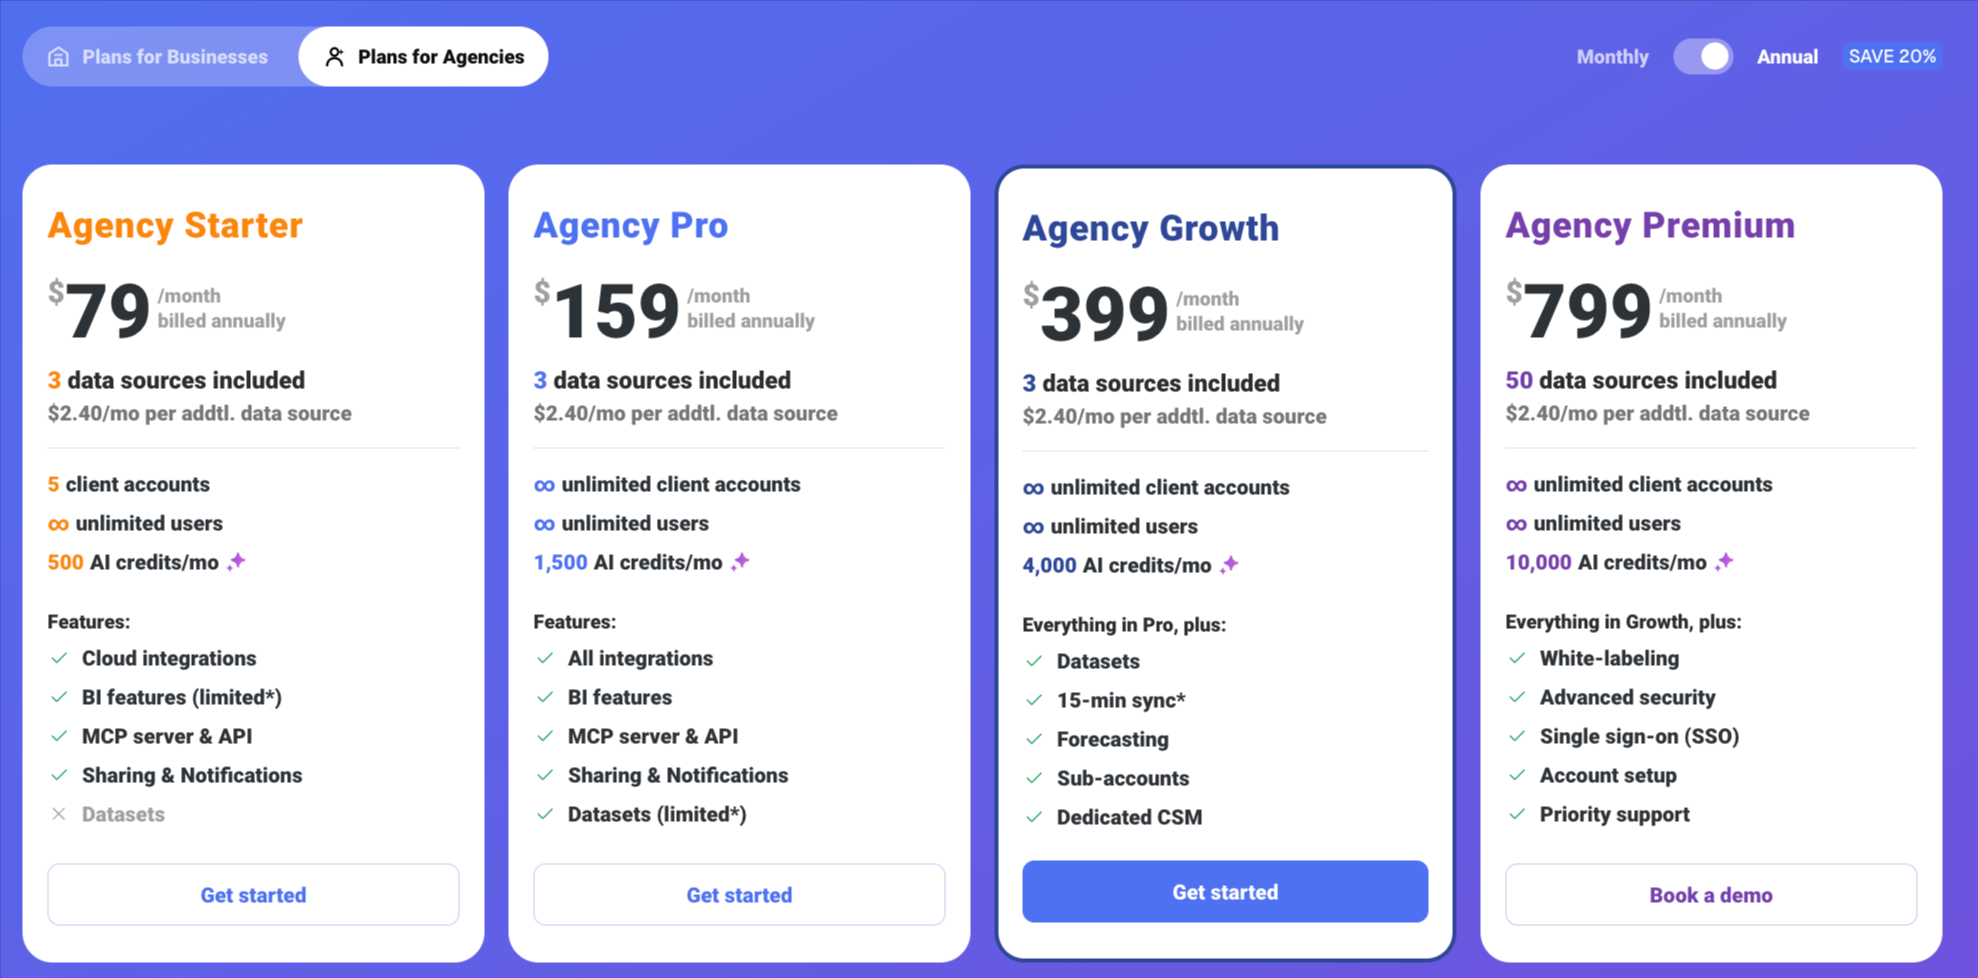
Pricing:
Databox’s agency plans, as of 2026 May, billed annually:
- Agency Starter ($79/mo): 3 data sources, 5 client accounts, hourly sync, scheduling and sharing.
- Agency Pro ($159/mo): unlimited client accounts, AI Analyst, remove branding.
- Agency Growth ($399/mo): AI performance summaries, anomaly detection, forecast modeling.
- Agency Premium ($799/mo): 50 data sources included, all add-ons bundled.
Note: additional data sources cost $2.40/mo each on agency plans.
Note: Databox no longer offers a “Free Forever” plan. Instead, all users begin with a 14-day free trial of their Growth plan.
What do real users say about Databox?
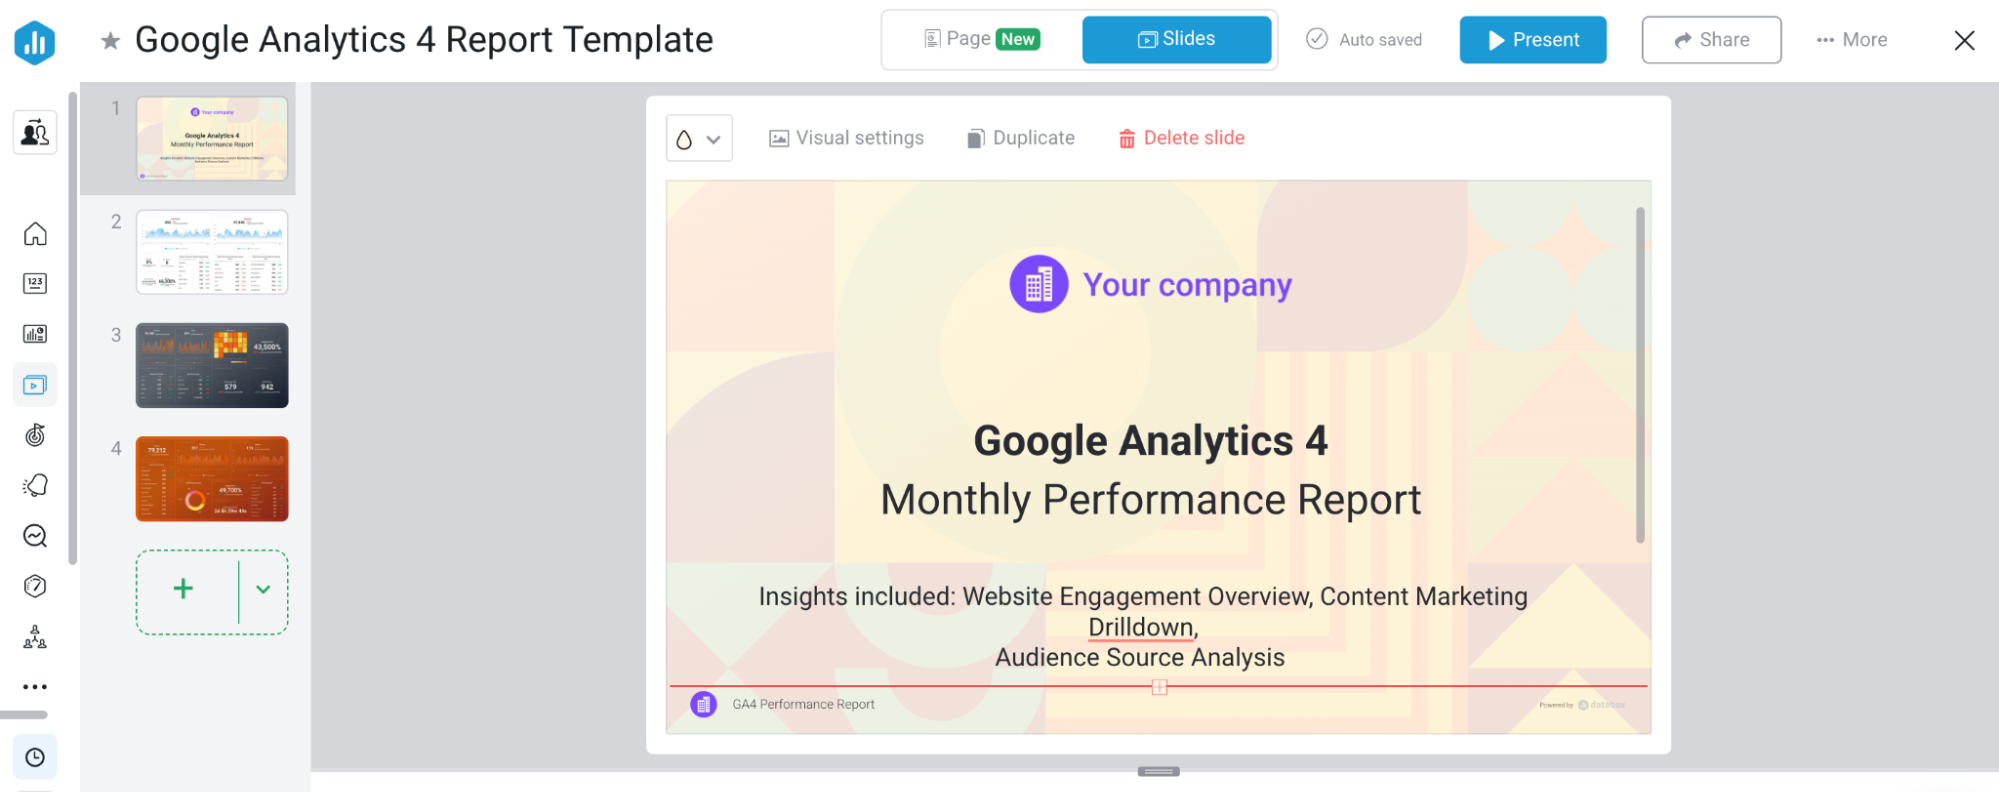
Users appreciate Databox's broad integration coverage and how quickly you can spin up dashboards for internal performance tracking. The pre-built templates make it easy to get started with keyword rankings, Google Ads data, and Google Analytics 4 metrics without much configuration.
The gaps show up once you move beyond the major platforms. As Nancy S. puts it: "While it has the major business integrations and connections, it needs more connections to work in certain industries.”
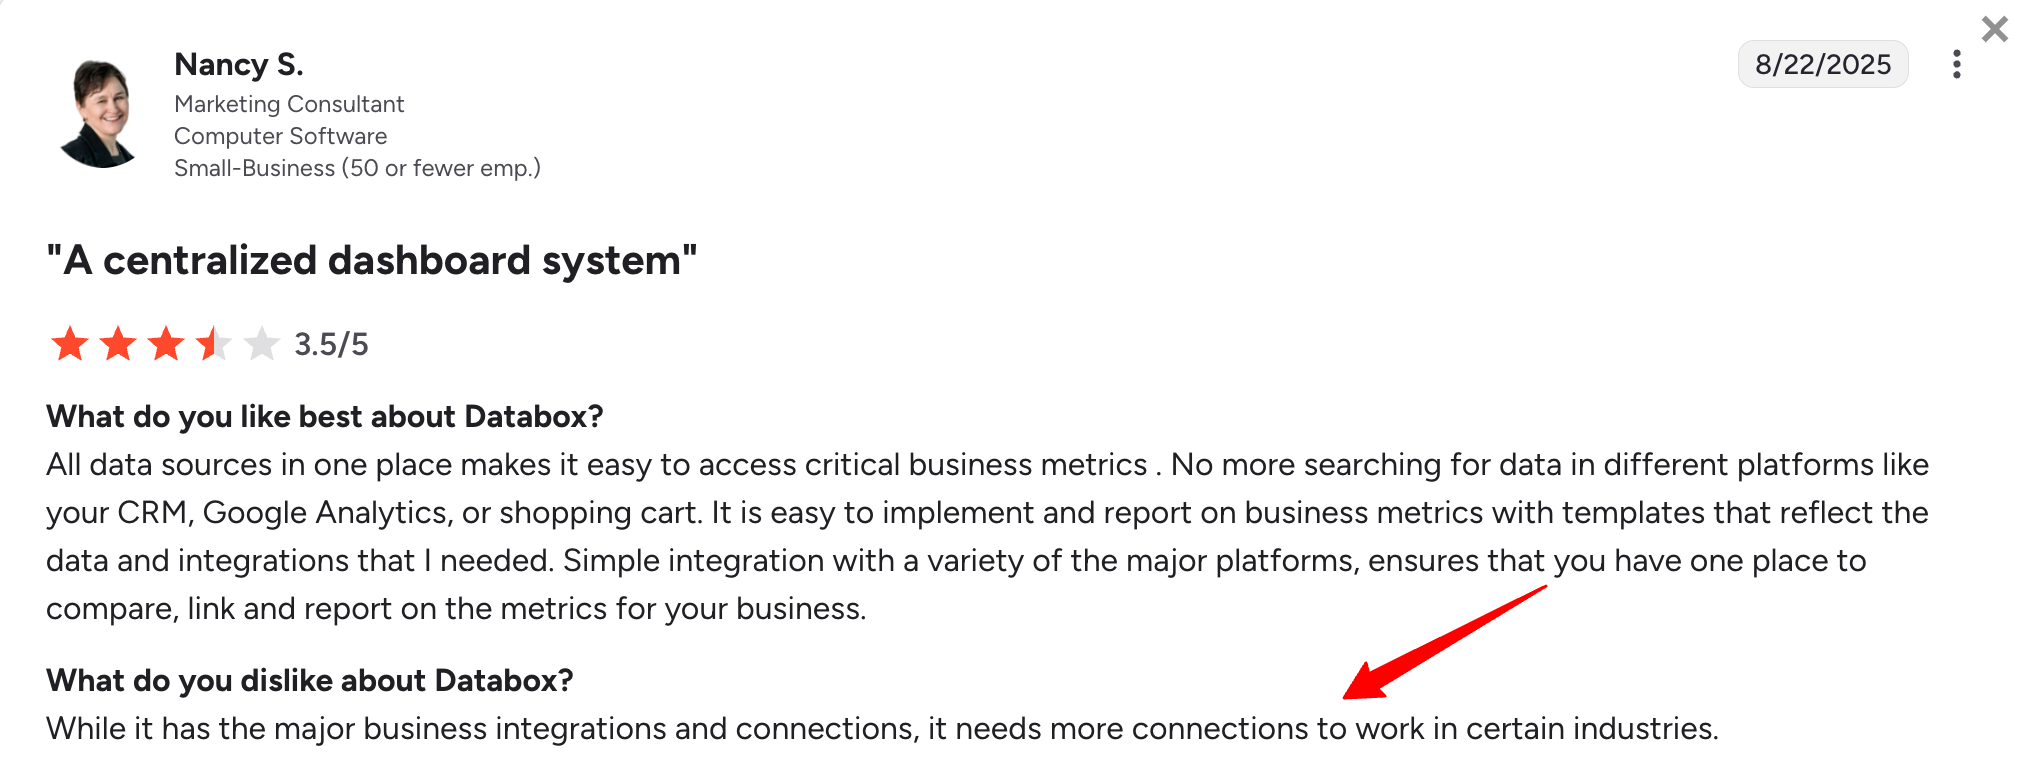
For SEO agencies that rely on tools like SE Ranking or SEOMonitor for rank tracking and site health data, that coverage gap means manual workarounds or running parallel tools - which chips away at the time savings automated reporting is supposed to deliver.
4. AgencyAnalytics
Best for: Agencies that need white-labeled reporting with basic customization.
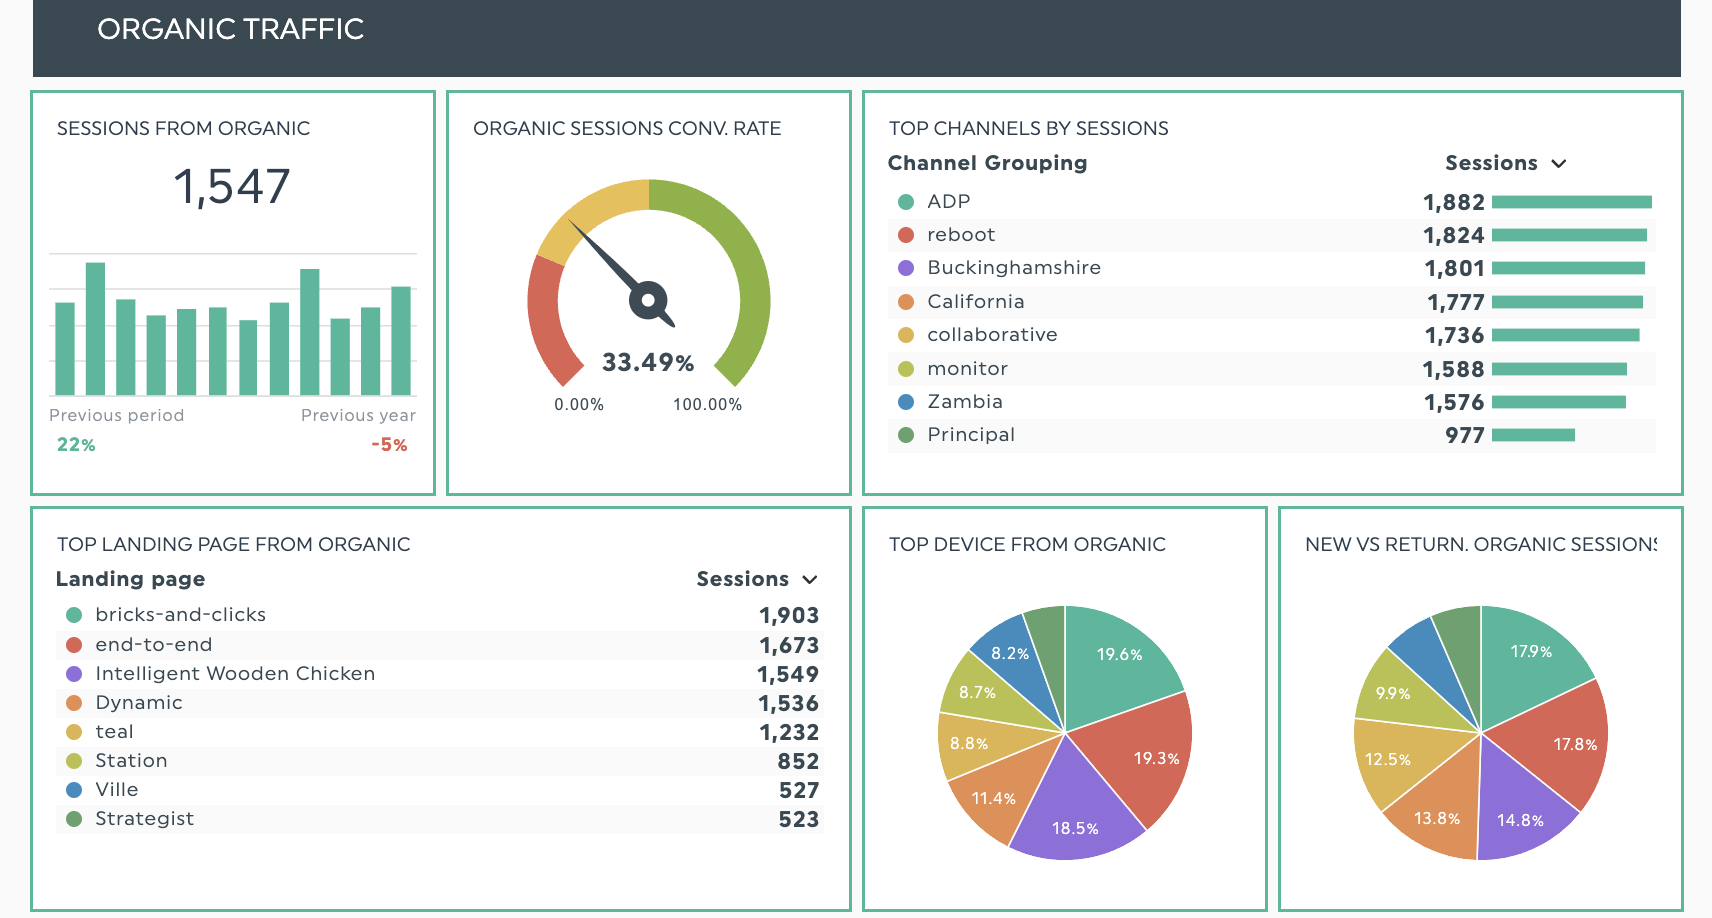
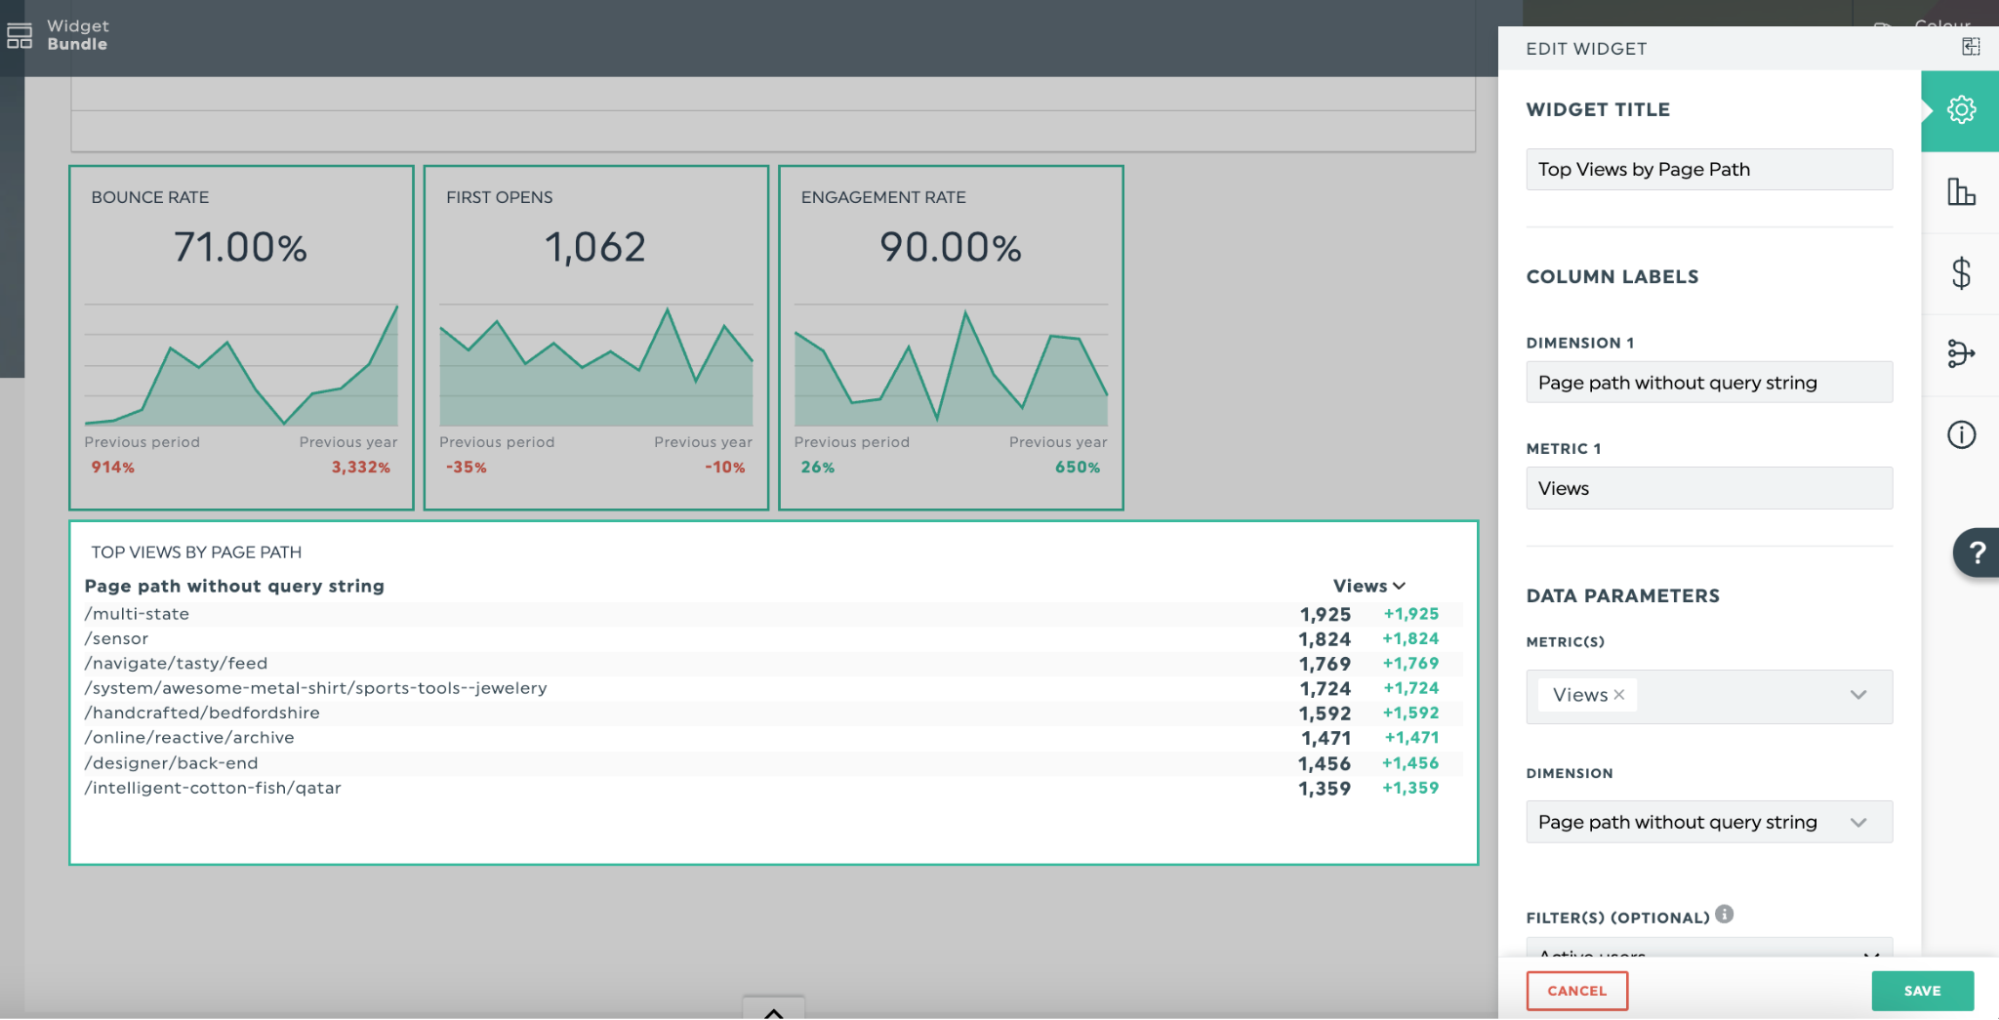
AgencyAnalytics is built specifically for marketing agencies that need white-labeled client reports. Its standout feature for SEO agencies is built-in rank tracking and site audits - you're not relying on a separate Ahrefs or Semrush subscription just to pull ranking data into your reports.
A recent addition is “Views“ - a cross-channel reporting table builder where you describe what you want and AI builds the table automatically. It's available on all plans. MCP is also included on the Core plan.
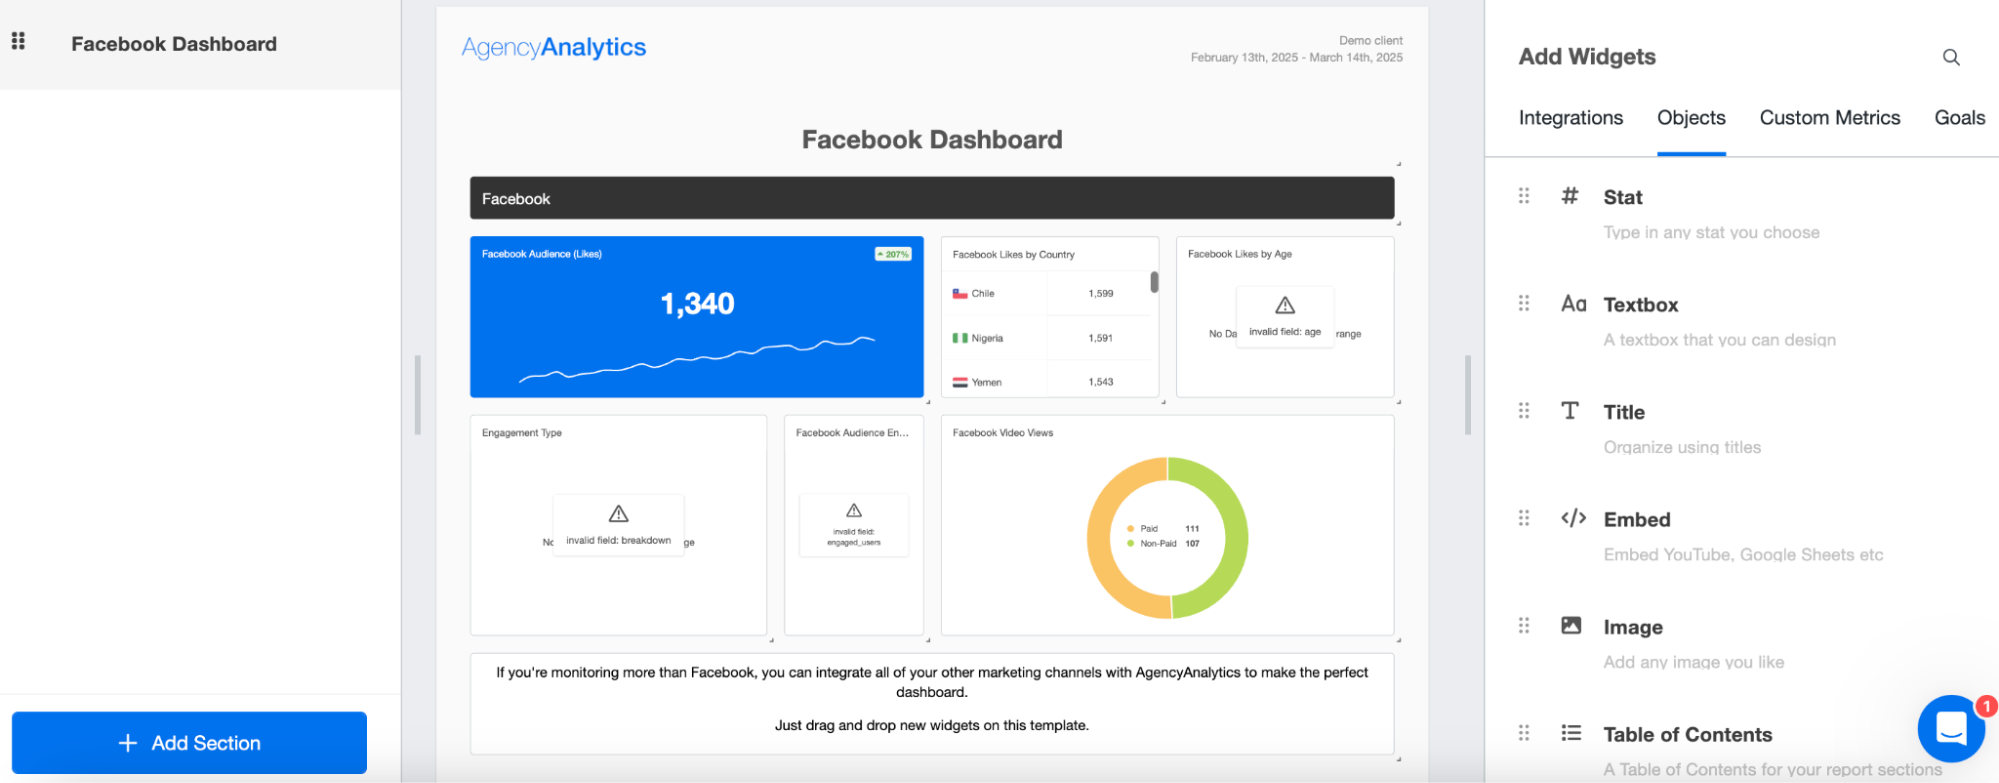
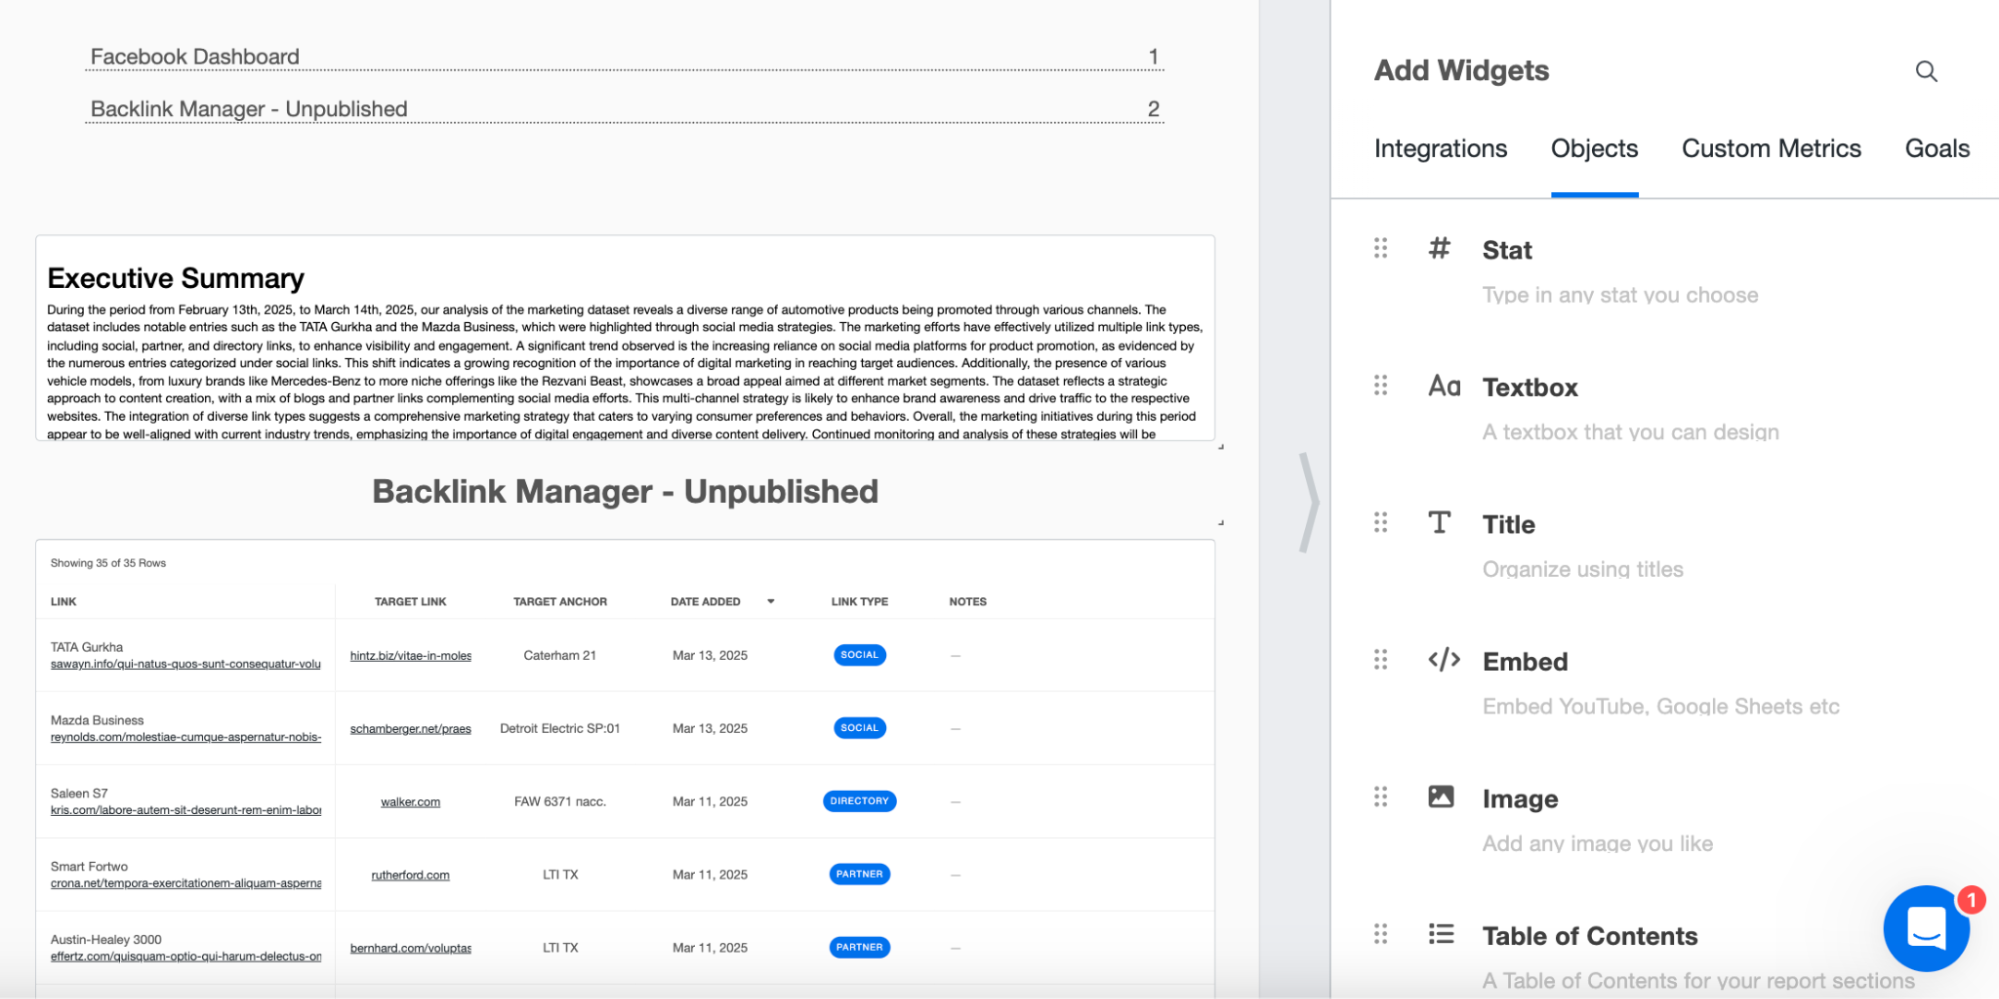
While designing reports is fairly easy, you quickly hit a ceiling with what you can do.
There aren’t many diverse options for different widgets to visualize your data, and the report stretches on a single page instead of a multi-window experience like Whatagraph.
You have to keep scrolling up and down to add widgets. The experience is more ebook than report.
Key features
- 85+ integrations: covers all major SEO tools and ad platforms, including Google, Meta, and LinkedIn.
- Built-in rank tracker: tracks Google and Bing rankings (mobile and local) as an add-on at $50/mo per 500 keywords.
- AI Insights and Ask AI: automated commentary and natural language data queries included on the Core plan.
- MCP access: connect Claude or ChatGPT to query individual client data - included on Core plan.
- Views: AI-built cross-channel reporting tables, per report, available on all plans.
- White-label with custom domain: custom email and client portal included on Core plan.
- Goals, alerts, and anomaly detection: all included on Core plan with no feature gating.
Pros:
- Built-in SEO tools: rank tracking and site audits without needing a separate tool subscription.
- No AI upsell: MCP, AI Insights, anomaly detection, and forecasting all included on the base Core plan.
- Predictable pricing: per-client model is easy to budget at lower client volumes.
- Full white-label on Core: custom domain and client portal included without upgrading.
Cons:
- No master templates: edits don't cascade across clients - every change is made one dashboard at a time.
- Scales steeply: 20 clients = $400/mo, 40 clients = $800/mo, before add-ons.
- Rank Tracker is an add-on: not included in base pricing - $50/mo per 500 keywords.
- Views are per-report: not a governed cross-client data layer, so definitions aren't shared across accounts.
Pricing
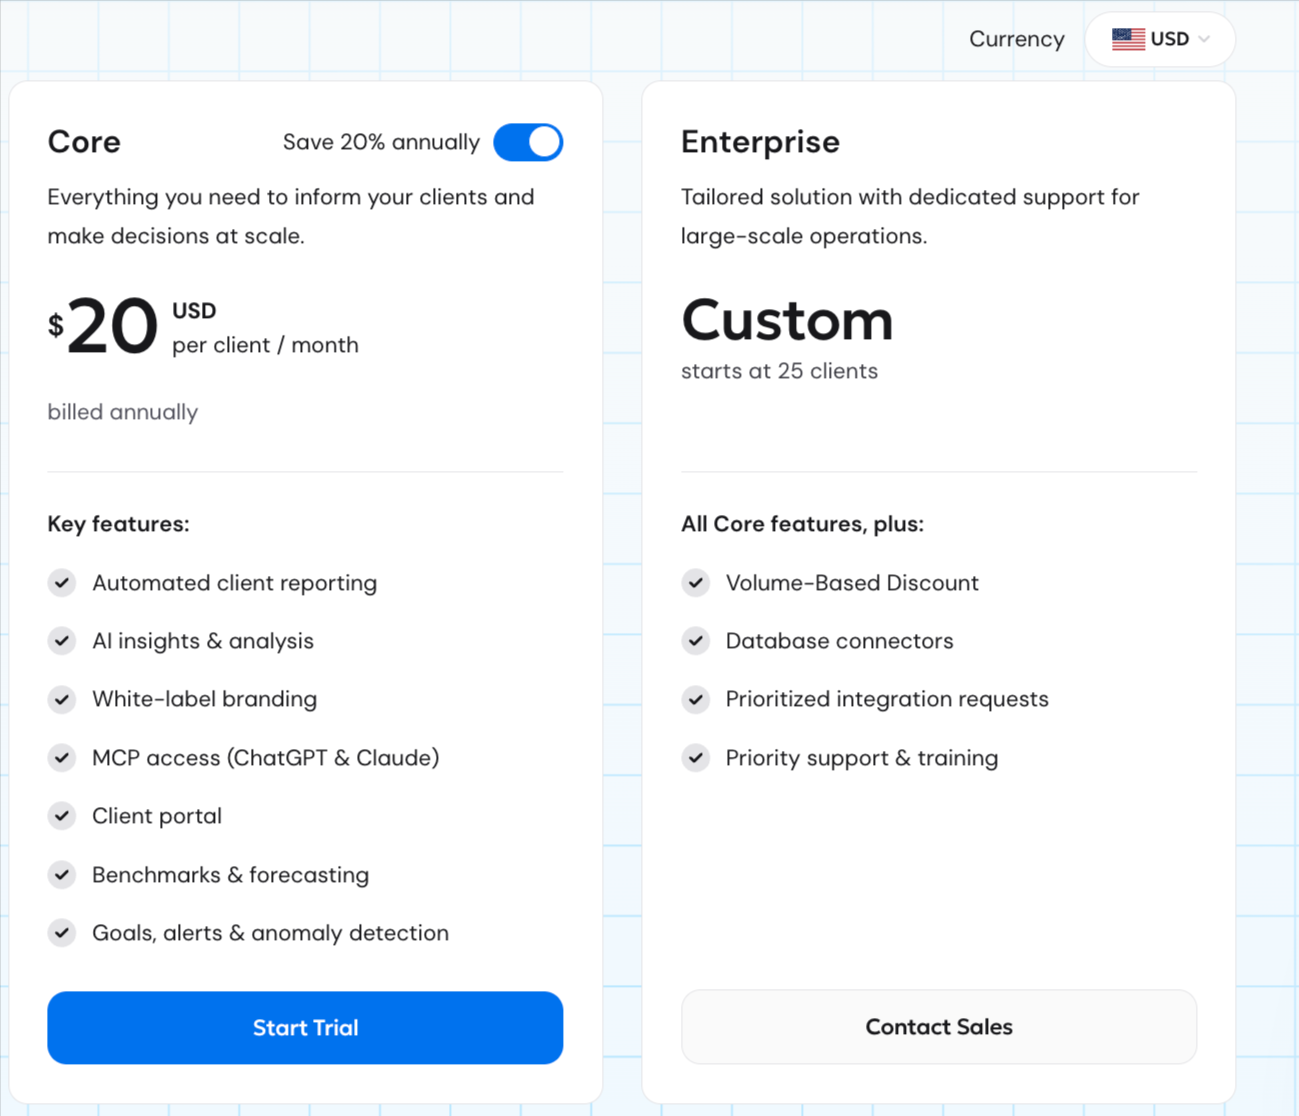
AgencyAnalytics offers a 14-day free trial and uses a per-client pricing model. Here’s a quick look at their main plans (billed annually) as of May 2026:
- Core: $20/client/mo (billed annually) - all features included, unlimited users and data sources.
- Enterprise: custom pricing, starts at 25 clients - volume discounts, database connectors, priority support.
What do real users say about AgencyAnalytics?
Users consistently appreciate how clean and professional AgencyAnalytics reports look - white-label reporting is one of its genuine strengths, and clients respond well to the polished output.
The frustration shows up in the build experience. Alex W. captures it well: "Sometimes the changes to dashboards and widgets can make building reports a bit tricky, and they take a bit longer to get right.”
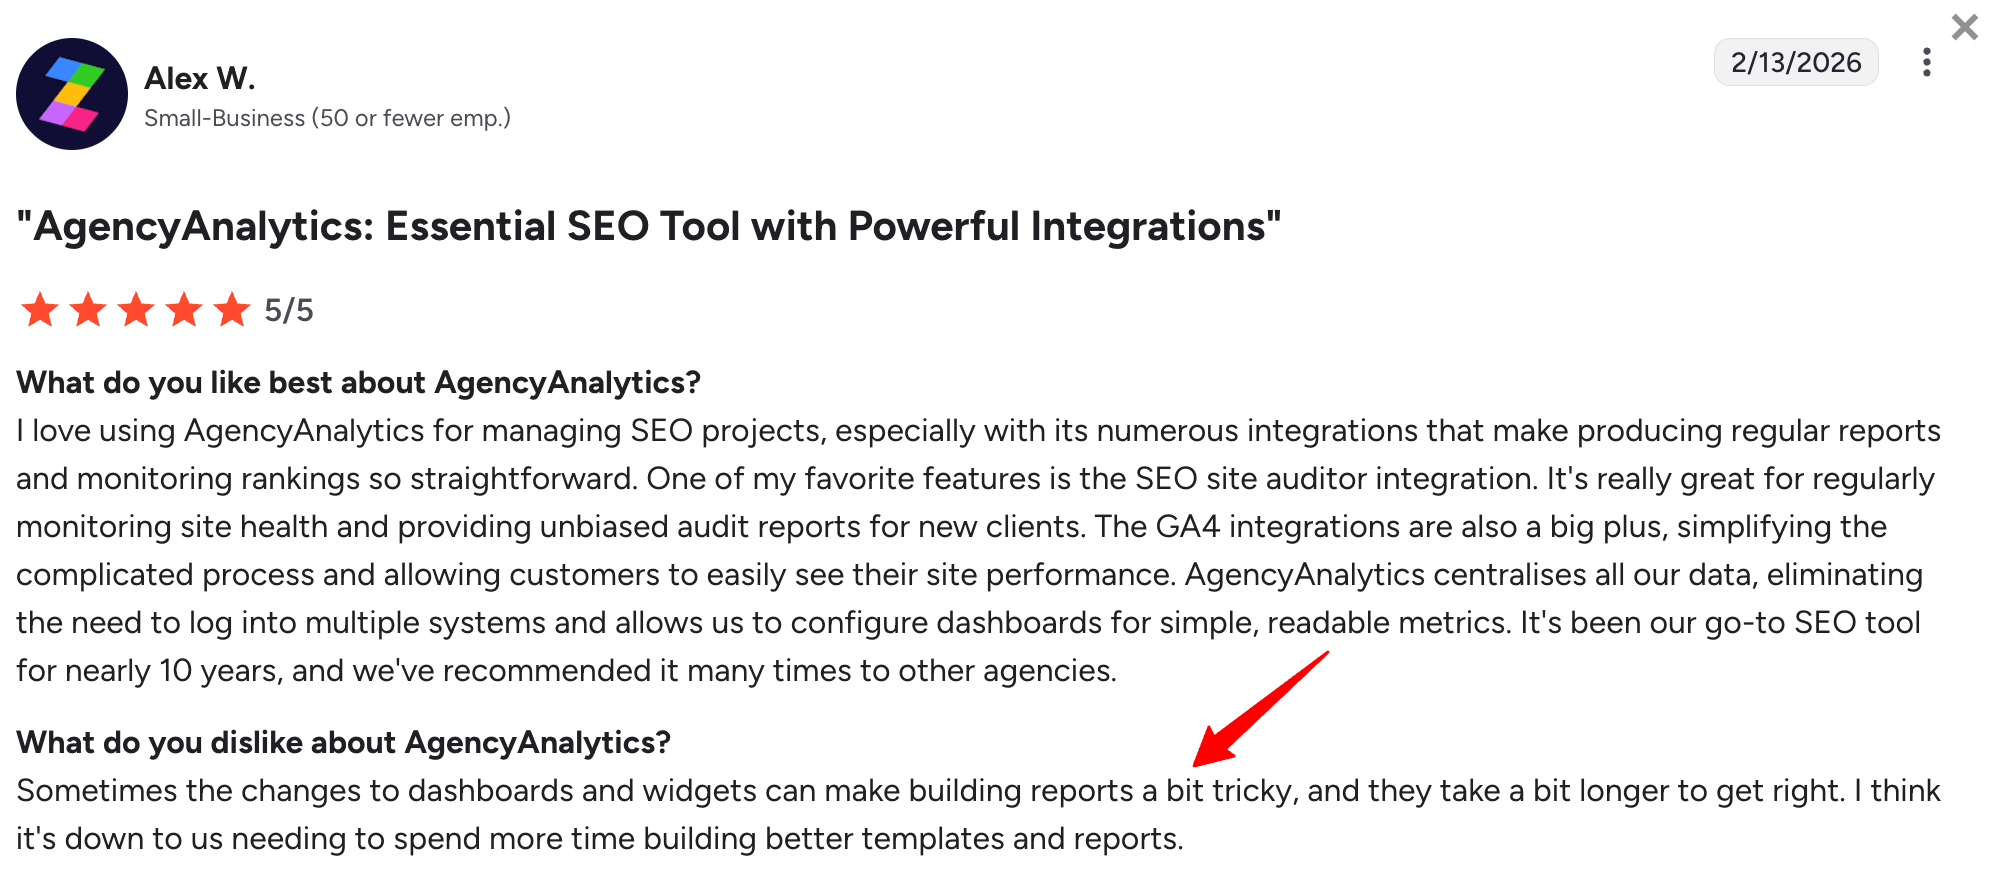
A big part of that friction is the lack of master templates.
Every change to a report layout - whether that's adding a backlink analysis section, updating keyword rankings widgets, or tweaking the structure of a site audit summary - has to be made one dashboard at a time. For agencies managing 20+ clients, that adds up fast.
5. DashThis
Best for: Marketing teams looking for a straightforward reporting solution with multiple integrations.
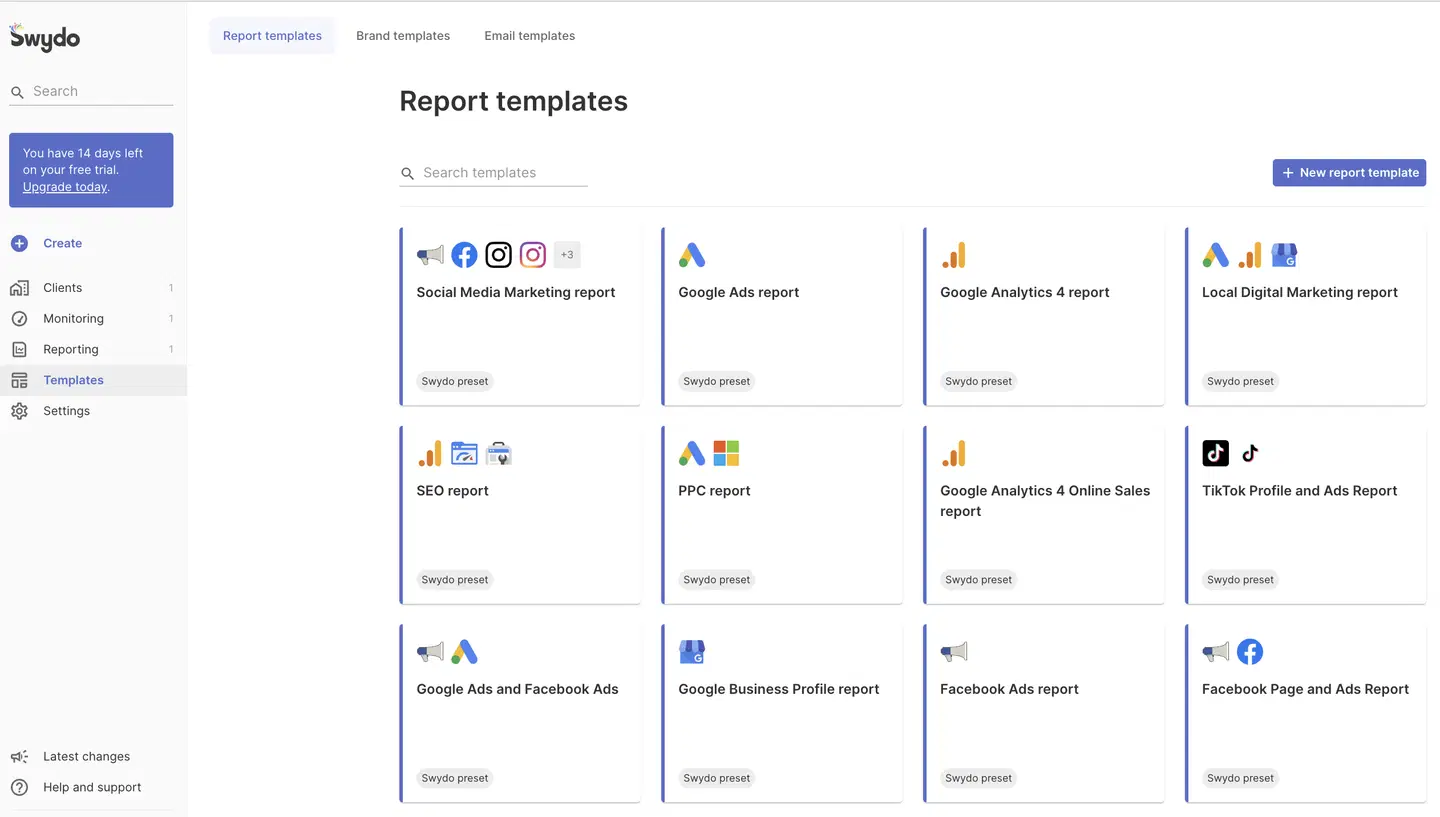
DashThis is a marketing reporting platform built around simplicity. The setup is fast, the templates are clean, and it covers the core channels most small agencies need. It charges by dashboard count, with each dashboard able to connect unlimited data sources - a model that keeps things predictable if your client count is stable.
I do like that DashThis has more colorful widgets than the alternatives on the list (Whatagraph though, is still far ahead, I believe).
But, like TapClicks traps you in a slide deck, DashThis makes the insights section feel like Microsoft Word—not the most modern experience.
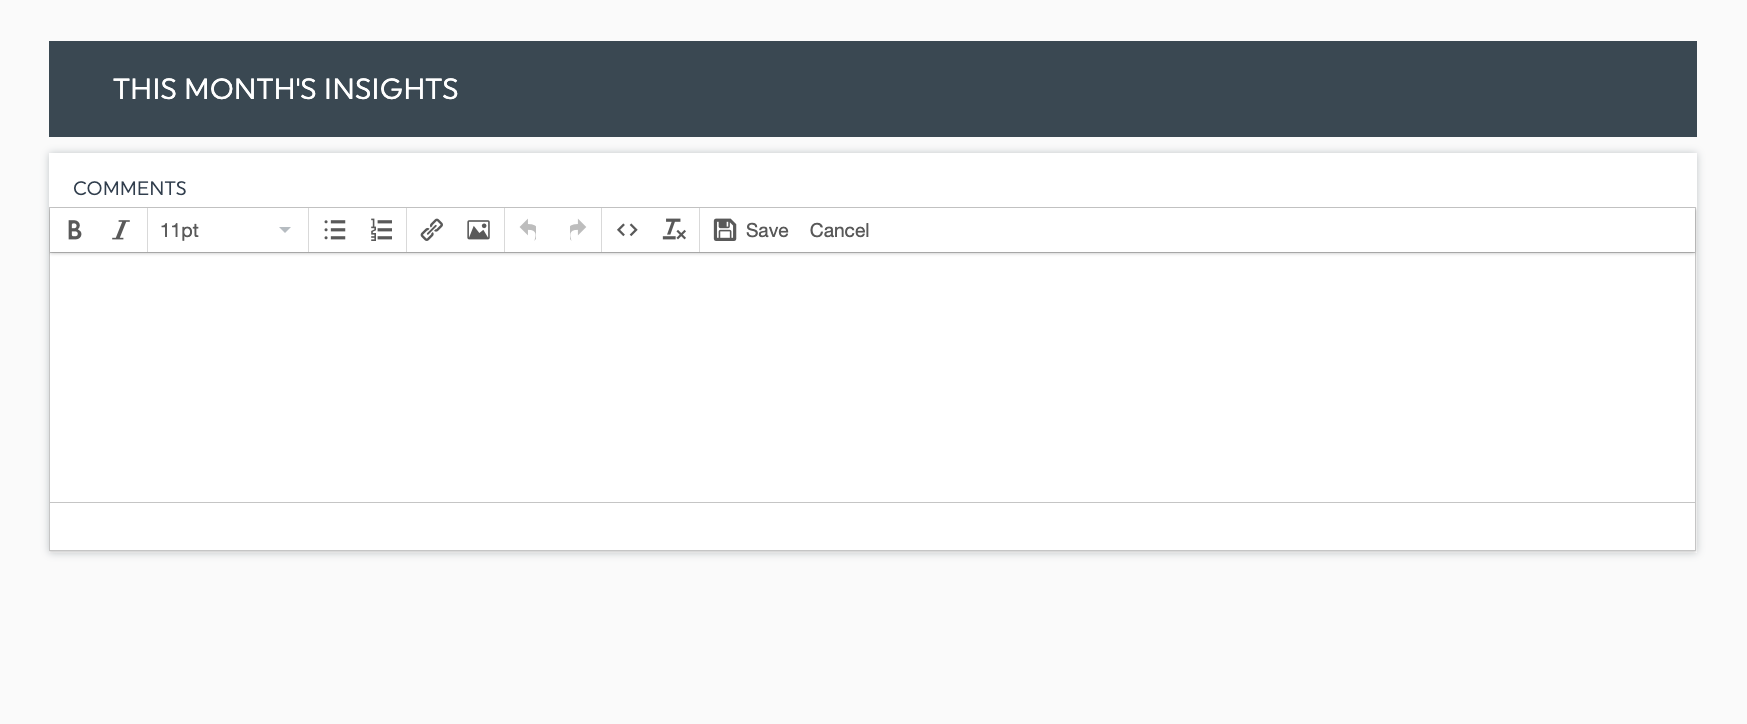
Agencies using DashThis often mention spending extra time customizing reports. For design-focused teams, the dashboard customization can feel a bit limiting. Active Campaign users might need to do some manual data exports, which adds a few extra steps to the reporting process.
Key features
- 50+ integrations: covers Google Ads, Meta, GA4, Google Search Console, LinkedIn, Reddit Ads, and more.
- AI Insights (free): automatic plain-language performance commentary included on all plans.
- AI Insights Pro add-on: Chat Mode and Dashboard Context for tailored, client-specific insights at $15/mo annually.
- Dashboard-based pricing: each dashboard connects unlimited data sources - predictable costs for stable client rosters.
- White-label with custom domain: custom domain and email available on Professional plan and above.
- Automated delivery: scheduled PDF and email reports with consistent cadence.
Pros:
- AI included on all plans: automated insights without an upsell - useful for small agencies that can't justify add-ons.
- Predictable pricing: dashboard-based model is easy to budget for agencies with stable client counts.
- Fast setup: clean pre-built templates get you reporting quickly without configuration overhead.
- Low entry point: $44/mo for small teams covers the core use case.
Cons:
- New source limits: the March 2026 pricing update adds source caps that can make multi-platform agencies more expensive than expected.
- No master templates: edits can't cascade across all client dashboards at once.
- Limited data blending: custom metrics and cross-source calculations are basic compared to more advanced tools.
- White-label requires an upgrade: custom domain and branding need the Professional plan at $139/mo.
Pricing
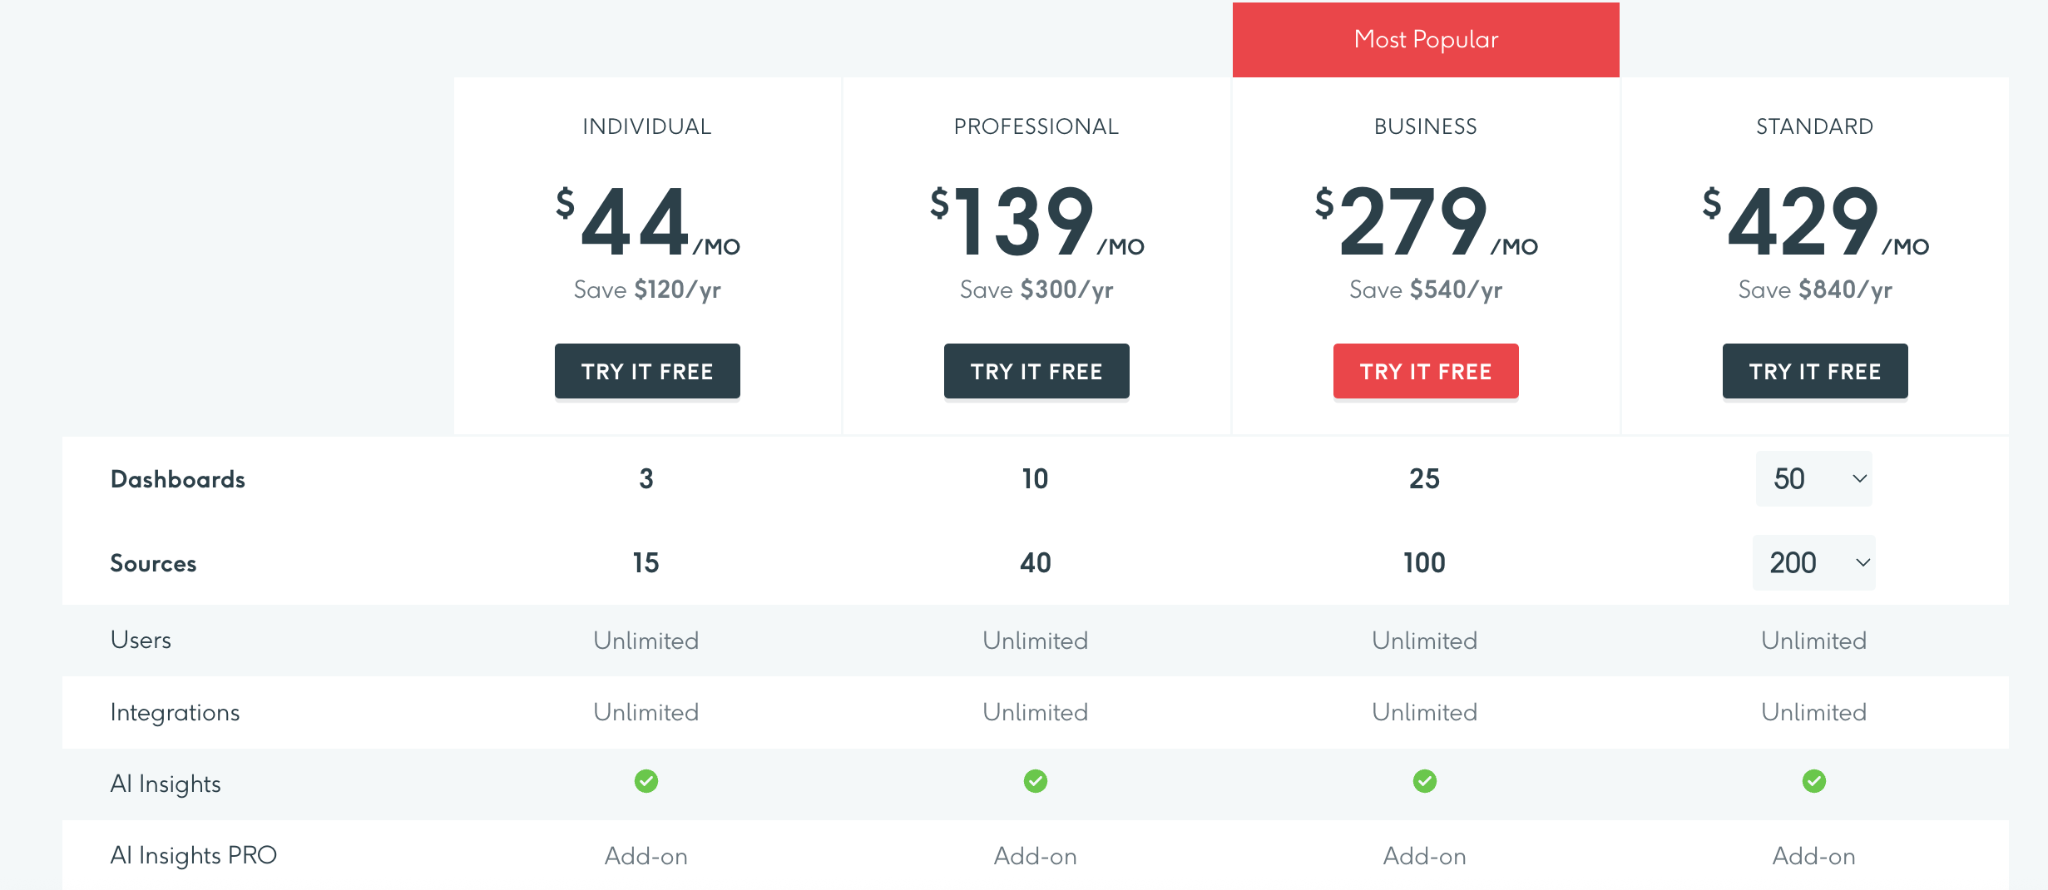
As of 2026 May, DashThis’ pricing is as follows:
- Individual ($44/mo): 3 dashboards, 15 sources, unlimited users, AI Insights.
- Professional ($139/mo): 10 dashboards, 40 sources, custom domain, white-label.
- Business ($279/mo): 25 dashboards, 100 sources, customer success specialist.
- Standard ($429/mo): 50 dashboards, 200 sources.
AI Insights Pro add-on: $15/mo (annual) or $19/mo (monthly).
What do real users say about DashThis?
Most users find DashThis a solid starting point for consolidating KPIs from multiple sources into a single view. The setup is fast, the templates cover the basics, and for small teams tracking keyword rankings and Google Search Console data for a handful of clients, it does the job.
The ceiling shows up when you need to do anything more than the basics.
Amna A. flags it directly in the below review:
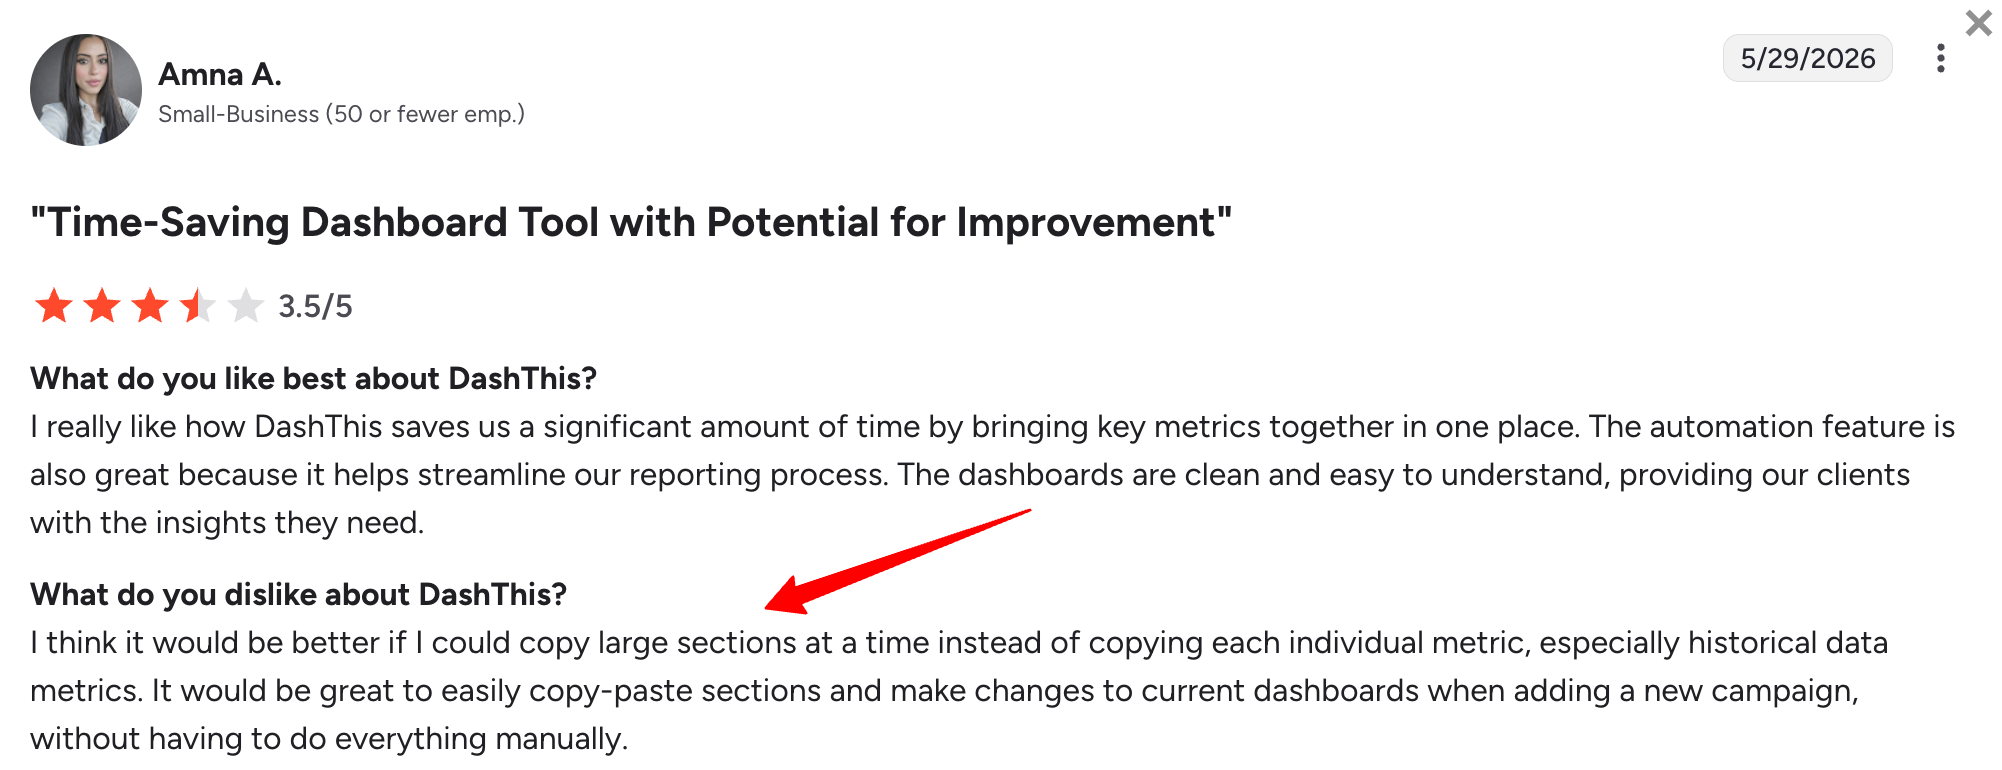
This is the same master template problem as AgencyAnalytics.
Every time you onboard a new client or update your report structure - adding a competitor analysis section, adjusting customizable reports for a new campaign - you're doing it widget by widget.
For agencies looking to scale automated reporting across a growing client base, that manual overhead is a real constraint.
6. Swydo
Best for: PPC-focused agencies with a focused channel setup and under 100 data sources
Swydo is a reporting platform priced per data source rather than per client, which makes it genuinely cost-effective for agencies with consistent, focused channel setups. If your clients all run Google Ads and Meta, the math works in your favor. The model breaks down when you're managing large multi-location clients or need to track dozens of accounts per client.
Swydo AI is now available, adding automated insights to the platform. However, there's no MCP support, meaning you can't connect Claude or ChatGPT directly to your Swydo data.
There's also a 50 data source cap per report to factor in. For agencies managing multi-location clients or accounts with many ad accounts, that means splitting into multiple reports and manually re-adding properties - which defeats the purpose of an automated tool.
Swydo's reporting also falls short on basic data management.
Exporting to spreadsheets or warehouses isn't possible, and the widget setup is clunky. You’ll need to configure widgets in a hidden sidebar before seeing the final layout, with no drag-and-drop grid functionality.
Even widget resizing remains in beta, making dashboard creation a frustrating experience.
Key features
- 30+ integrations: covers Google Ads, Meta, GA4, LinkedIn, and other major marketing platforms.
- Per-data-source pricing: $69/mo base includes 10 sources - cost-effective for focused, consistent client setups.
- Swydo AI: automated insights and commentary added to reports.
- Automated scheduling: set-and-forget report delivery via email on a defined cadence.
- White-label branding: custom logo and colors on client-facing PDF reports.
- KPI and goal tracking: monitor performance targets alongside campaign metrics.
Pros:
- Cost-effective model: per-source pricing rewards agencies with consistent, focused channel setups.
- Clean output: professional-looking reports that present well to clients.
- Automated delivery: scheduling reduces the manual work of sending reports each month.
- Low entry point: $69/mo is one of the lowest starting prices in the category.
Cons:
- Source cap: hard limit of 50 data sources per report forces workarounds for multi-location or enterprise clients.
- No MCP: can't connect AI assistants like Claude or ChatGPT to your Swydo data.
- No warehouse export: data can't be pushed to BigQuery or Looker Studio.
- Widget limitations: no drag-and-drop grid and resizing is still in beta, making dashboard layout frustrating.
Pricing
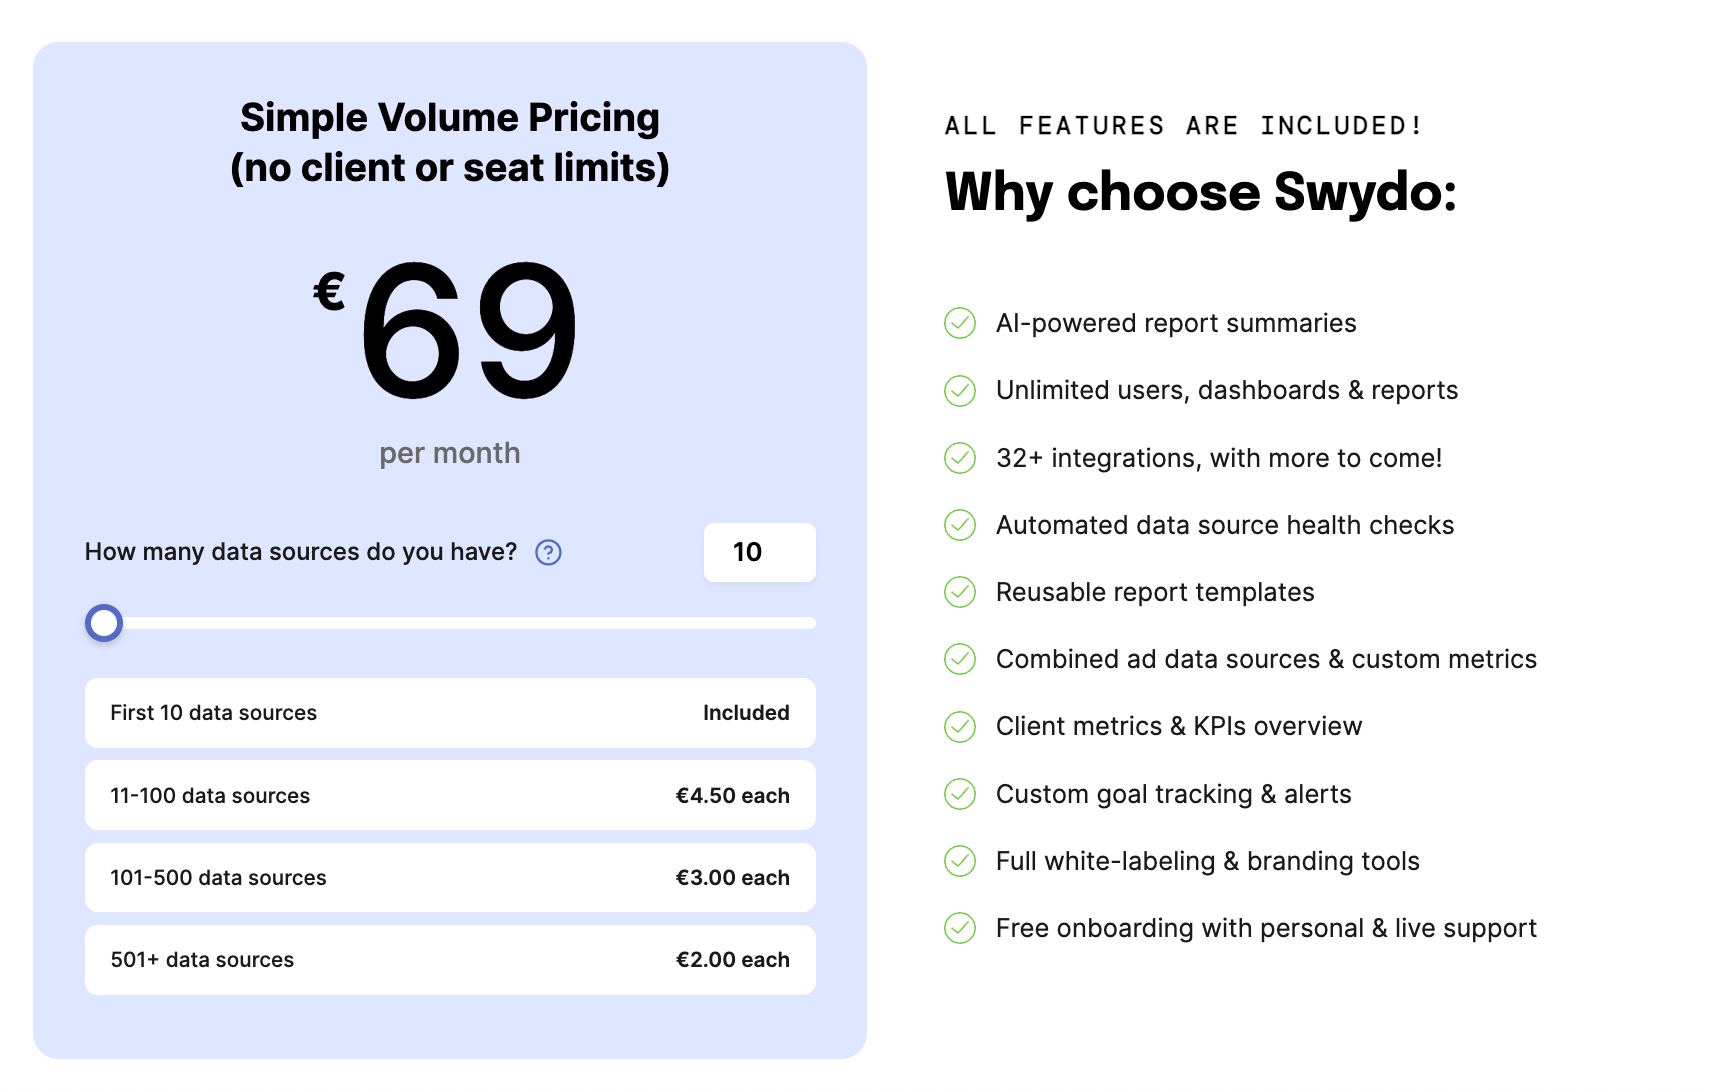
Swydo offers one base pricing plan, and the option to pay extra for more sources.
Here are the pricing plans as of 2026 May:
- Base: $69/mo (10 data sources included).
- Sources 11-100: $4.50/source/mo.
- Sources 101-500: $3.00/source/mo.
- Annual billing saves 10%.
What do real users say about Swydo?
Users respond well to Swydo's clean, professional report output - the white-label reporting looks polished and clients take note. For PPC-focused agencies with a consistent channel setup, the automated scheduling and straightforward interface cover the basics without much friction.
The limitations surface quickly for anything more complex.
One Capterra reviewer summarizes the ceiling well: "One downside is that certain integrations and data visualizations can feel somewhat limited compared to more advanced BI platforms.”
Two specific constraints drive most of the frustration: the 50 data source cap per report, which forces multi-location agencies into manual workarounds, and the lack of drag-and-drop layout control, which makes building custom dashboards more cumbersome than it should be.
Published on Mar 23 2025
WRITTEN BY
Brinda GulatiBrinda Gulati is a fractional content marketer and freelance writer who specializes in data-driven storytelling and writing easy-to-understand, informative content for humans. She has two degrees in Creative Writing from the University of Warwick, and believes that above all, stories are a deeply human endeavor. She has two dogs, knows thrifting spots, and loves afternoon naps.