What is Data Discovery and how it affects businesses?
Data is everywhere. It is all around us. Even now, the fact that you clicked on this article is thanks to some form of data discovery: a process that provided us with visual pattern recognition of a trend that data discovery is a hot topic.

Apr 20 2021 ● 7 min read
Leaving personal data use aside, businesses are striving to employ more and more data-driven methods. Understanding the data is the first step toward being a data-driven company, data-driven companies are increasingly using the data discovery method.
So, what exactly is data discovery? What resources are needed for such a task? What is a data exploration platform? What is a discovery model, and how do you apply it in a real-world business setting?
In this article, we will cover all these topics and will answer some of the most common questions about the data discovery process and tools related to it.
What is Data Discovery Process?
Data discovery is a term used to describe the process of collecting data from multiple sources in order to identify trends using visual data navigation. So, for example, a company looking at audience report can see that there's a spike in users from a certain age group visiting their site. Looking at the broader trend, the company notices that the spike happens periodically, around the same time of the year. From that one graph, the company can draw a conclusion that the best time to run ads about graduation uniform rent is in early summer before students graduate from college.
Before these conclusions can be made, there are 3 stages of the data discovery process:
- Data preparation;
- Data visualization;
- Advanced analytics.
Data preparation - a topic we have covered before. Whatagraph is a great tool for this, but we will touch on tools a bit later. In short, data preparation is the cleaning process, where duplicate data is removed, certain mistakes or missing data is fixed and filled in. It's the crucial first step that is necessary, no matter the BI method used in the company.
Data visualization - this fancy term simply refers to data being transformed into graphs, pie charts, bar charts and other visual forms. While it sounds mundane, the process of visualising data is actually crucial in conducting business intelligence. It helps see patterns that take place over longer periods of time. Visual presentation triggers our primal pattern recognition, and from there we can draw conclusions that drive our business forward.
Advanced analytics - once the data has been cleaned and visualised, more advanced analytics can take place. That's what we call advanced guided analytics. This term refers to the possibility of everyone becoming a data scientist and using visualised, ready-made analytics tools to make smart decisions about their business niche. It can be anything, from an HR manager trying to figure out what causes high employee turnaround, to a marketer, figuring out why their PPC has suddenly stopped performing.
The challenge of data discovery lies in choosing the right tools that provide access to smart data discovery for all levels of business users.
Data Discovery Tools
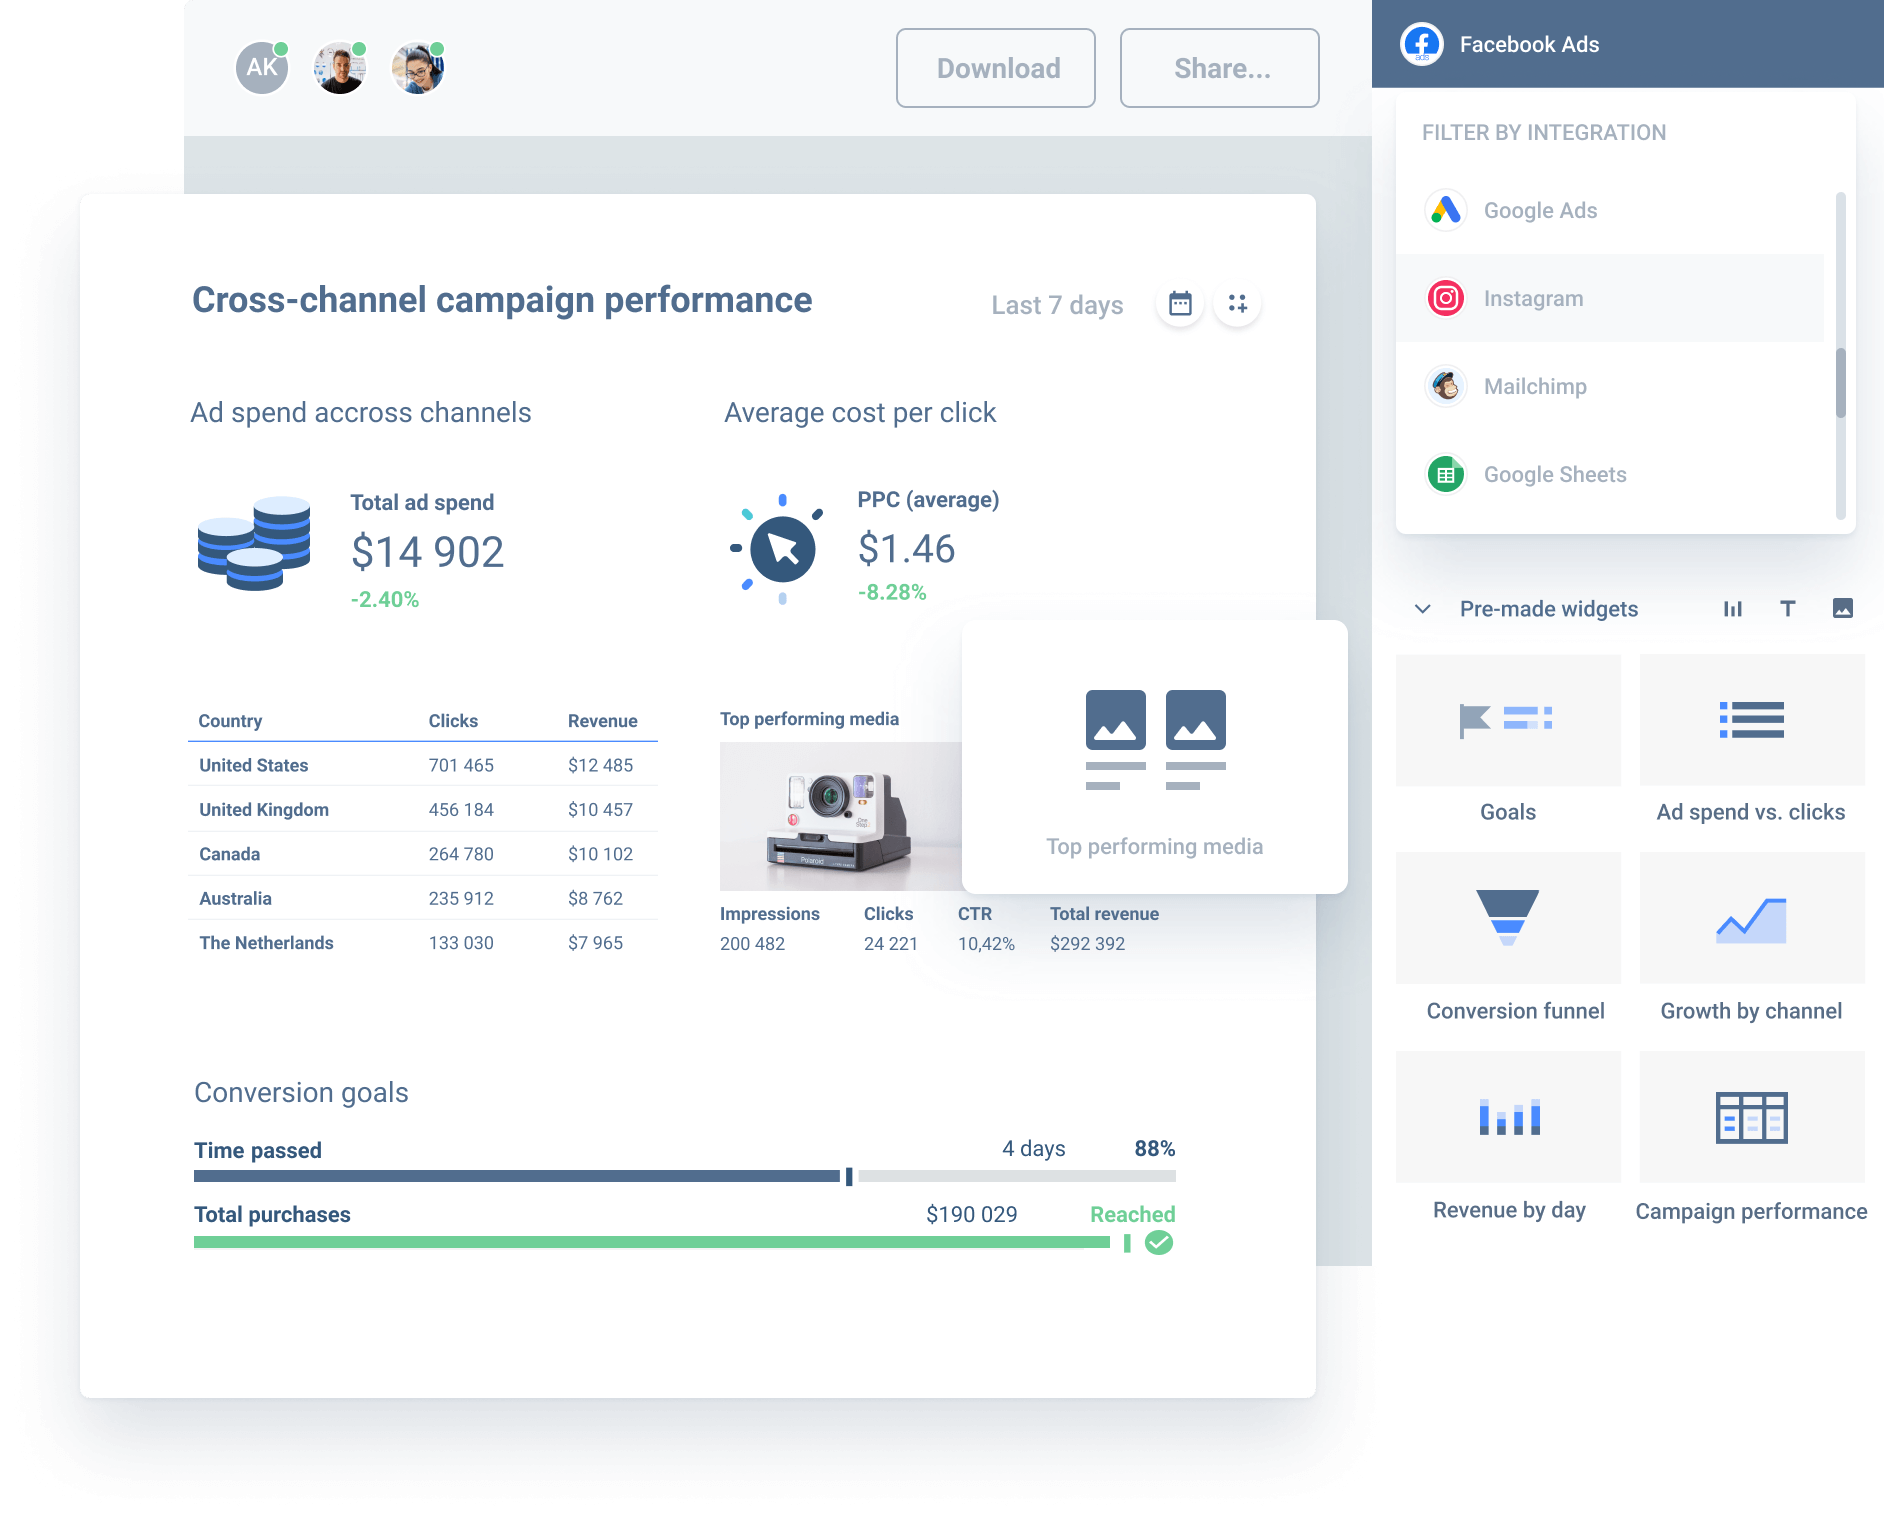
In this day and age, obviously, no one sifts through large stacks of printed Excel sheets, gathering data to fill in a single graph. Everything happens digitally, within seconds. Tools take in a lot of raw data straight from the source, transform it, visualise it and display it in clear-cut reports to be interpreted.
To pick the right tool, there's a checklist of features you should go through and see which one ticks the most out of that list.
- Quick and responsive: the tool should have quick data refresh rates and feel intuitive. Drag & drop functions would be a huge step forward in that direction.
- Able to handle big data: the platform should be able to handle large quantities of data from multiple sources without lagging.
- Visuals over sheets: if the tool subscribes to the data discovery process, it should have the possibility to display all bits of data visually, and have it as a priority.
- Flexibility and independence: everyone performing data analysis using the platform shouldn't need to rely on IT experts or data scientists in order to make insightful reports.
Whatagraph ticks all these boxes. As a data discovery and advanced BI platform, it's incredibly intuitive and powerful, able to handle vast amount of data. Whatagraph focuses on turning everyone into data scientist, without involving complex processes or many specialists.
Why data discovery is so important?
With the advent of data-driven business approach comes the need for bigger and bigger data sets that are processed faster, and presented for correct interpretations. Smart data discovery gained this much popularity, because business users could rely on the process for current analysis of every business decision.
More than that, data analytics have penetrated almost every step of business processes. From paid marketing channels, to HR recruitment, to even office management - analysis of some degree is done at every organization level. This data integration demands quick access to BI without extensive training. Data discovery process serves this exact purpose, allowing business users access to complex BI is visual form and without expensive, time-consuming training. Best case is if they simply receive processed data to their work email and plan their business operations accordingly.
Conclusion
Data discovery is here to stay. It targets the average business user, who requires plug-and-play analytics from multiple data sources. With artificial intelligence augmentations on the way, data discovery process is poised to evolve further and further improve businesses, giving more freedom to their decision-makers.
Q: What is the purpose of data discovery?
Here are the main purposes of data discovery that you need to know.
a) Discover the pressure points
The first step toward company-wide data understanding is identifying your pain points, or the barriers to being a better, more intelligent business organization with more business users. While every company is unique, and one size does not suit everything, some pain points often cross over from one to the other.
b) Connect multiple data sources to reach deeper insights.
As you are very much aware, data comes from a variety of sources, both structured and unstructured. By extracting it from your current sources and viewing them in a new light, you have the potential to uncover new insights that will drive the company forward.
c) Create a data discovery model.
What exactly is a data discovery model? Fundamentally, this type of model is a proactive approach to data use. They usually include the collection, curation, and review of data, as well as the data-driven behavior that a company takes in response to the discovery of new insights that prove critical to the business's growth.
d) Use your data to tell stories.
One of the most important ways to ensure the company is completely data-driven is to be able to build an easy-to-follow, inspiring narrative for your data – one that everybody inside the organization, regardless of technological competency, can get behind.
Q: What is data discovery and visualization?
Data visualizations and visual data exploration can help a wide range of users, from data scientists working with big data to nontechnical business managers and frontline users, see important trends and patterns in data that they may have missed in large tabular reports and spreadsheets. As big volumes expand and companies strive to incorporate diverse and complex information, data visualization becomes increasingly important in users' ability to comprehend information quickly and put it to productive use.
The advancement of business intelligence technology is allowing for richer and more exciting data visualization for organizational alerting, dashboards, and deeper analytics organizations. The availability of new data forms, such as geospatial data, expands data visualization's ability to provide users with various aspects and angles on integrated data sources.
Q: What is data discovery and classification?
Data Discovery & Classification is the process of finding and cateforizing data points. For example, if your unstructured data set contains information on customer gender and age, the classification process will assign labels to these data points in order to form a better data modeling. Here are the steps usually taking place in classifying datasets:
- Discovery and recommendations: in this step, raw unstructured data is reviewed and recommended labels are assigned. These are given based on data relationships, pattern recognition and other parameters, coded into the program.
- Labelling: the actual labelling occurs in this step, based on recommended type of labels. The software is given the go-ahead to label each data point correctly.
- Auditing: Once the data points are labeled, a quick audit is necessary. Even after recommendations and labeling reviewed by people, this auditing step is necessary before moving to the visualisation.
- Visualisation: Here's where correctly labeled and audited data sets can be transformed into visually accessible information, primed to help solve business problems and provide data insights. The end result should be usable by citizen data scientists and data specialists alike.
Published on Apr 20 2021
WRITTEN BY
Indrė Jankutė-CarmaciuIndrė is a copywriter at Whatagraph with extensive experience in search engine optimization and public relations. She holds a degree in International Relations, while her professional background includes different marketing and advertising niches. She manages to merge marketing strategy and public speaking while educating readers on how to automate their businesses.