How to Create Google Ads Reports for Clients + Examples
Google Ads reports for clients shouldn’t feel like a pain to create—or to read. Yet, agencies spend hours crafting them, only for clients to have trouble understanding them.
To help you create Google Ads reports your clients will love (and can rely on), I've created this guide.

Mar 29 2025●5 min read


If you’re a marketing specialist or an agency leader, you probably want to create Google Ads reports that:
✅ Show real business impact, without forcing clients to dig for insights
✅ Have clear visuals, so clients have an easy time understanding the ROI
✅ Rely on real-time data, so that connectors won't fail
✅ Save you time, while keeping clients informed
If you’re looking for all the above, you’re in for a treat. Below, I’ve shared the exact steps for creating effective Google Ads reports—without spending hours on them.
How to Create Google Ads Reports for Clients: 3 Tips from Agency Leaders
Before I wrote this article, our team asked marketing agency leaders for tips on creating effective Google Ads reports.
We spoke to three agency experts:
- Stephen Samuel, CEO & Founder of NexFusion (digital marketing automation agency)
- Chris Coussons, CEO & founder of Visionary Marketing (Google Ads agency)
- Anton Kovalchuk, Founder of QliqQliq (digital marketing agency)
Their responses were loud and clear. This is what they said:
Tip 1: Avoid Information Overload
Clients don’t need 20+ pages of data—they want insights that matter.
Like Stephen Samuel, the founder of NexFusion says, “The biggest mistake is dumping a spreadsheet of metrics with no context.”
Stephen recommends creating a one-page executive summary with three clear sections:
- What is working
- What needs improvement
- The action plan for the next month.
"This keeps the report digestible and helps clients make informed decisions quickly,” he continues.
Chris Coussons from Visionary Marketing prioritizes key takeaways upfront, such as conversion and cost-per-lead changes.
“Then, for clients who like the details, we include a deeper breakdown,” he adds.
Tip 2: Focus On Metrics That Matter
The temptation to track everything is real, but it can lead to confusion for clients.
Anton Kovalchuk, the Founder of QliqQliq, recommends focusing on four key metrics on your Google Adwords reports for clients:
- Conversions
- Cost per acquisition (CPA)
- Return on ad spend (ROAS)
- Click-through rate (CTR)
These are the key agency metrics and KPIs that other agency experts also recommended focusing on.
To this, Chris Coussons added a key metric that has helped them:
One overlooked metric that’s been a game-changer for us is first-click vs. last-click conversions. It helps clients see the bigger picture of how their ads contribute across the funnel, rather than just giving credit to the last interaction.
Tip 3: Don’t Overlook Automation And AI
Experts agree that you should automate parts of Google Ads reporting.
The main reason is: It can turn your client reporting process from taking hours into minutes.
Anton Kovalchuk says, “If I could automate one part of reporting, it would be custom annotations within Looker Studio.”
What Anton is referring to is Looker Studio’s lack of AI for creating Google Ads campaign insights: “We still manually add insights and recommendations alongside charts.”
This means spending extra time identifying risks, summing up issues, finding trends, etc.
He then says, “Real-time suggestions would make reporting even smoother”.
While Looker Studio lacks automated insights, Whatagraph solves this through two innovative AI features.
- AI chatbot. You can ask our AI chatbot any questions about your data, just like you would ask your personal data expert.
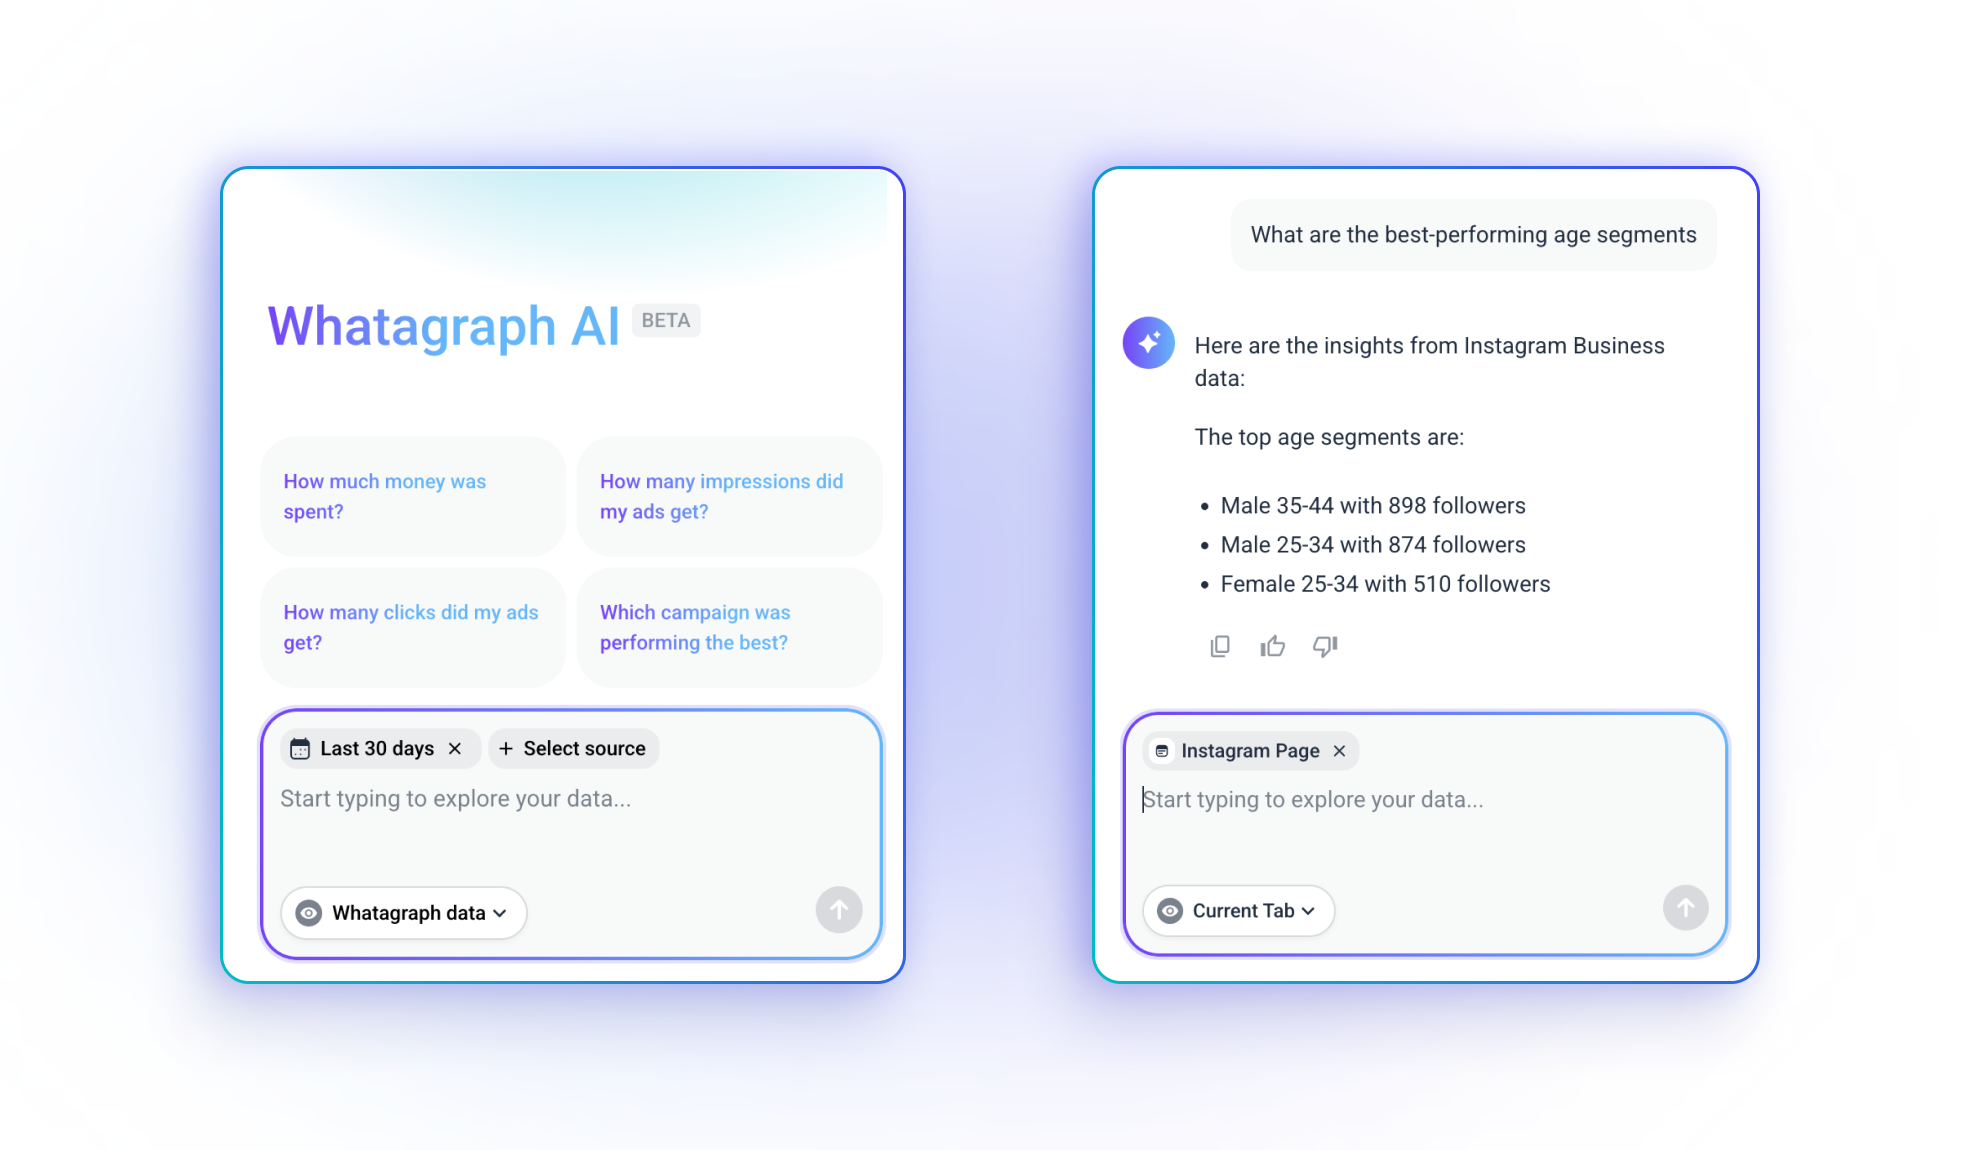
- AI summaries. You can use our AI report summary feature to summarize key points of your campaigns automatically.
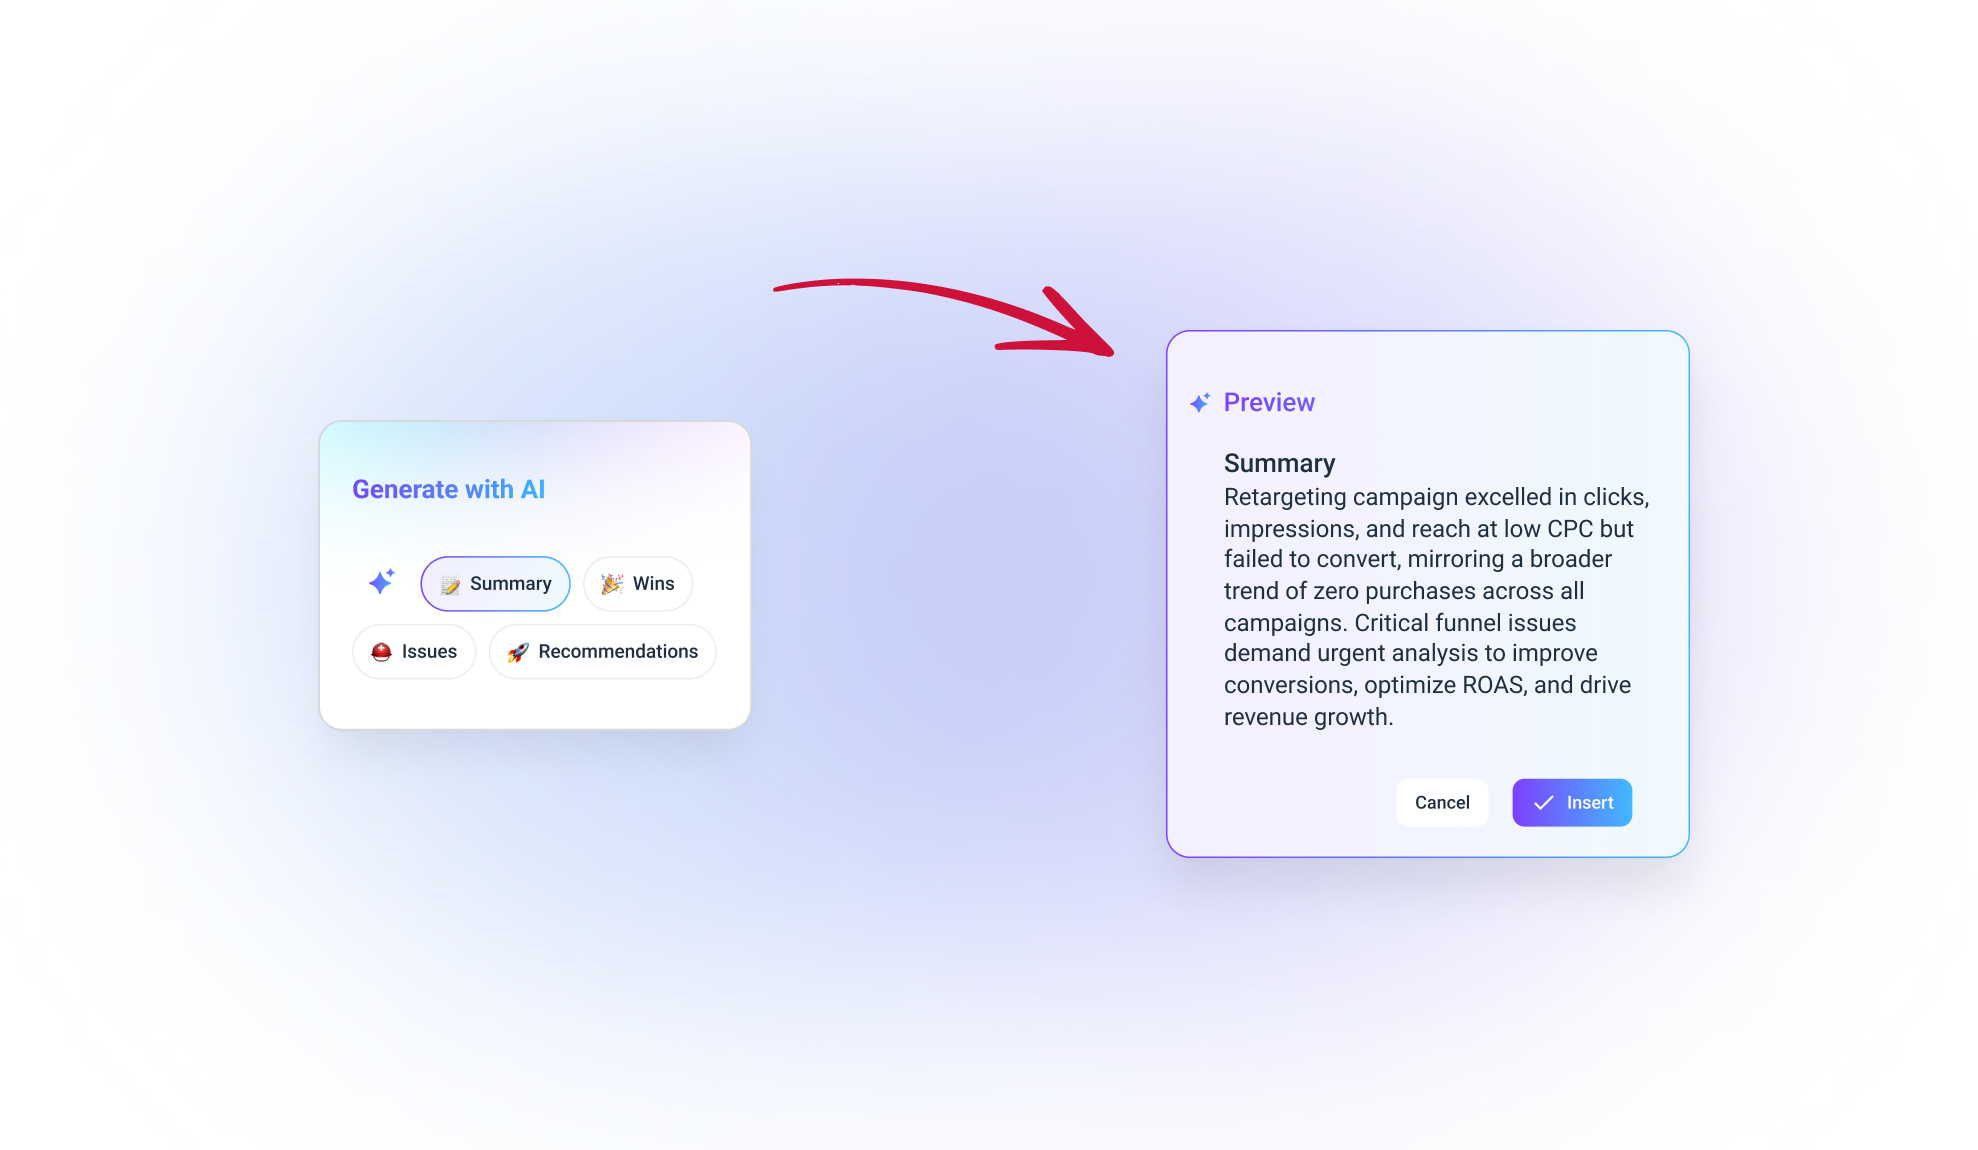
If needed, you can edit the AI insights further to give a more personal touch.
How to Structure a Google Ads Report for Clients: Step by Step
Let’s now look at the main topic — structuring your Google Ads report for clients.
The six sections of a Google Ads report for clients are:
- Executive summary — Provide a high-level overview of the most important takeaways.
- Campaign performance overview — Share key ad performance metrics that prove the ROI for clients.
- Performance by campaign — Dive deeper into each campaign’s performance.
- Conversion tracking & funnel performance — Break down conversion trends and suggestions based on funnel data.
- Granular analysis — Look closer to performance by device, location, keywords, and ad groups.
- Next steps & recommendations — Give insights into the key findings and offer clear next steps.
With that said, I’ll explain each step in more detail below.
Step 1: Executive Summary
An executive summary is the first thing your clients see when opening a Google Adwords client report.
The main goal in this section? Give your clients a high-level overview of the most important takeaways from the report (without overwhelming them with too much detail).
How to add this to your Google Ads report:
- Use bullet-point format: Summarize key metrics (ROAS, CTR, CPC, spend, clicks, etc.) in bullet points.
- Keep it short and easy to digest: Give clients the main insights within seconds—without using overly technical language.
- Highlight wins and concerns: Don’t just list raw numbers. Frame wins and concerns as actionable insights. Examples include:
✅ "We spent $49,000 on ads, bringing in 27,000 impressions, 1250 clicks, and 19 conversions."
✅ "ROAS is just shy of our target at 0.99, but CTR increased from 0.64% to 1.14%, indicating better audience engagement."
❌ Avoid: “The CPC variance between Q1 and Q4 was statistically insignificant.” (Too complex for clients).
❌ Avoid: “Your ad set’s impression share decreased by 2.4%.” (Okay… but what does that mean for them?)
Step 2: Campaign Performance Overview
Remember the expert tip about focusing on metrics that matter? This is where it becomes relevant. In your campaign performance overview, highlight key metrics that matter to clients, such as impressions, CTR, CPC, etc.
How to add this to your Google Ads report:
- Create a summary table of all campaigns, showing:
- Impressions (how many times the ads were seen)
- Clicks (how many people engaged)
- CTR (Click-Through Rate)
- Conversions & Conversion Rate (how many actions were completed)
- Cost per Conversion (efficiency metric)
- Cost per click (CPC)
Step 3: Performance By Campaign
This is where you start comparing the performance on a per-campaign basis.
Compare the performance of individual campaigns and share what worked well, what didn't work well, and what can be adjusted for future campaigns.
How to add this to your Google Ads report:
- Compare individual campaigns with:
- Spend vs. budget
- Cost per conversion
- CTR comparison
- Insights for each campaign
- Focus on sharing insights, not just numbers: Clients want to know why a campaign succeeded or struggled. Examples include:
✅ "The PPC campaign achieved the lowest cost per conversion ($3.29), outperforming other campaigns despite lower total spend."
✅ "Campaign B’s high click volume (58 clicks) but low conversion rate suggests we need to refine the landing page experience."
❌ Avoid: “Campaign A had a 2.3% CTR, Campaign B had 4.4% CTR, and Campaign C had 3.6% CTR.” (Too many numbers, no context)
Step 4: Conversion Tracking & Funnel Performance
Tracking conversions is more than just counting sales—it’s about understanding how users move through the conversion funnel. This section helps pinpoint weak and strong points in your conversion funnel.
How to add this to your Google Ads report:
- Break down the conversion funnel:
- Show conversion funnel steps, “Impressions,” → “Clicks,” → “Conversions,” → and “ROAS”
- Identify drop-off points (e.g., high number of clicks but no conversions)
- Suggest optimizations based on funnel data: Examples include:
✅ “We saw a 3.87% click-through rate, but only 1.01% of users converted—suggesting a need for landing page improvements.”
✅ "Our ROAS is currently 0.99, meaning we’re just breaking even. Optimizing ad spend could increase profitability."
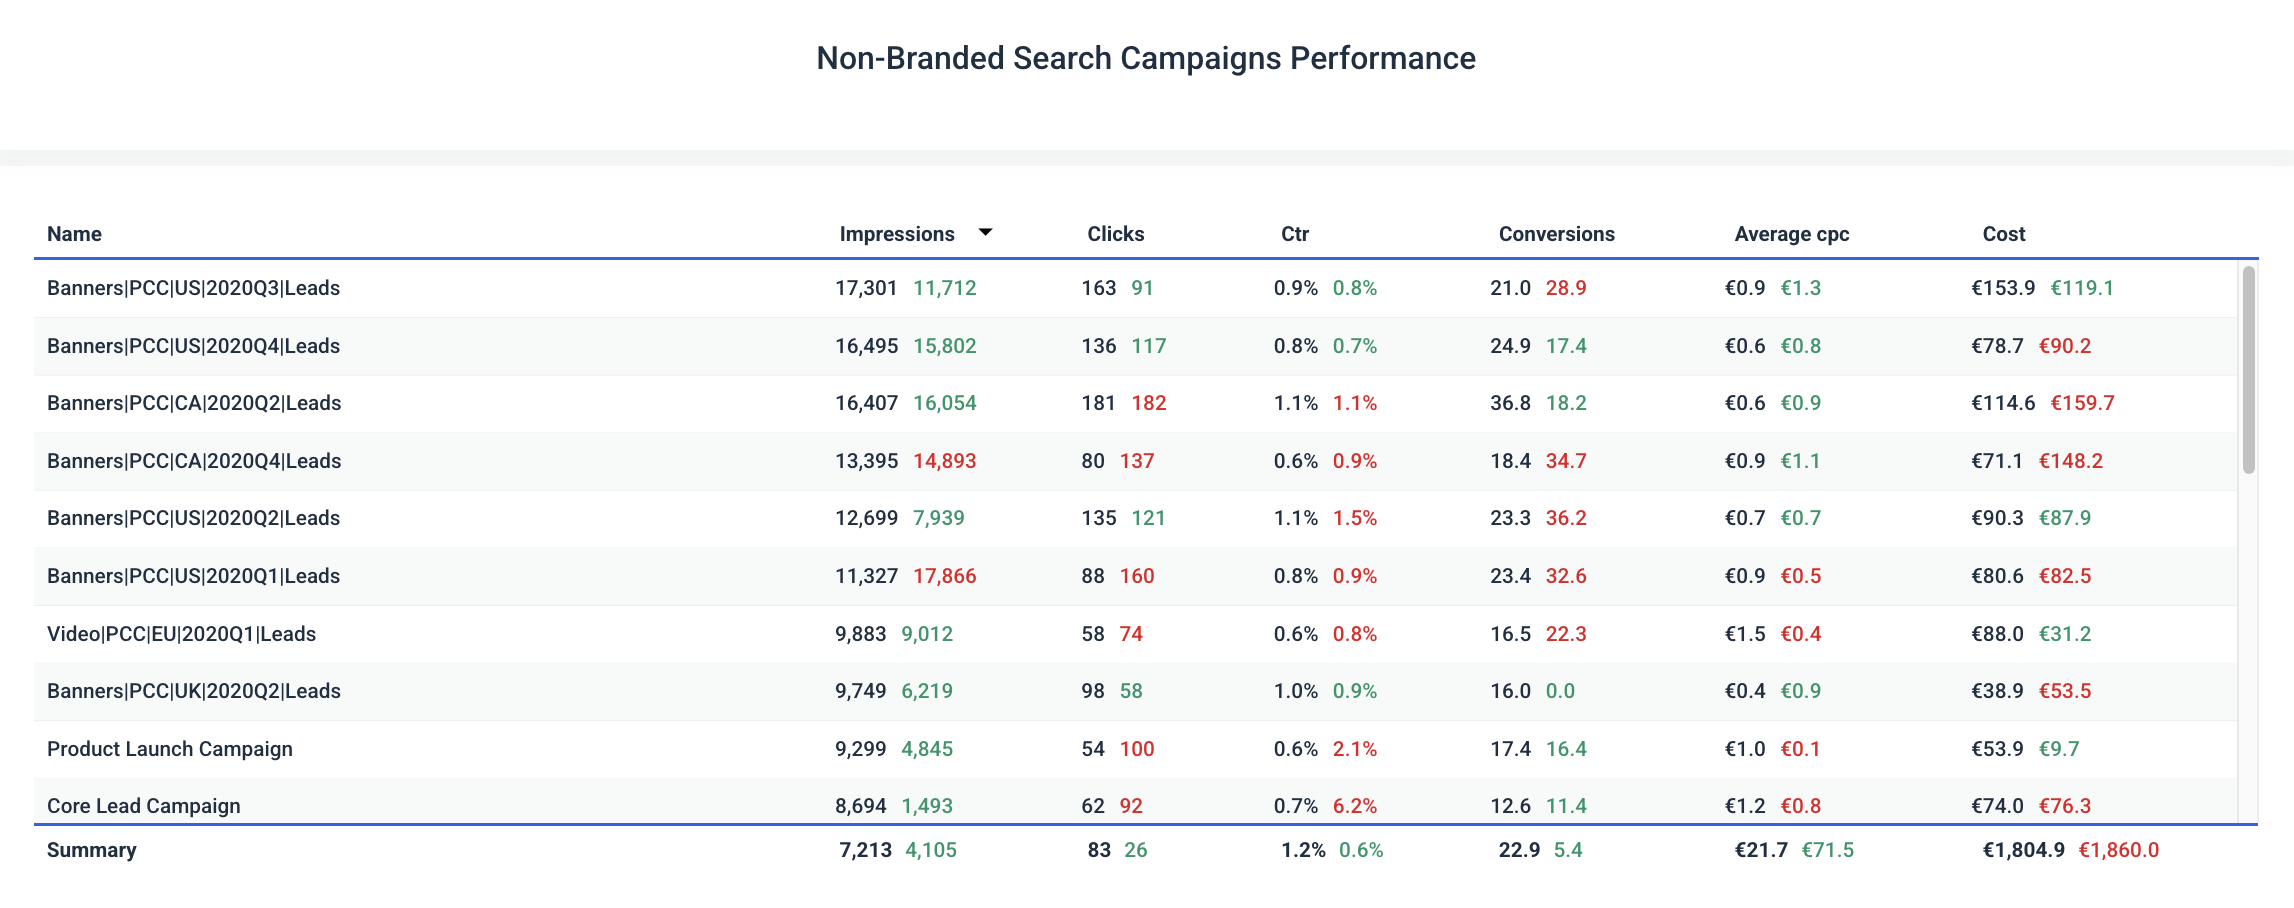
Step 5: Granular Analysis (Devices, Locations, Keywords, Ad Groups)
The granular analysis breaks down performance by different devices, locations, keywords, and ad groups. In my opinion, it’s great for understanding campaign performance at a deeper level and gaining data for making small tweaks.
How to add this to your Google Ads report:
- Show performance by device: Compare desktop, mobile, and tablet performance and share which performed the best.
- Show performance by location: Identify the cities and countries where ads performed best and worst.
- Show performance by keyword: Display which keywords drove the most conversions.
- Show ad group performance: See which ad groups contributed most to results.
- Suggest optimizations based on the data: Examples include:
✅ "Mobile had a higher click-through rate (1.30%) but a lower conversion rate (0.87%)—indicating potential issues with mobile site UX."
✅ “The ad group A outperformed B and C in clicks and conversions, indicating we create and scale similar ad creatives.“
Step 6: Next Steps & Recommendations
This section should tie everything together. Based on all the performance data you’ve gathered, give your clients clear next steps and actionable recommendations.
How to add this to your Google Ads report:
- Summarize top insights and outline clear next actions: Help clients clearly understand the current situation and what's to come.
- Prioritize 1-3 key focus areas for improvement. For example:
1️⃣ Improve Mobile UX: High mobile CTR, but conversions are lagging. Test landing page speed and form usability.
2️⃣ Reallocate Budget: Campaign B is underperforming; shift budget to better-performing Campaign C.
3️⃣ A/B Test Ad Copy: Keywords related to discounts are converting well—test more pricing-focused messaging.
- Give direct and actionable guidance: Clients should know exactly what to do next. Example phrasing:
✅ "We recommend shifting $5,000 from Campaign B to Campaign C, as C has a higher conversion rate (22.59%) at a lower CPC ($0.77)."
✅ "To boost ROAS, we should test dynamic ad creative to match search intent better."
3 Great Google Ads Report Examples
Interested in actual Google Ads report examples? I’ve shared three different great examples below.
Note: These are marketing report templates from Whatagraph.
Example 1: PPC Report for Clients
What makes this a great Google Ads report:
- Tabs for easy cross-channel reporting: I love how easy it is to switch between the different tabs for Google Ads, Meta Ads, etc. Each tab shows an overview of what’s working (and what needs improvements).
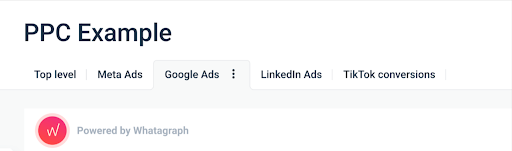
- Customizable icons and images: The report's icons and images give it a unique visual appeal. Whatagraph users can choose icons from our icon library (or upload their own icons).
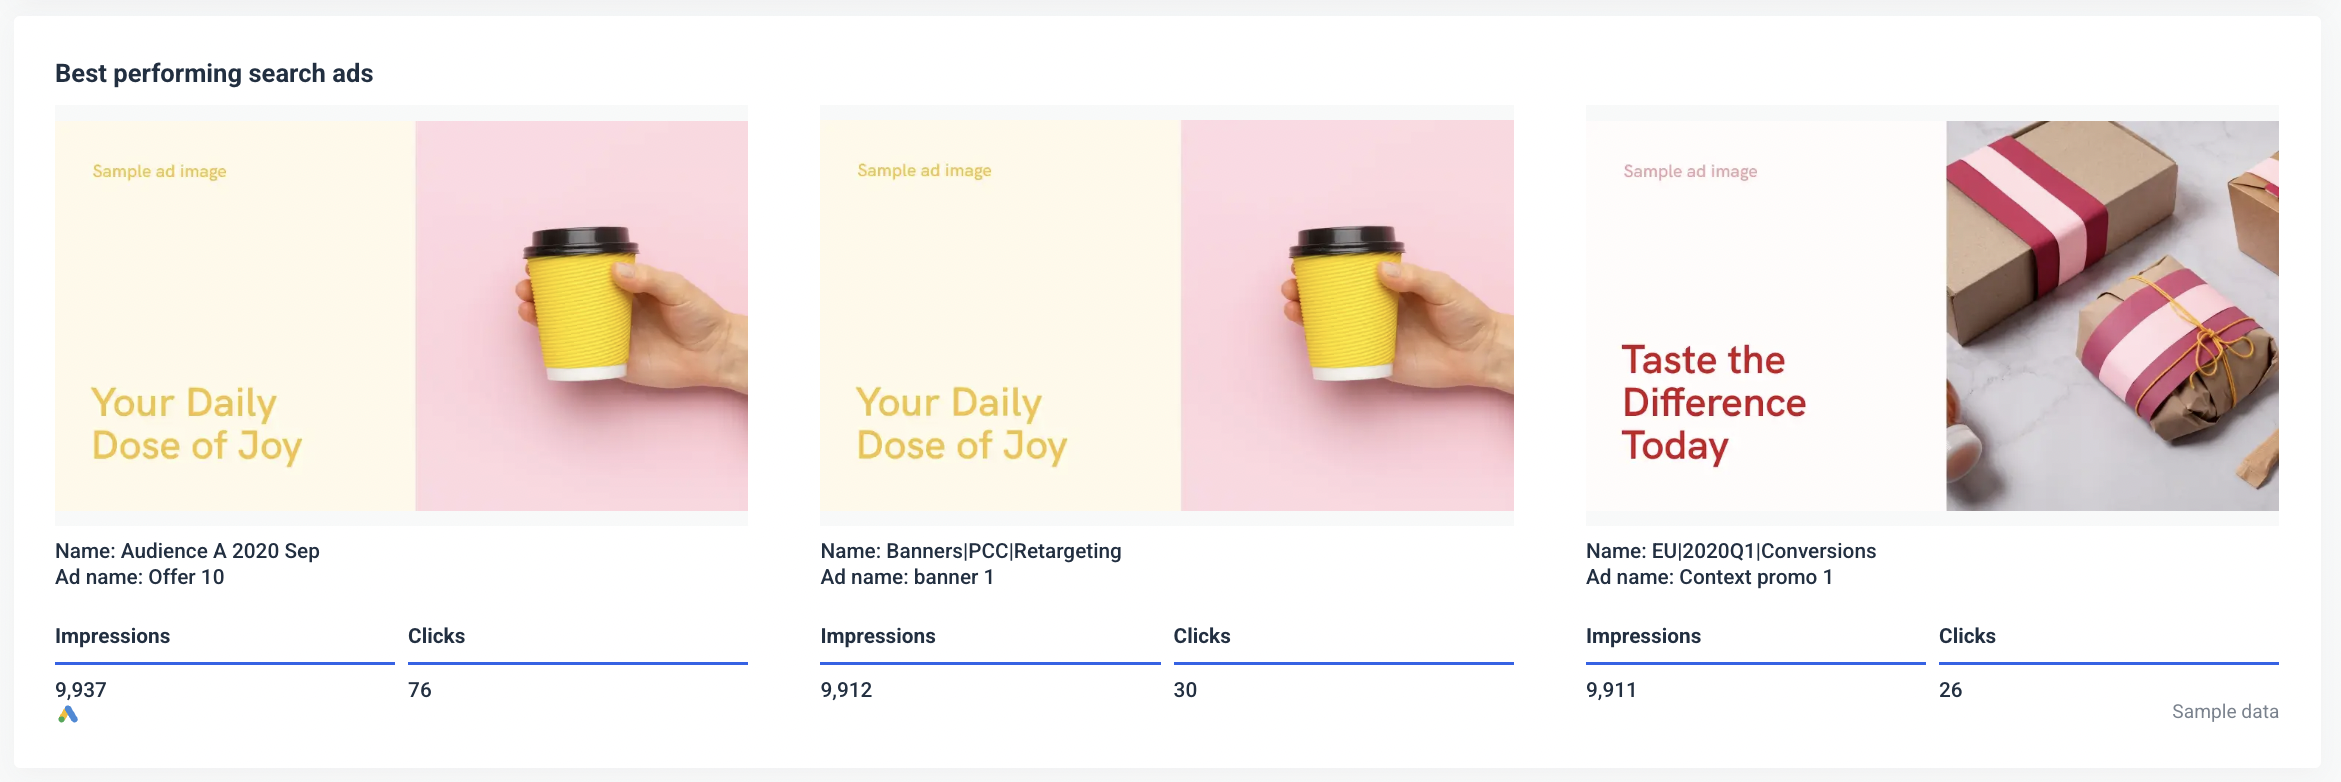
- Best-performing ads: The "Best-performing search ads” section shows the top-performing ads, which I think is great for giving clients a quick overview of what's working.
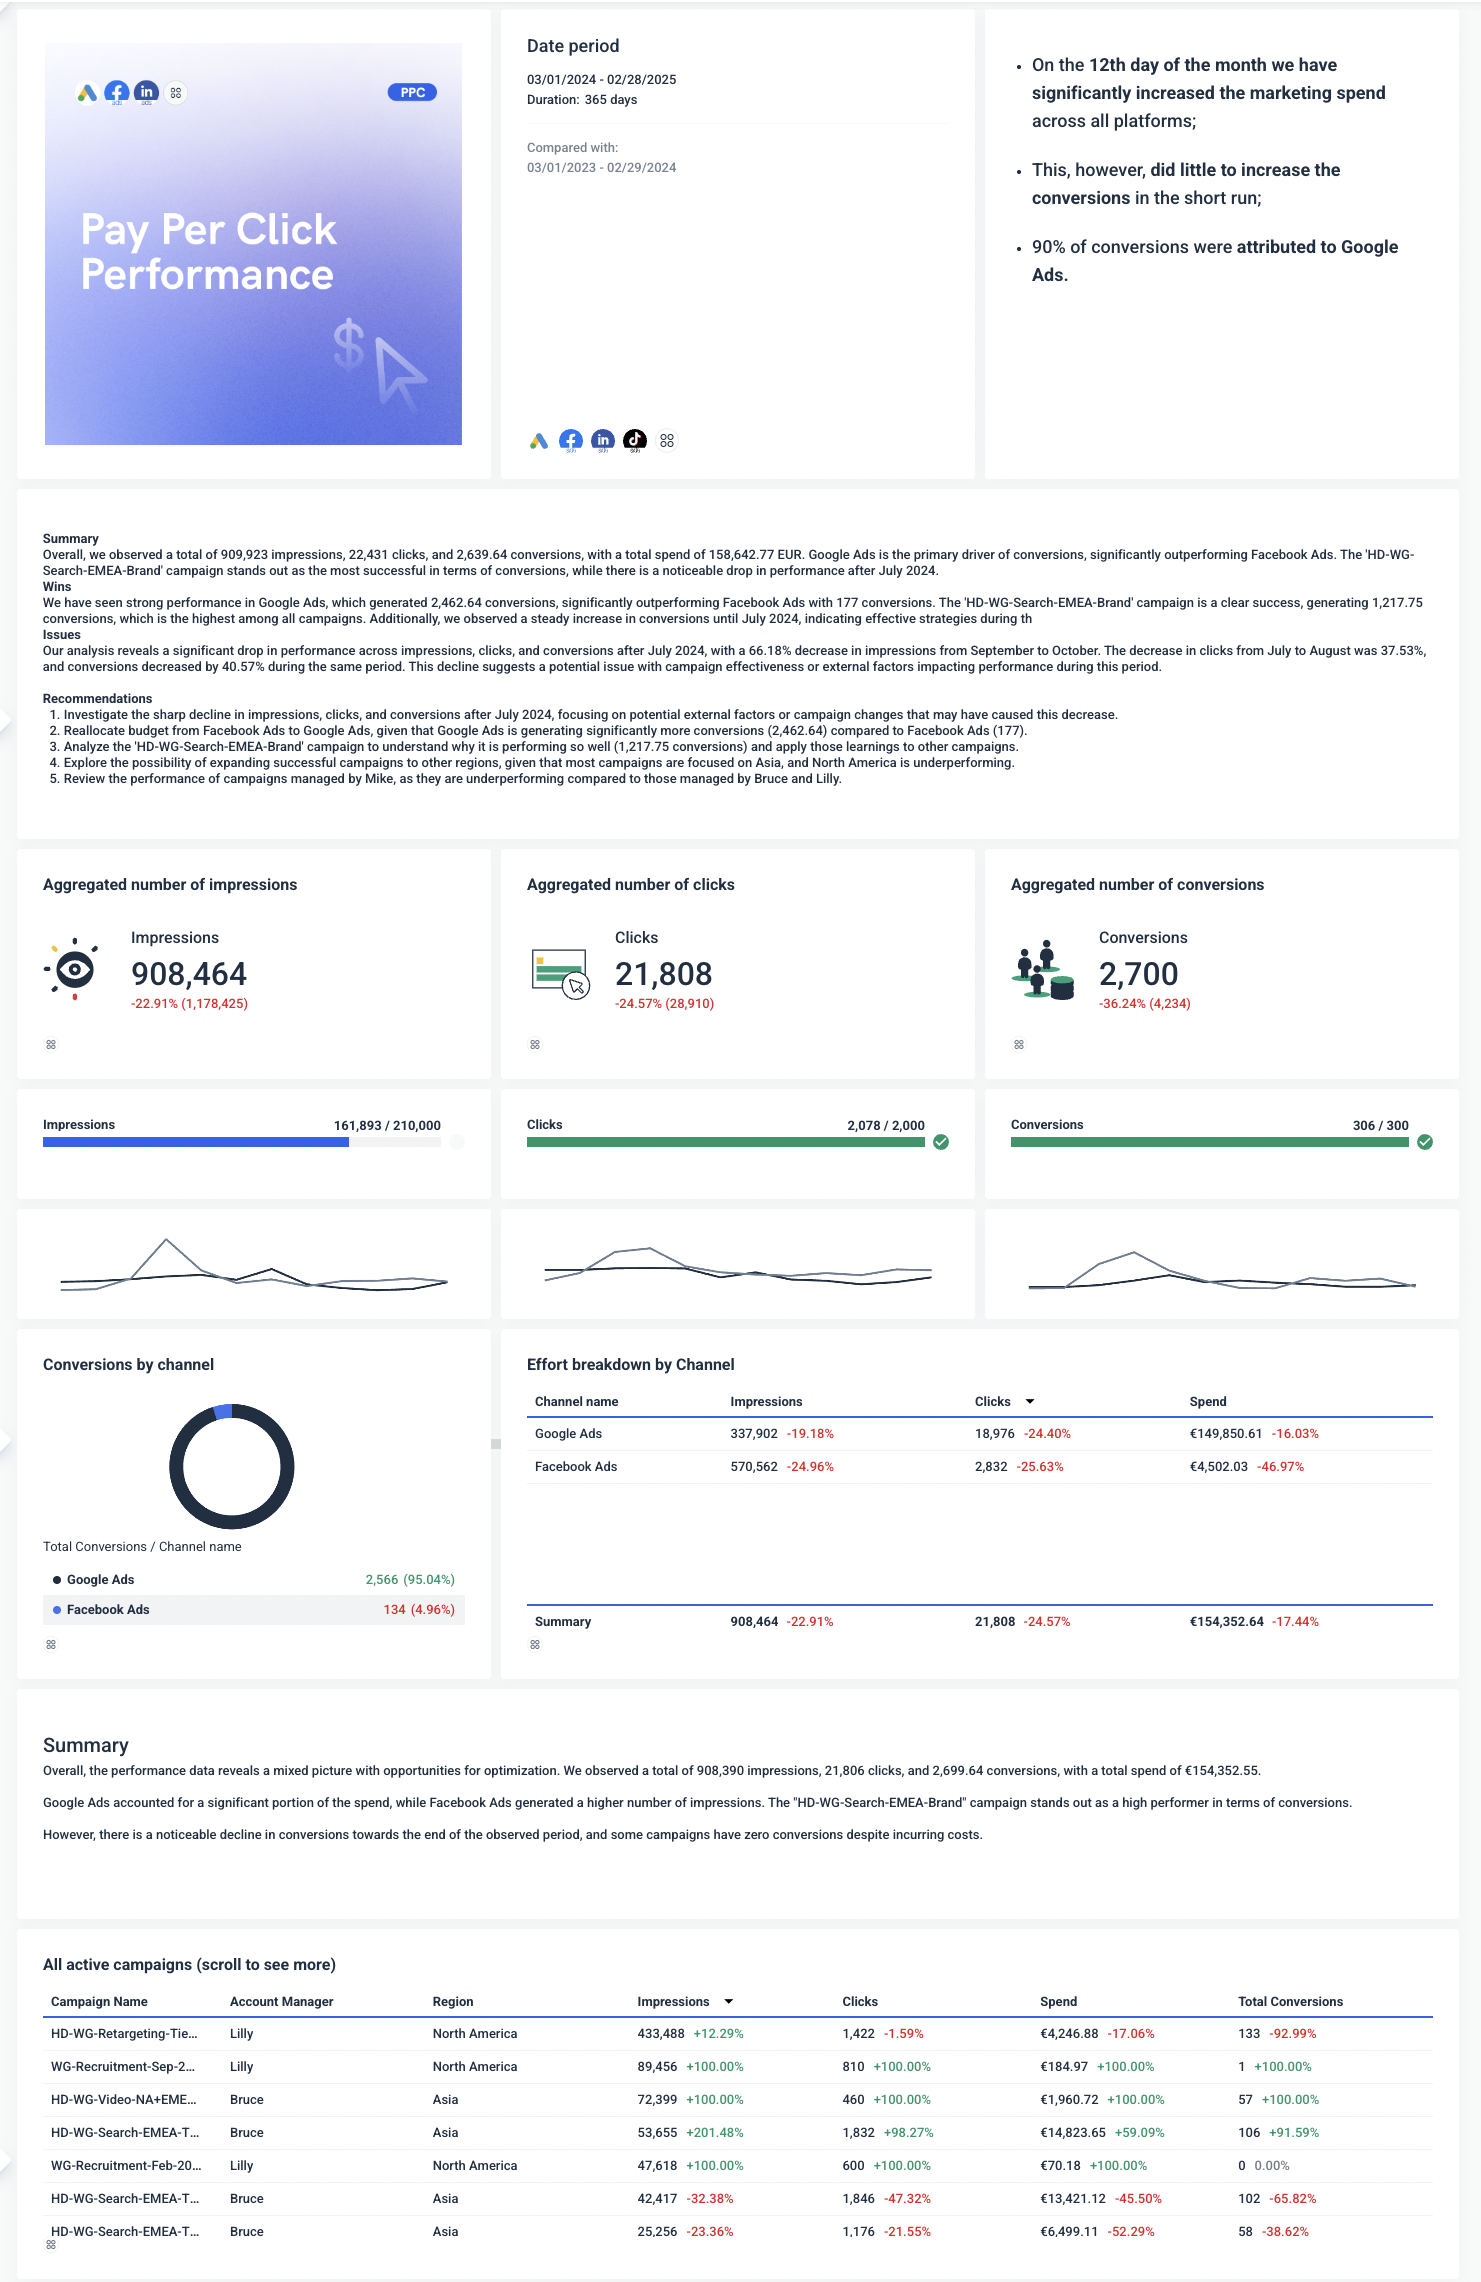
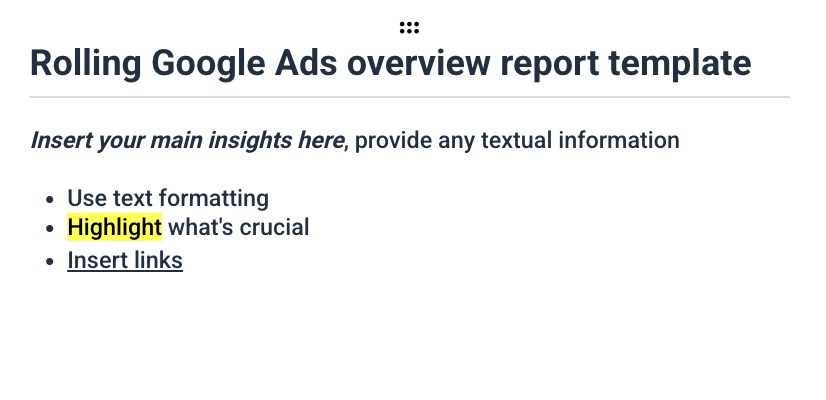
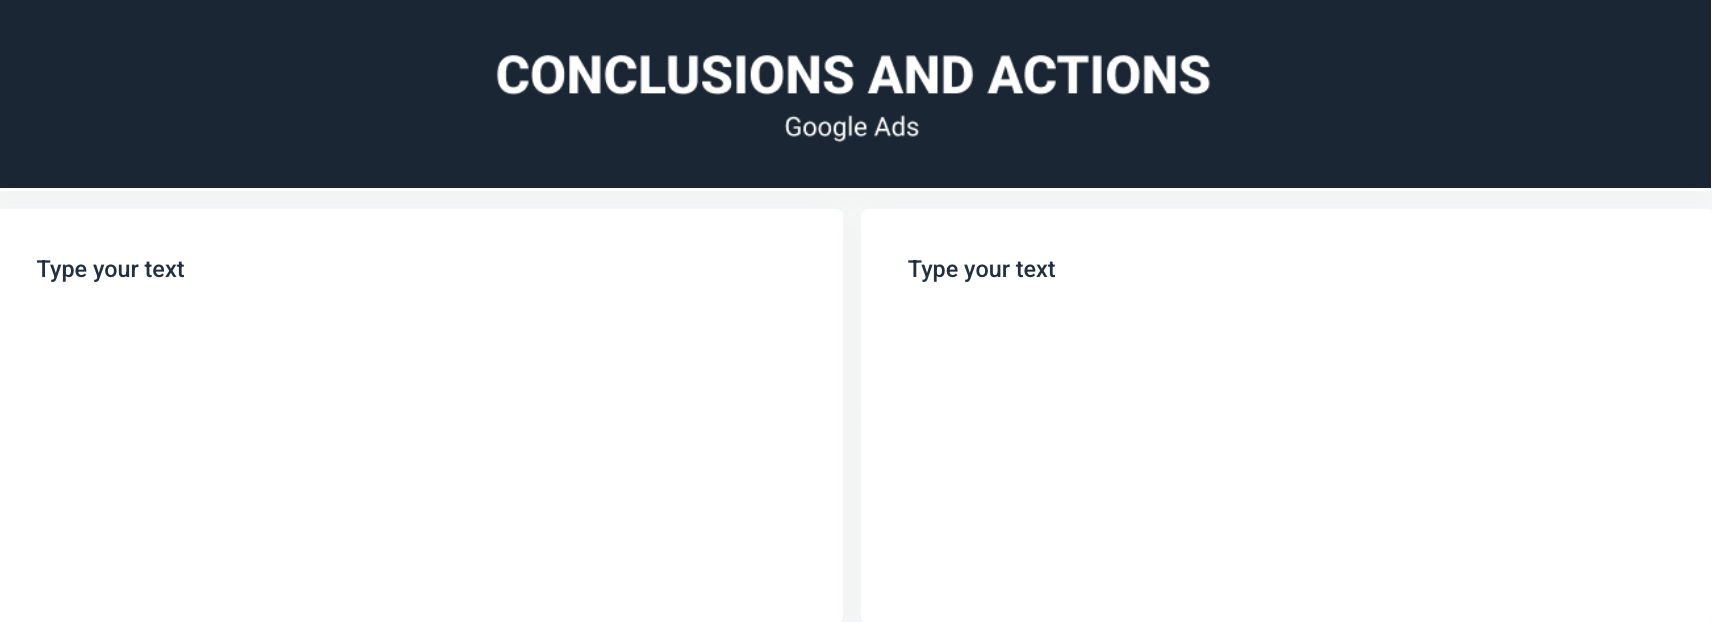
Example 2: Google Ads Overview Report
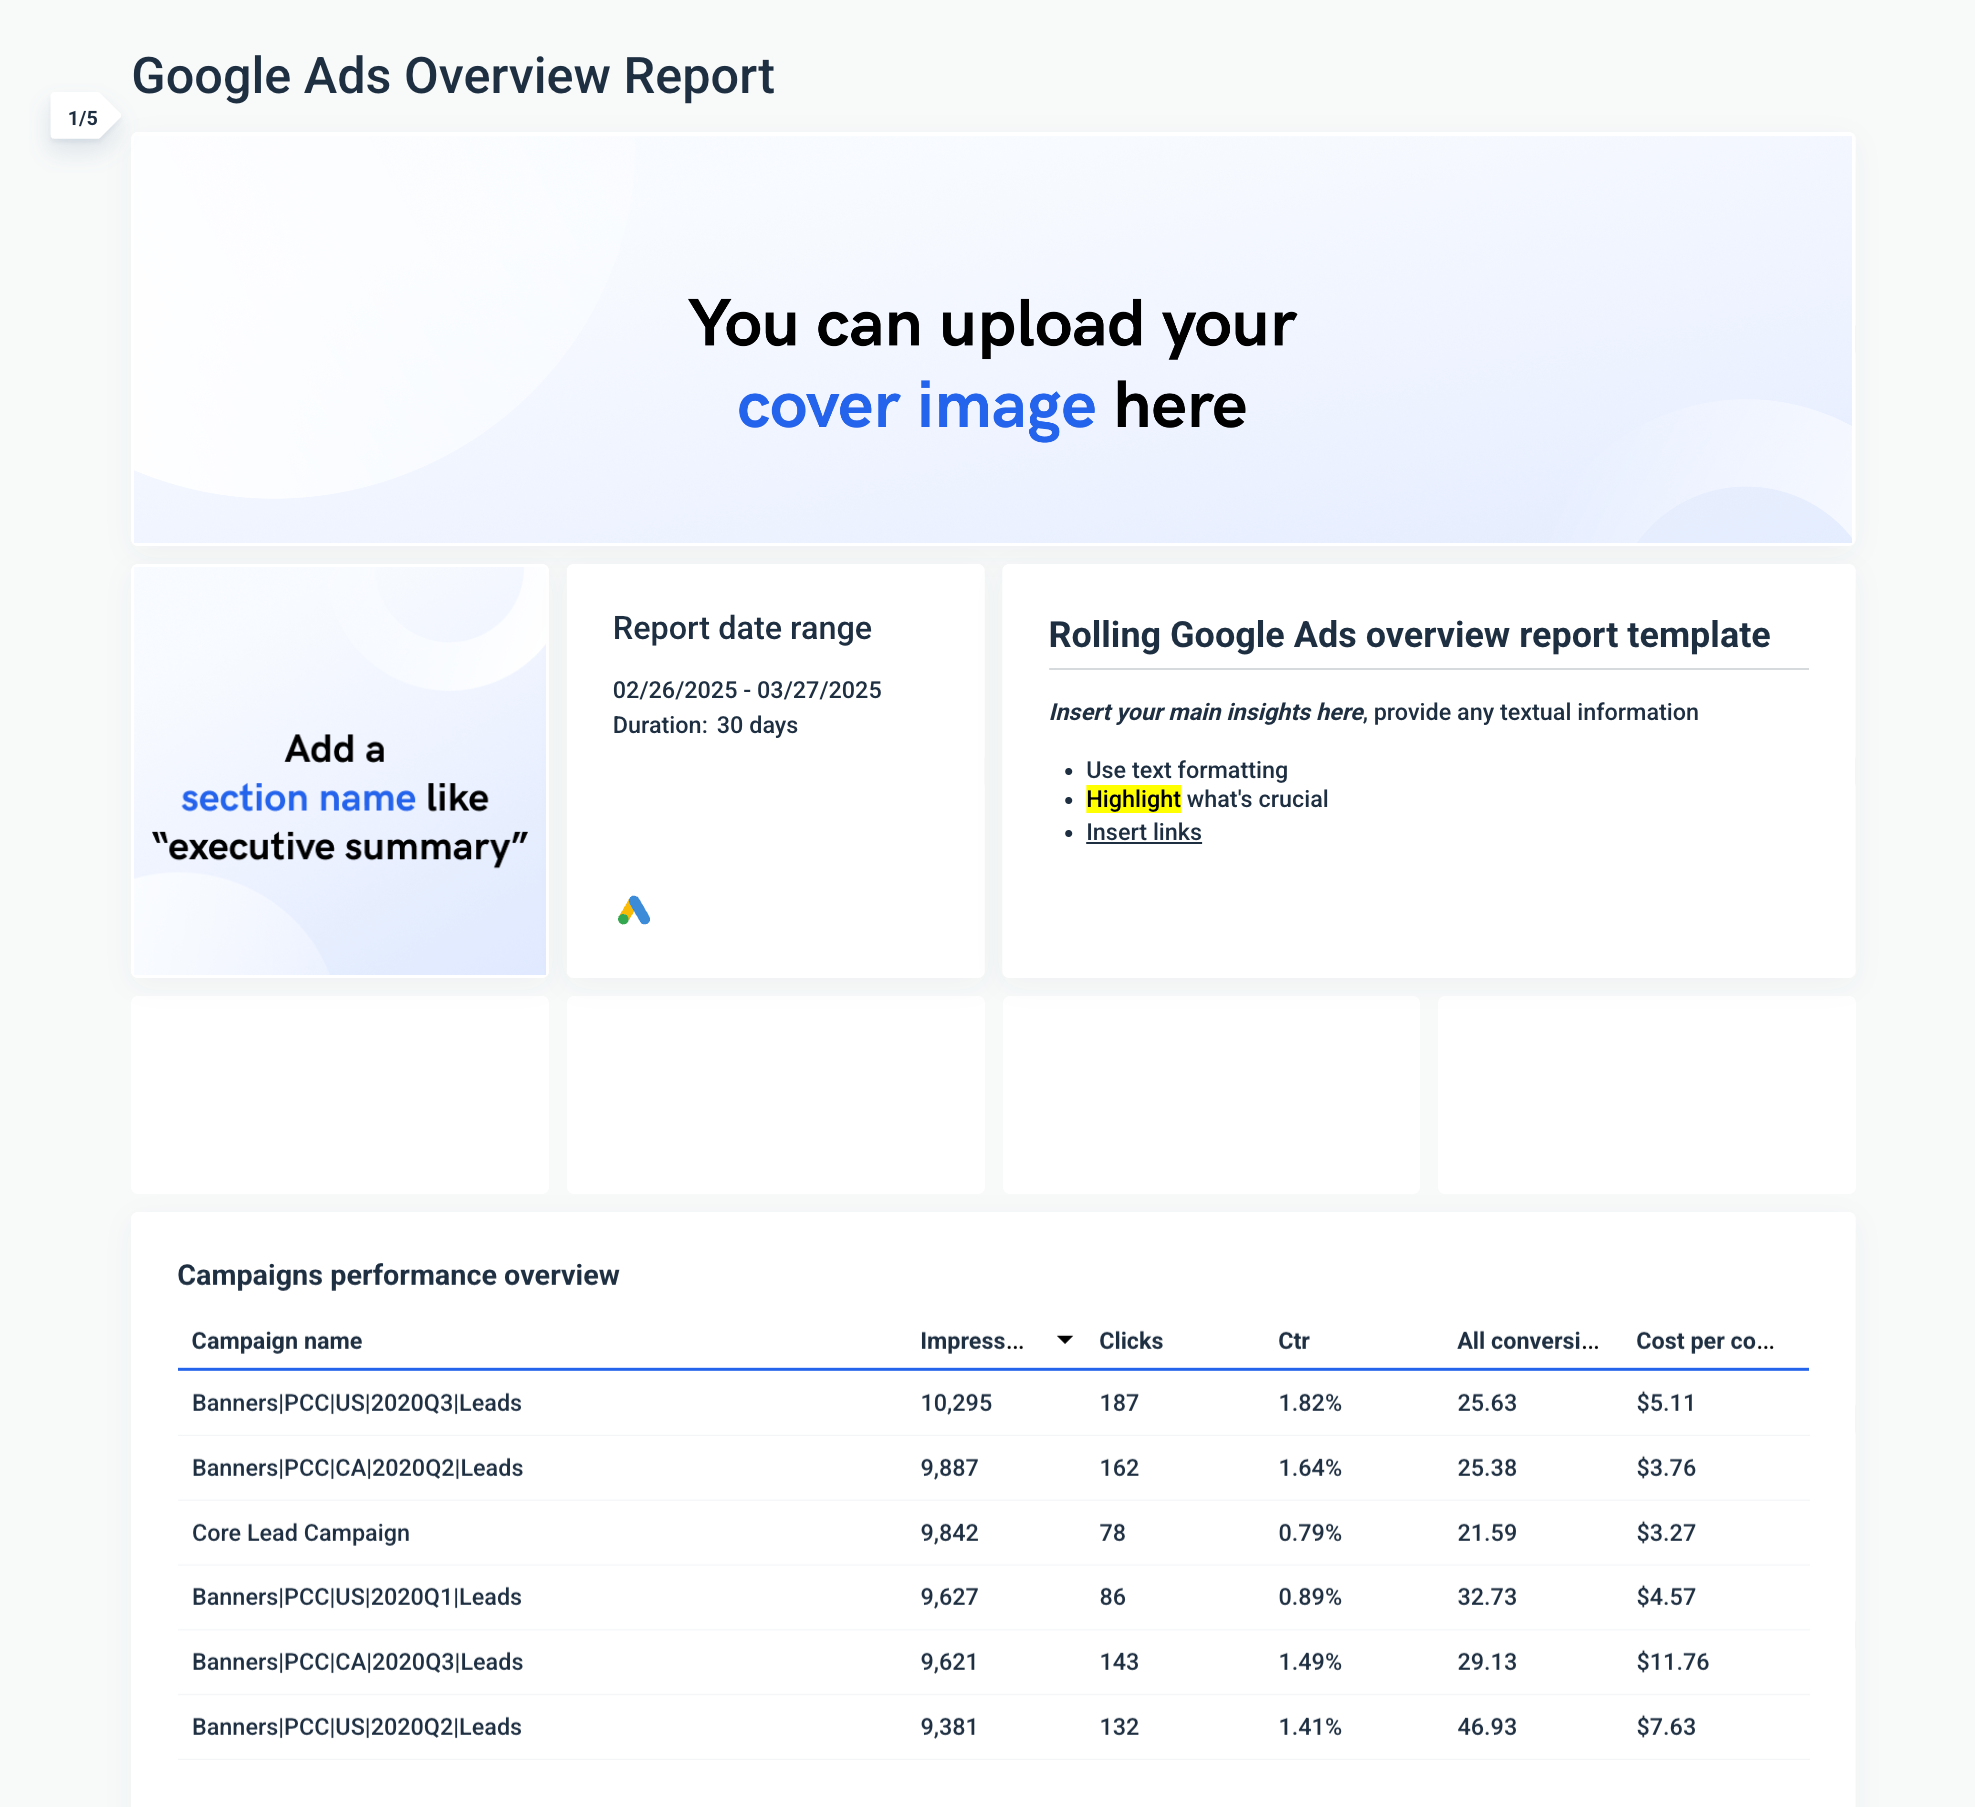
What makes this a great Google Ads report:
- Customizable header image: I personally love how the report lets you add your own cover image to make it more personalized on a client-to-client basis.

- Text widgets: With the text widgets, I can easily summarize campaign performance (and include more specific details about different parts). Plus, the AI Report Summaries feature makes it extremely easy to fill.
- Conclusions and actions: I find this section great for summarizing Google Ads performance and describing the next steps. I can do this through bullet points, which are easy for clients to understand.
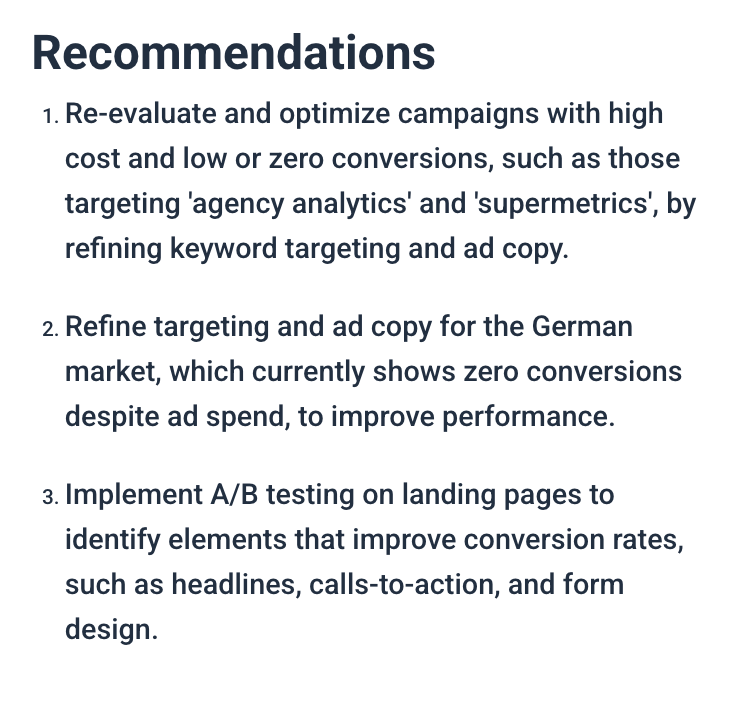
Example 3: Google Ads Reports for Clients
Here's a more comprehensive example for Google Ads:
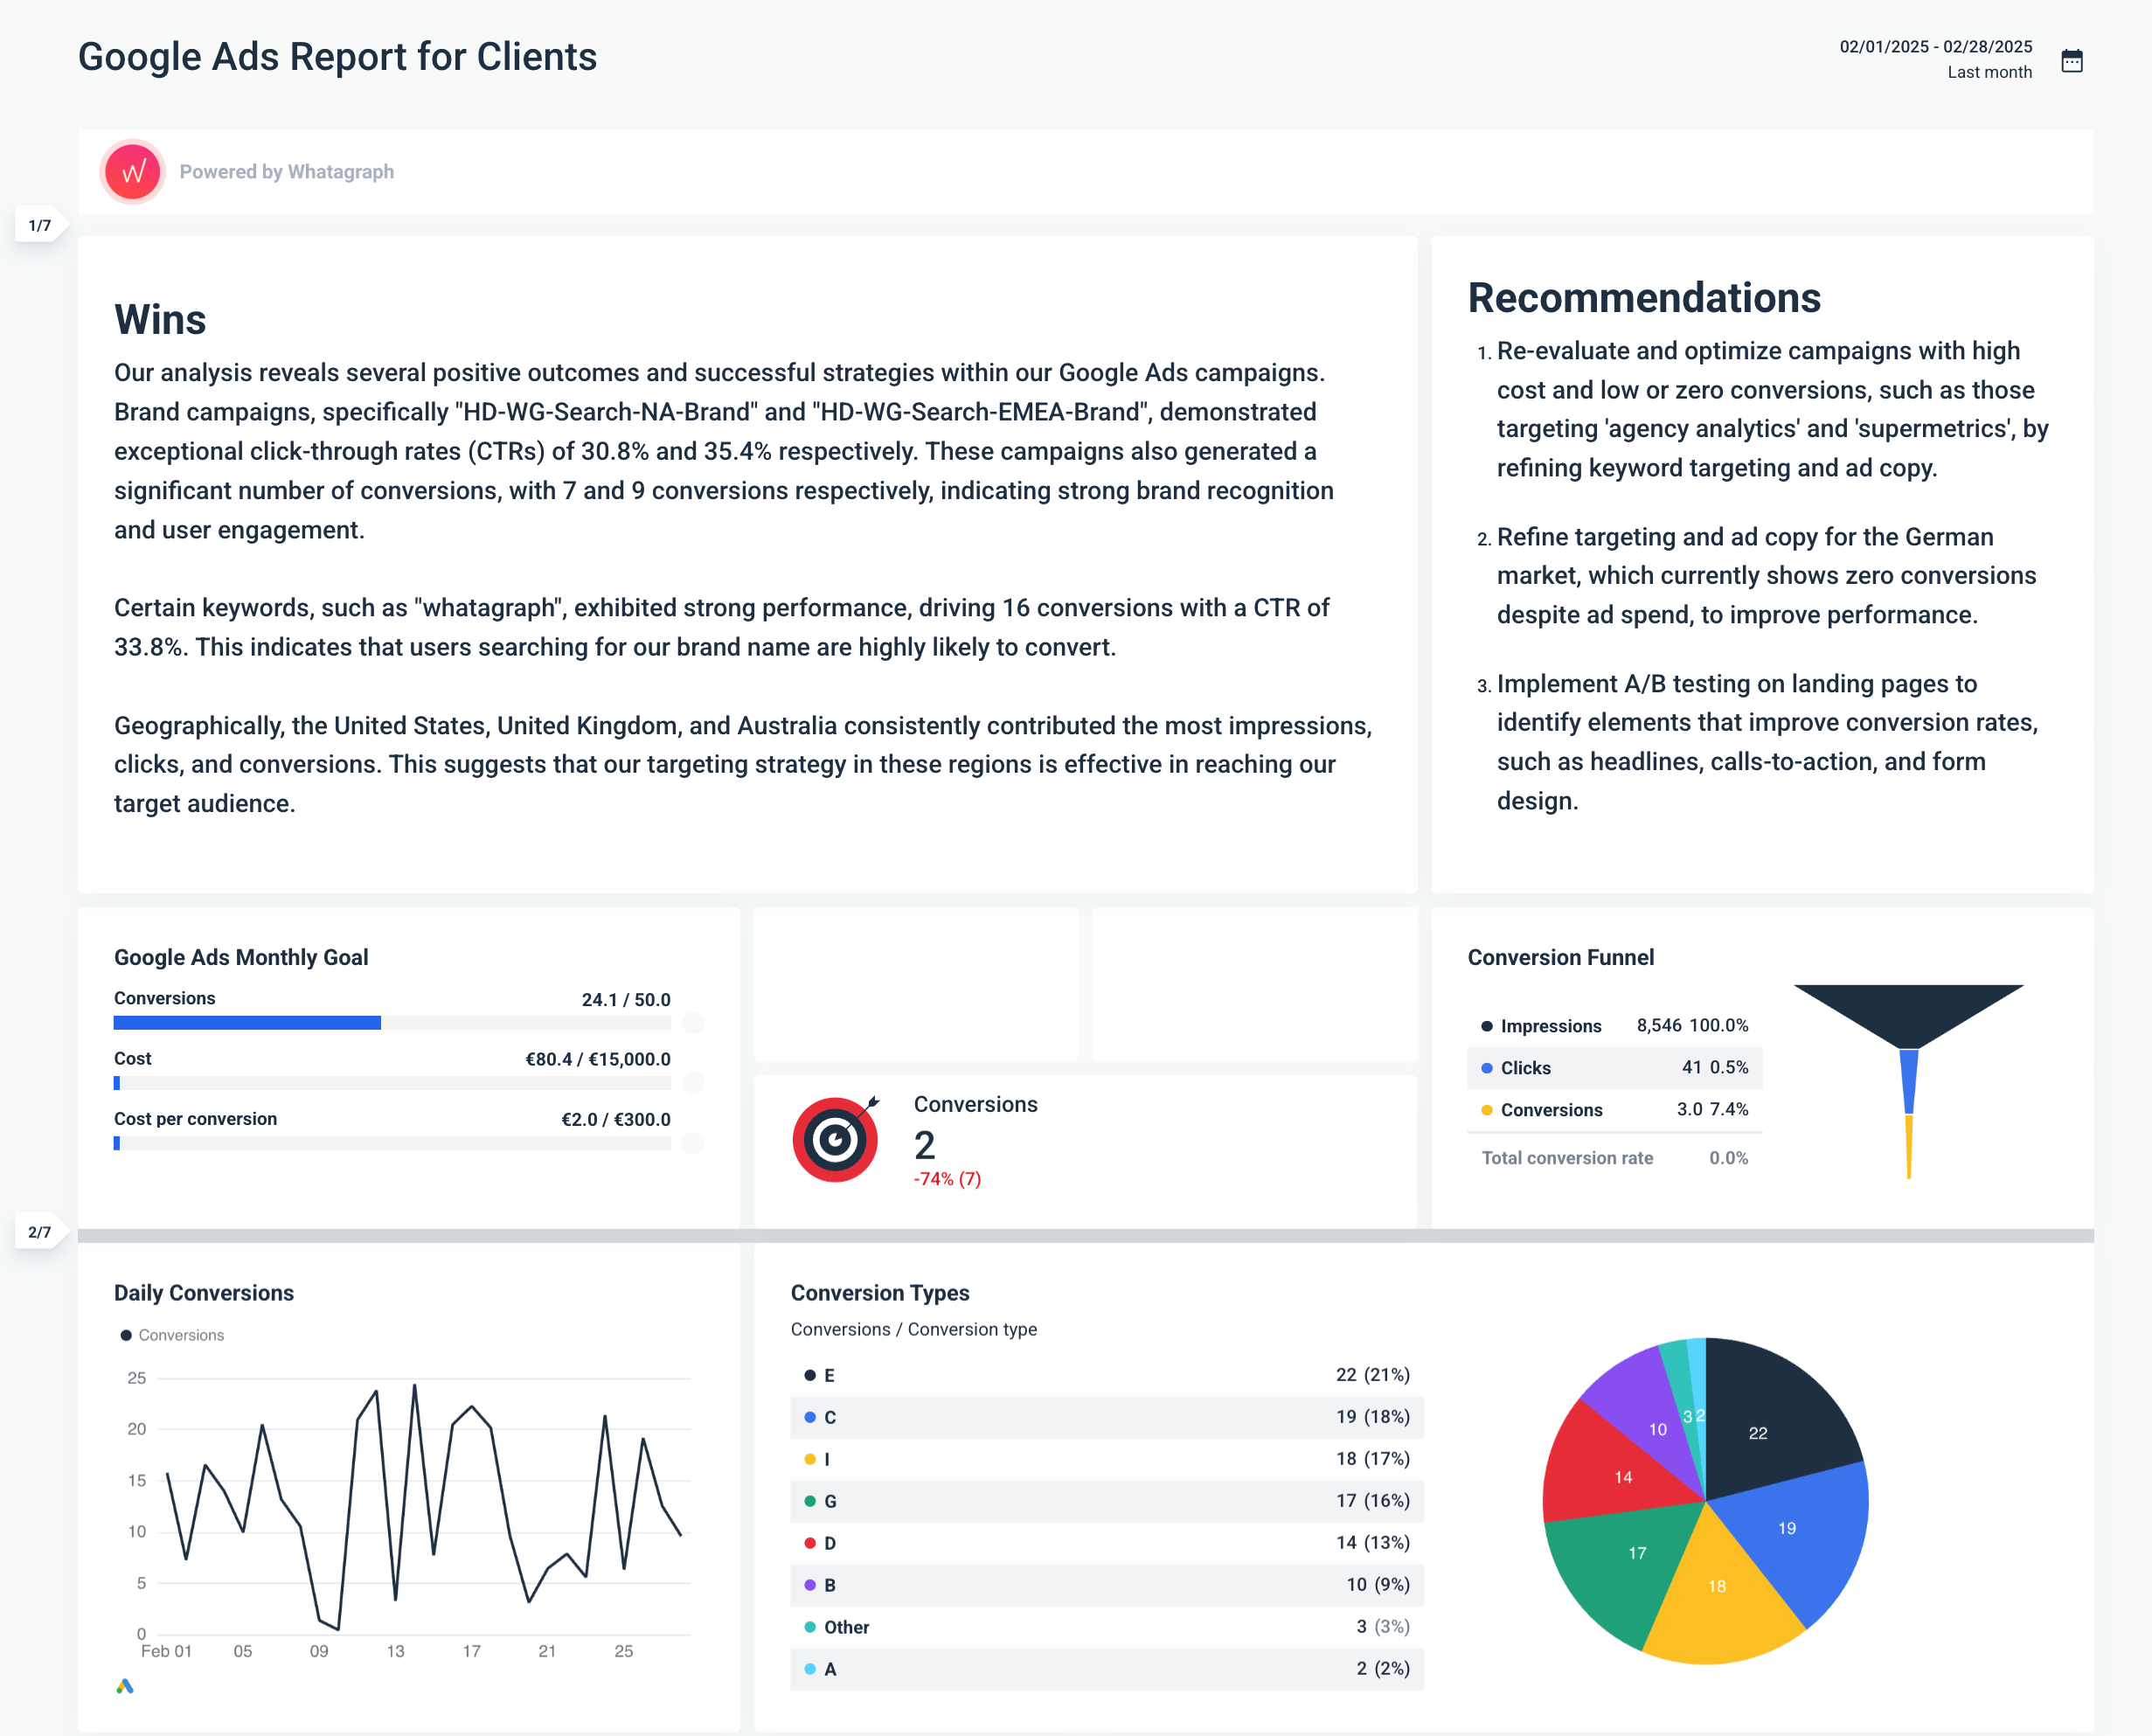
What makes this a great Google Ads report:
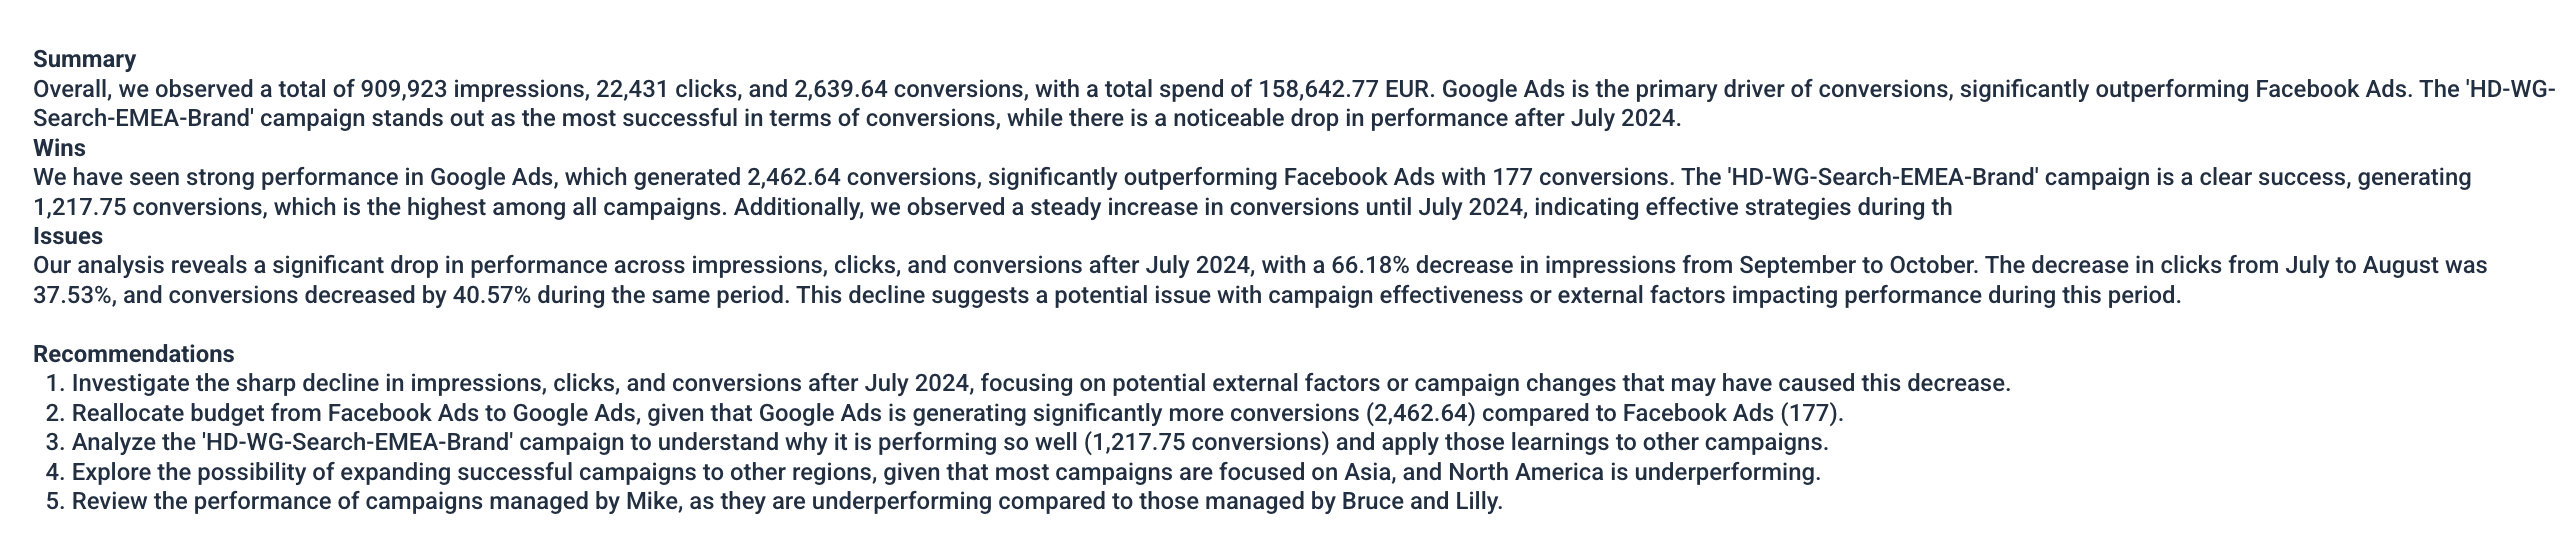
- Wins and recommendations right at the top: This section cuts the fluff and goes right to the point, which I really like. Clients can quickly see what works and what needs more work.
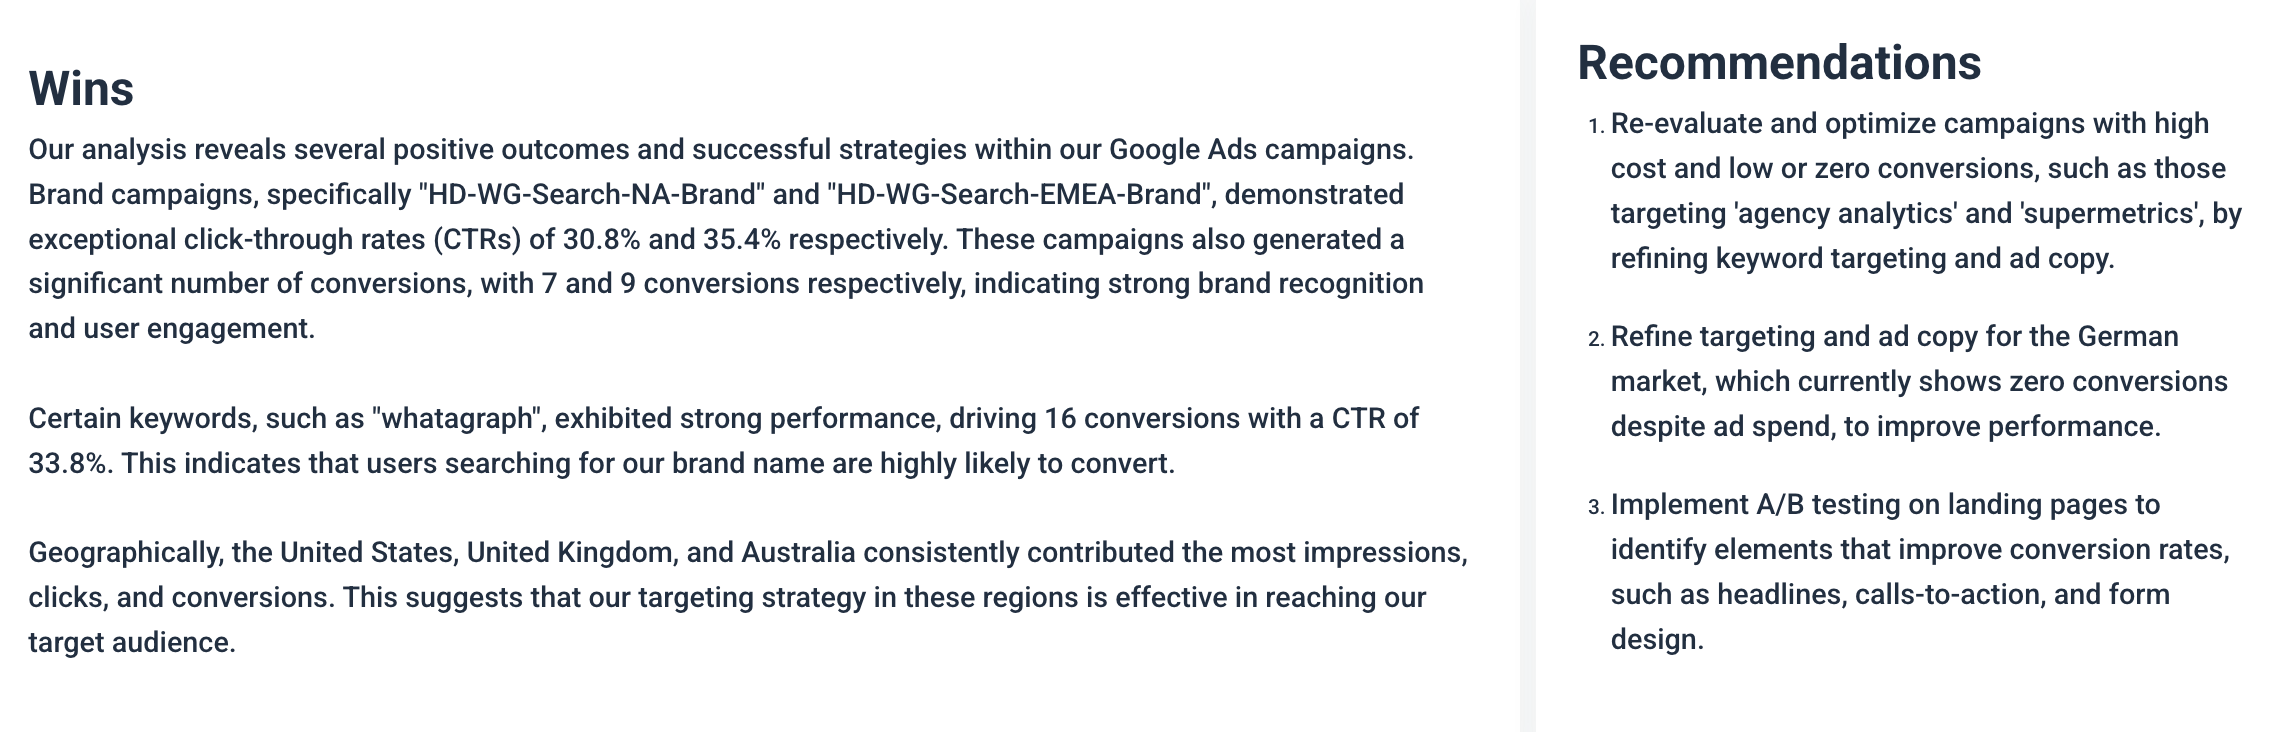
- Granular performance details in a breakdown table: The breakdown table focuses on key metrics like CTR, CPC, and conversion. It filters out unnecessary metrics, which I know clients appreciate.
Common Reporting Mistakes to Avoid According to Google Ads Experts
Another thing I asked agency experts about is common mistakes to avoid when creating Google Adwords reports. This is what they said:
Mistake 1: Neglecting Cross-Platform Integrations
Google Ads reporting is incredibly useful, but you know what's even better?
Cross-platform reporting—especially when the data sources are connected to one marketing reporting platform.
Anton Kovalchuk, the founder of QliqQliq, comments on their situation: " Our Google Ads integration with analytics from other platforms mostly relies on manual integration.”
He wishes their cross-platform reporting was automated, as "it would provide a clearer real-time picture of how different marketing efforts are bringing conversions."
To prevent this issue, tools like Whatagraph help you connect, organize, and visualize data from multiple sources into easily digestible marketing reports.
Instead of being the middleman of data, Whatagraph integrates directly with 55+ data sources, including with marketing, social media, and ecommerce platforms.
The native integrations mean:
✅ Reliable real-time data, no connectors breaking
✅ No more manual data transfers; data syncs every hour
✅ Faster report creation, thanks to the reliable data
Mistake 2: Ignoring the red flags
Not only do clients want to know what’s working—but also what isn’t.
As Stephen Samuel, the founder of NexFusion, previously suggested, include a section on your Google Ads report suggesting what needs improvement.
Anton Kovalchuk points out that when creating Google Ads client reports, the red flags to look for include:
- Very high impression share loss due to budget
- Unforeseen jumps in CPC without the same jumps in conversions
- Decreasing engagement rates on high-intent keywords.
“These point to deeper issues with the campaign,” he continues.
Sharing “red flags” in your Google Adwords campaign reports has one benefit: Focusing on more than just the bright spots will earn your client's trust.
Final Checklist For Creating a Google Ads Report
I truly hope you found the above tips helpful. As a final checklist for creating Google Ads reports, you can refer to my checklist:
✅ Avoid information overload: Keep your reports simple. Start with a quick summary of what’s working, what doesn’t, and what needs improvement.
✅ Focus on metrics that matter: Include key conversion metrics, like ROAS, CTR, CPC, etc., so clients quickly see the ROI they’re receiving.
✅ Structure your Google Ads report correctly: Base your Google Ads custom reports on the six different sections which I shared previously.
✅ Don’t overlook automation and AI: Instead of spending hours on manual reporting, use marketing reporting tools, like Whatagraph, which offer AI for summarizing campaign performance.
✅ Don’t neglect cross-platform integrations: Use cross-platform integrations to turn data from Google Ads and other platforms into “all-in-one” custom reports.
✅ Don’t ignore the red flags: Don’t neglect explaining to clients what is not working and needs improvements. This helps to build trust.
Published on Mar 29 2025
WRITTEN BY
Elmeri PalokangasElmeri is a content strategist and writer helping SaaS firms scale up with long and short-form content. He has written dozens of SEO- and conversion-optimized blog articles for SaaS brands like Atera, Cognism, Scribe, Drip, QuickMail, Time Doctor, and TechnologyAdvice. When he's not working, he's off exploring Switzerland's stunning mountains.