Common Data Quality Metrics
Making the correct business decisions highly depends on the quality of your data. And, it impacts your ability to solve problems or reach goals. Sounds serious, huh? It is – therefore, you must measure the quality of data using the correct metrics.

Apr 17 2020●3 min read


Why Is Data Quality Important?
Your data quality has a large impact on your strategic decision making. If you have low-quality data, you’re doomed to make poor decisions. Meanwhile, high-quality data helps you make the right decisions and ensure the success of your business.
Fun fact: companies that focus on improving data quality typically have a 15-20% increase in revenue. At this point, you’re probably sold and thinking: so, how can I tell whether my data quality is good enough? And, how should I measure it?
Measuring data quality is all about understanding what data quality attributes are and choosing the correct data quality metrics.
Characteristics of Data Quality
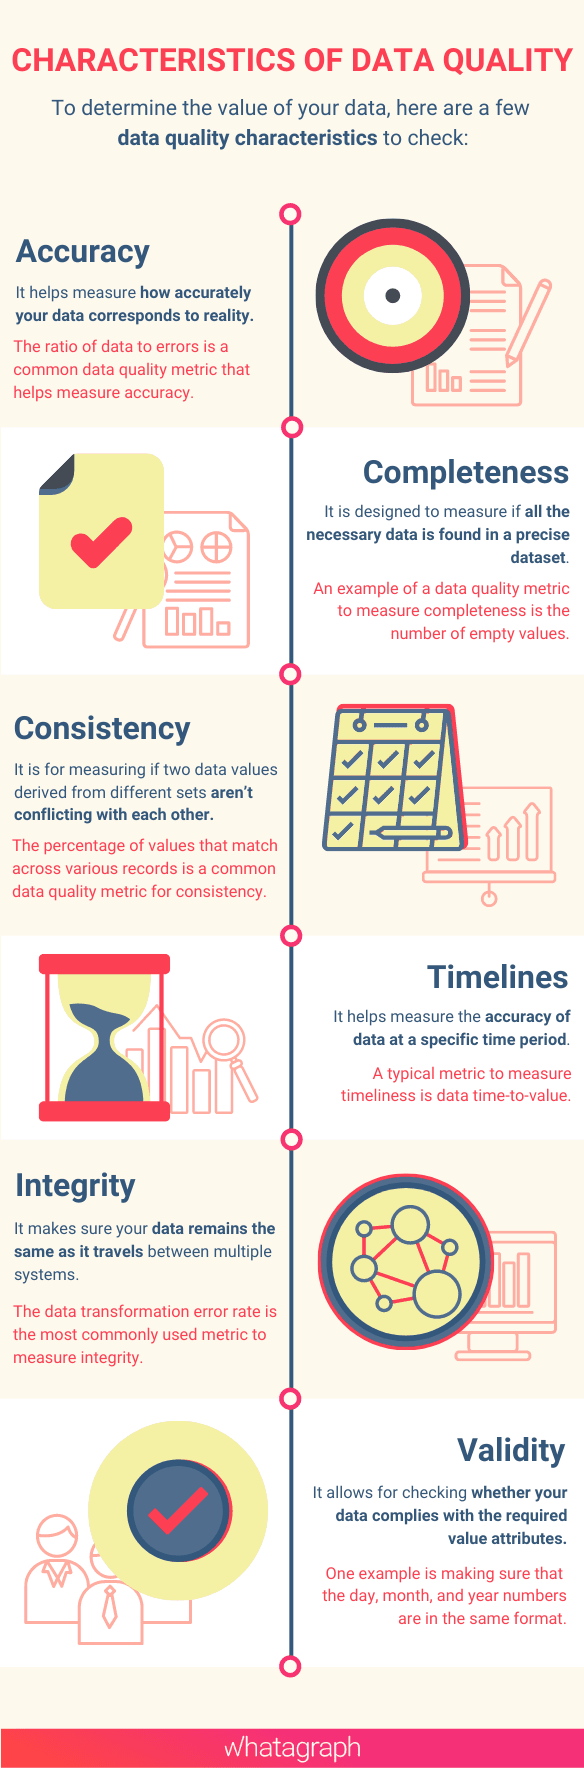
To determine the value of your data, here are a few data quality characteristics to check:
- Accuracy. It helps to measure how accurately your data corresponds to reality. The accuracy metric is highly important if you’re working in finance. In this case, there’s simply no room for interpretation: the numbers are either accurate or not.
Also, accuracy is extremely important for large organizations with high penalties for failure. The ratio of data to errors is a common data quality metric that helps measure accuracy. - Completeness is designed to measure if all the necessary data is found in a precise dataset. And, it indicates whether there’s enough information to come up with conclusions. An example of a data quality metric to measure completeness is the number of empty values.
- Consistency is for measuring if two data values derived by different sets aren’t conflicting with each other. The percent of values that match across various records is a common data quality metric for consistency.
- Timelines help to measure the accuracy of data at a specific period. This attribute of data quality measures the time between you expecting the data and the moment you can use it. A typical metric to measure timeliness is data time-to-value.
- Integrity helps to make sure your data remains the same as it travels between multiple systems: storing data in separate systems may negatively affect integrity. The goal is to make sure there are no accidents and data errors. The data transformation error rate is the most commonly used metric to measure integrity.
- Validity allows checking whether your data complies with the required value attributes. For instance, making sure the day, month, and year numbers are in the same format.
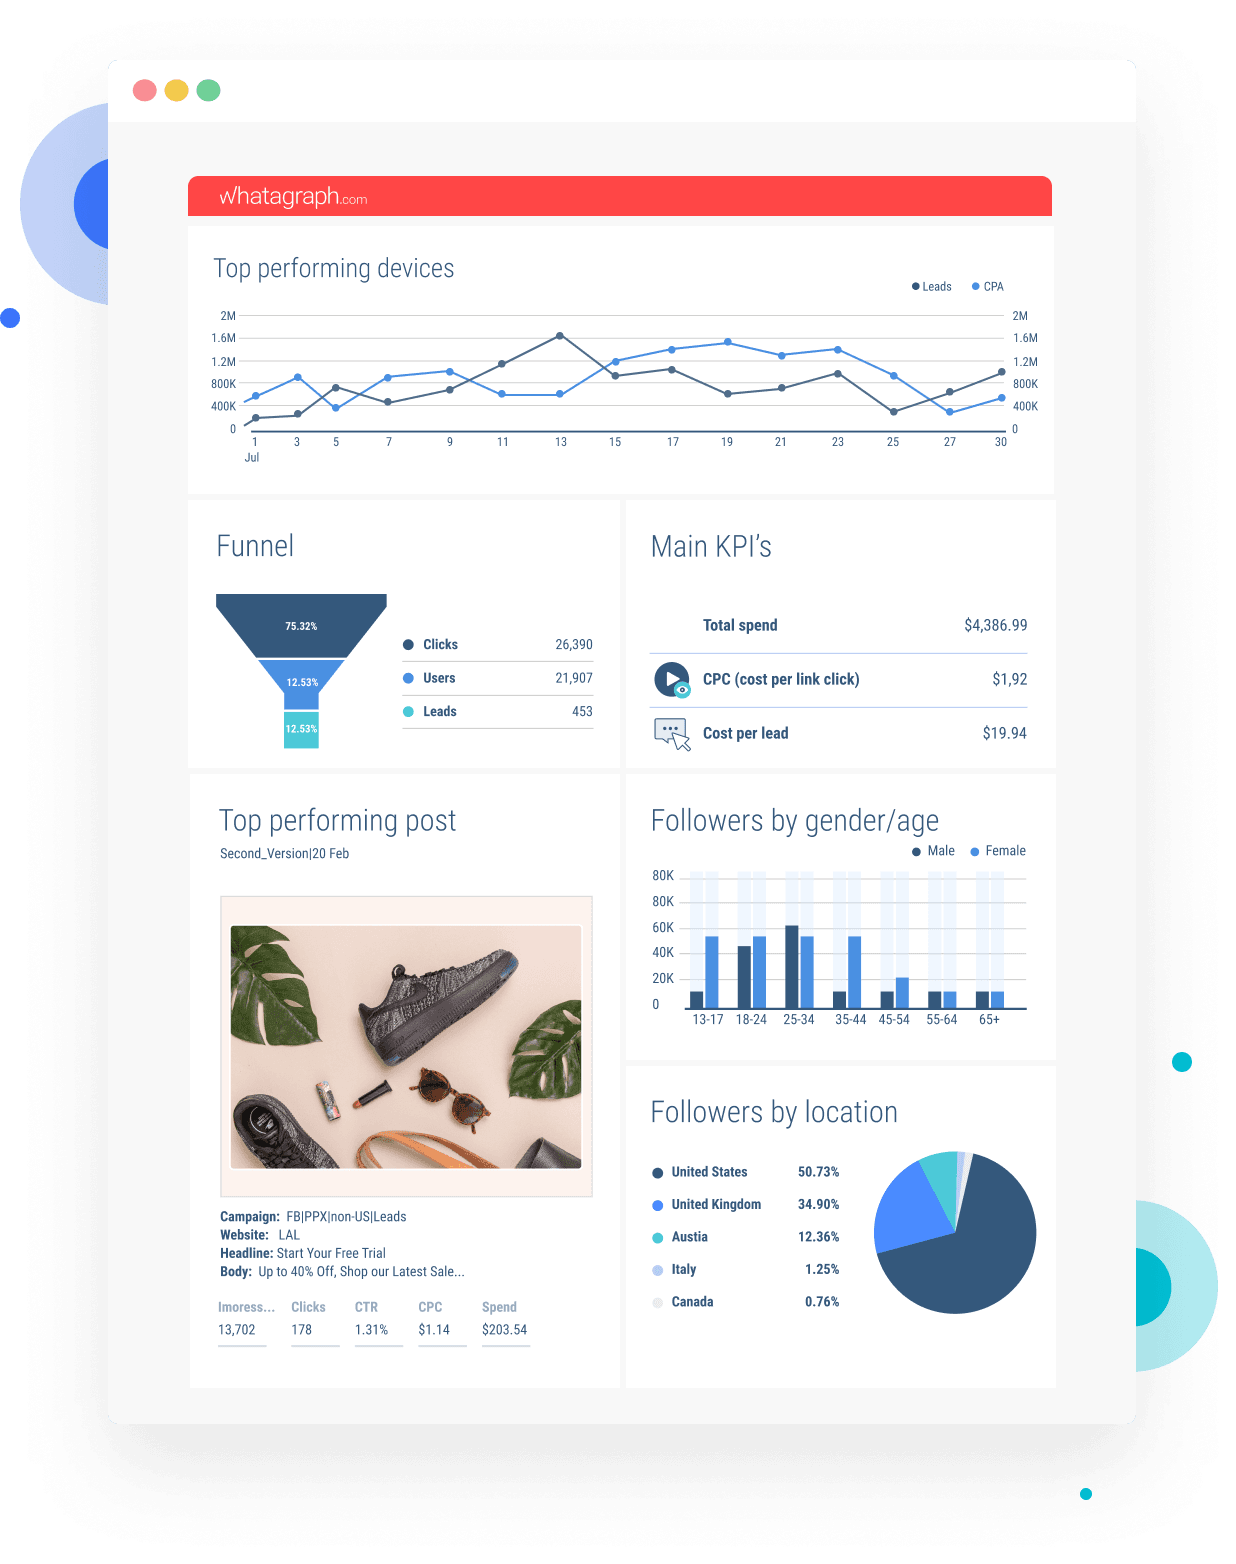
Quite a lot of metrics to keep track of, isn’t it? Luckily, you can use Whatagraph, a data reporting tool, to keep track of how multiple marketing channels are performing. Here’s how a report created with Whatagraph looks like:
Common Data Quality Metrics to Measure
Here are the top metrics companies use to measure the quality of their data:
- Ratios of data to errors
This metric allows viewing how the number of errors in a single data set corresponds to the size of the data set. Common data errors include redundant, incomplete, or missing entries.
If you have fewer errors while the size of your data set grows or stays the same, it’s likely the quality of your data is growing.
- Data transformation error rates
Data transformation is the process of converting data from one format to another. Issues that arise during the process suggest there are problems with the quality of your data.
Knowing the exact number of failed data transformations helps you learn more about your overall data quality. Also, keep in mind that if the transformation process is taking too long, it’s likely that your data is flawed.
- Number of empty values
This metric shows the number of empty fields in your data set or displays data recorded in the wrong field. Once you’ve got the number, you should track how it changes in time.
- Email bounce rates
Emails bouncing back to you suggest the low quality of your data. Typically, emails get sent to wrong addresses and are bounced back due to missing or outdated information.
- Amounts of dark data
Dark data is data acquired through various computer network operations but can’t be used in any manner to derive insights or for decision making. Having a large amount of it suggests the overall quality of your data is low.
- Data storage costs
A common sign of data quality issues is when the amount of data you use remains the same, while the cost of your data storage increases, or vice versa.
- Data time-to-value
Finally, the amount of time spent deriving results from a data set can help you with identifying your data quality.
You can measure the quality of your data by determining how much time your team spends deriving results from an existing data set. Although many factors impact this data quality metric, data quality issues often slow down the process of generating important information.
Published on Apr 17 2020
WRITTEN BY
Indrė Jankutė-CarmaciuIndrė is a copywriter at Whatagraph with extensive experience in search engine optimization and public relations. She holds a degree in International Relations, while her professional background includes different marketing and advertising niches. She manages to merge marketing strategy and public speaking while educating readers on how to automate their businesses.