How to Analyze Data: 7 Strategic Steps to Master
Data you capture from different sources can give you valuable feedback on the efficiency of your business processes. It can also bring your team to alignment with future trends.

Apr 01 2020●6 min read


However, data only produces meaningful and actionable results if you analyze it properly. Otherwise, you only have numbers and figures with no basis.
However, there's no rule of thumb for analyzing data. You should base your data analysis on your requirements and the form of data. This guide will show you how to analyze data in several steps and where to apply different data analysis methods.
What is data analysis?
Data analysis is the process of fine-tuning, converting, and modeling data to generate meaningful and actionable insights that lead to intelligent business decisions. Data analysis aims to extract vital information from data and implement decisions by leveraging the data analyzed.
Business data can come in different forms, such as in-house or outside sources, surveys, interviews, questionnaires, focus groups, etc.
What are the benefits of analyzing data?
Analyzing your data helps you interpret KPIs and metrics vital to your project or business. It can point to areas of improvement, product expansion, or process innovations. Summarized, those benefits boil down to:
- Understanding user behavior: Data analysis lets you stay on the same page with your customers. Learn and predict user behavior based on interactions with your products, services, or content. Follow up on the feedback by making changes where they are justified.
- Better customer experience: By understanding user behavior, you can deliver a better experience to your customers. This includes a more streamlined customer journey and more personalized customer support.
- Improved decision-making: Data analytics extends your field of vision as a business owner and lets you make better-informed decisions based on your data. By using interactive data visualization, you can visualize different aspects of your data and identify what’s working and what’s not, along with opportunities for improvement.
What are the different types of data analysis?
There are five different forms of data analysis based on technology and business:
- Text analysis
- Statistical analysis
- Diagnostic analysis
- Predictive analysis
- Prescriptive analysis
Text analysis
Another name for text analysis is called data mining. You can use this method to discover patterns in large data sets using data mining tools and databases. Text analysis can help you transform raw data into business data.
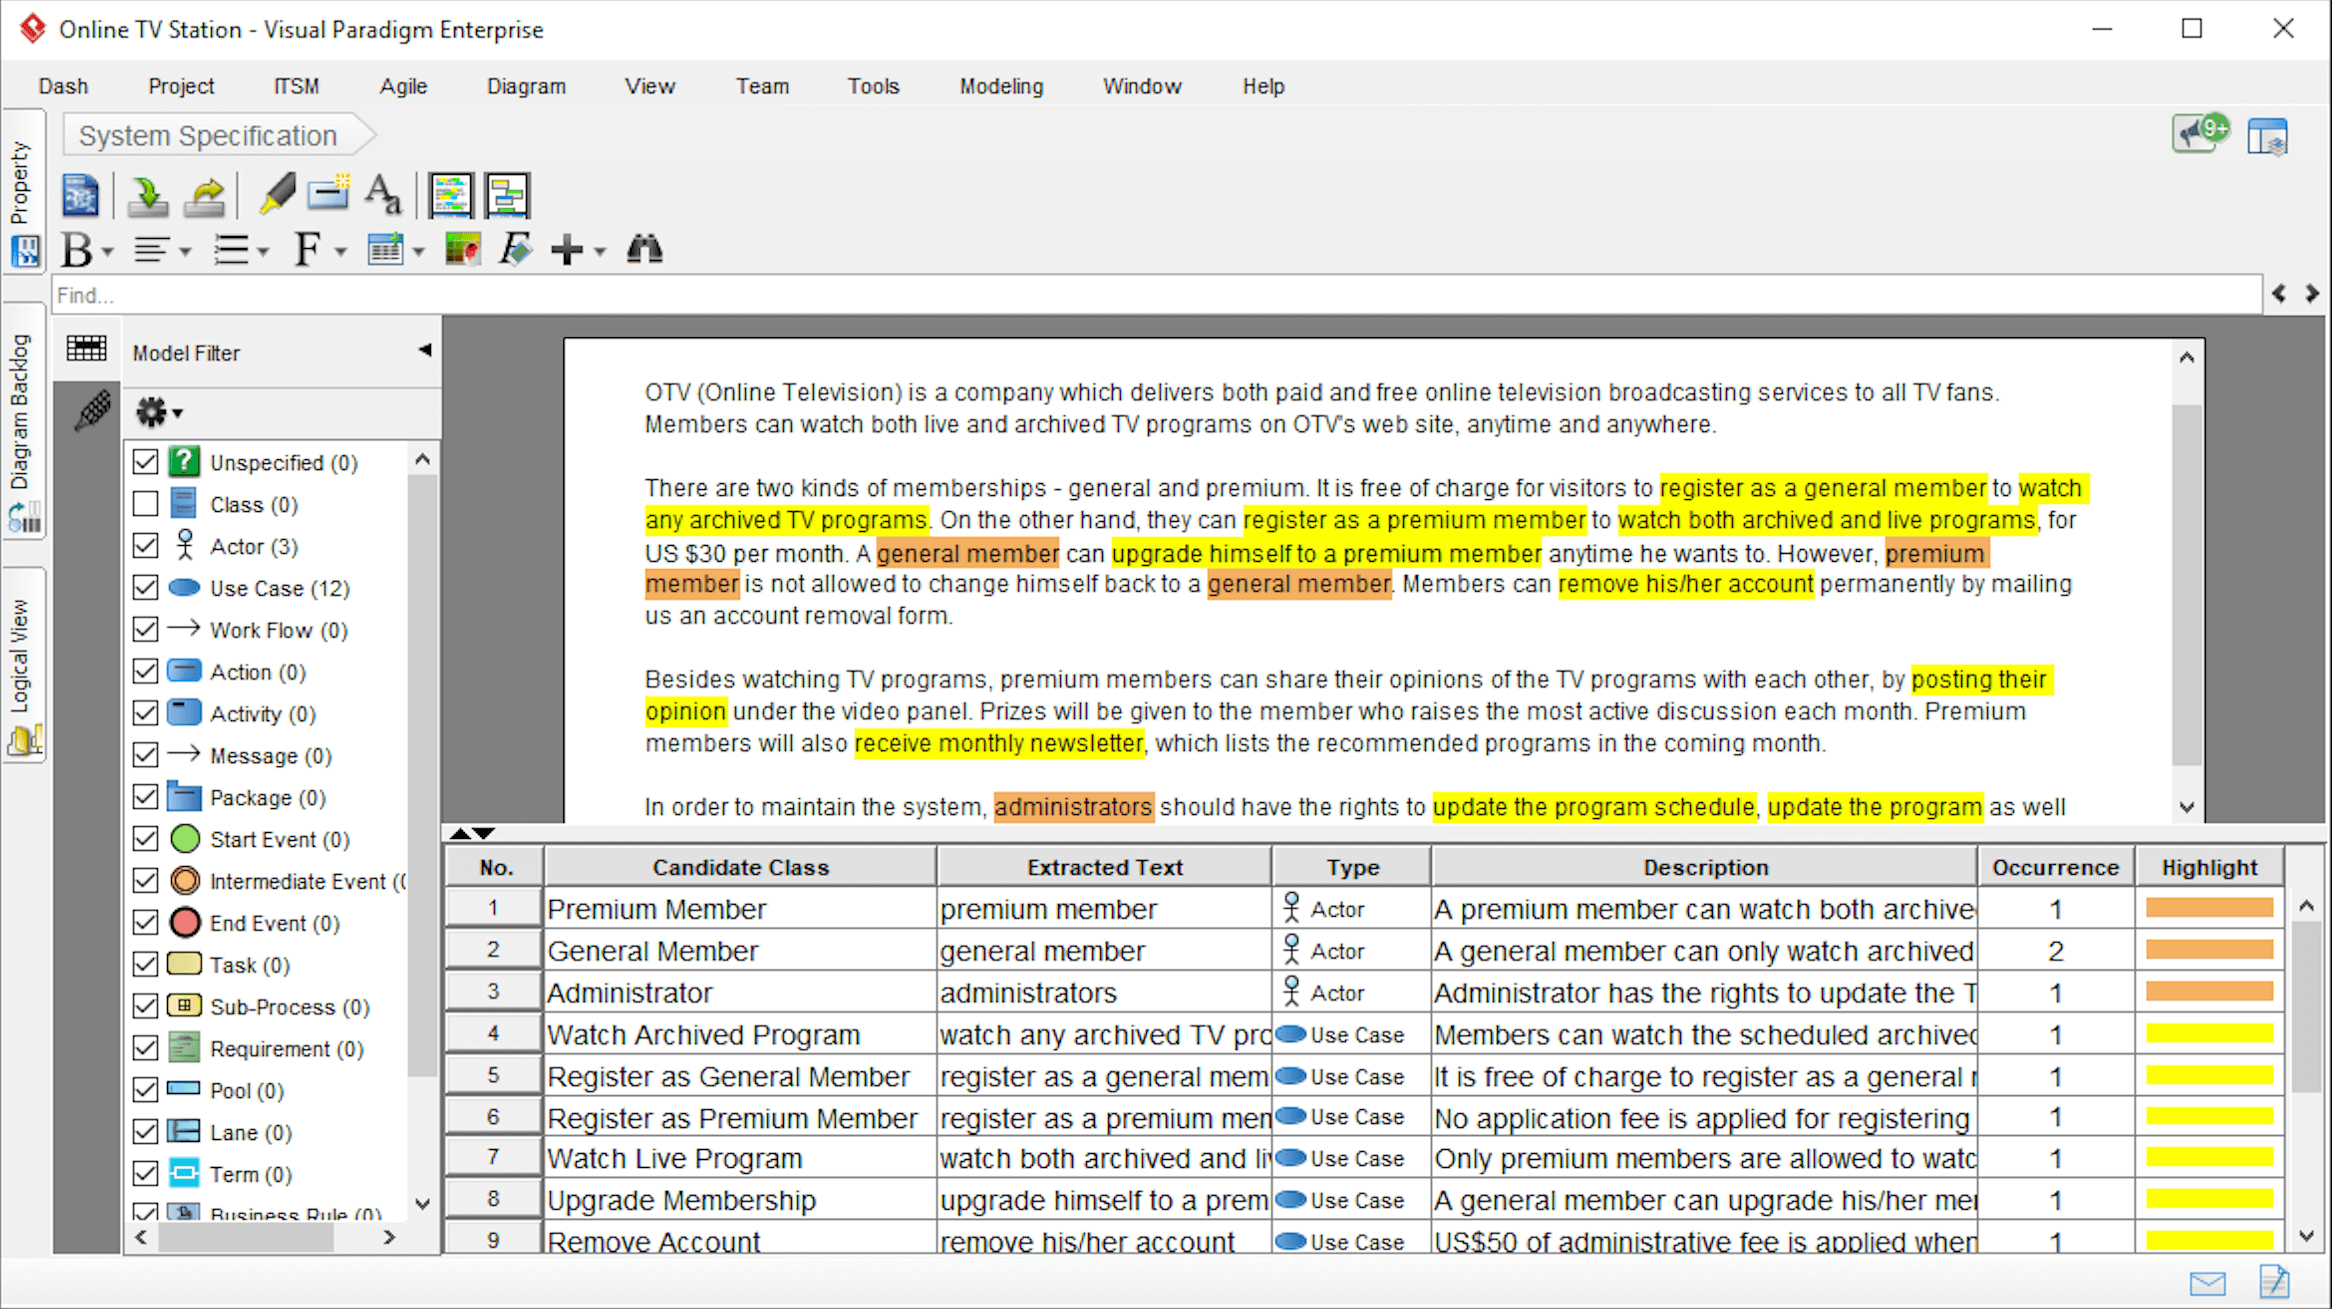
You can find several business intelligence tools available in the market that you can use to make informed decisions. Most importantly, this type of analysis provides a means of generating and examining data and discovering patterns before interpreting it.
Statistical analysis
Statistical analysis relies on statistical techniques to inspect and summarize data, make predictions, and draw conclusions. This form of analysis incorporates data collection, analysis, interpretation, presentation, and data modeling to help businesses make data-driven decisions. It analyzes data samples or a set of data from your focus groups.
For example, you can use statistical analysis to understand which product or service is most popular and why or predict future sales and demand.
There are two forms of statistical analysis — descriptive and inferential analysis.
- Descriptive analysis
Descriptive analysis helps identify what has already happened, and it’s often the first step you must take before going into deeper explorations.
For example, you may use it to find how many users signed up for a trial over a particular period or measure sales figures over the past year. Although you may not derive actionable conclusions from these insights, they often point to where to look next.
- Inferential analysis
Inferential analysis hypothesizes what happened by comparing statistics from groups within the entire sample, e.g., population, customer base, leads in the pipeline, etc. This form of statistical analysis is used in market research to compare two variables and try to reach a conclusion.
Diagnostic analysis
Diagnostic analysis seeks to answer, 'Why did it occur?' by discovering the cause from insights in statistical analysis. Diagnostic analysis is vital in identifying the behavioral patterns of big data in applications such as machine learning.
This data analysis method often resorts to AI and machine learning to help teams automatically analyze large sets of unstructured data. If a new issue surfaces in your business operation, you can delve into this analysis to discover related patterns. That way, you can utilize the same prescriptions for that new issue.
Predictive analysis
This type of analysis asks 'What's likely to occur' based on previous data. For example, we spent $500 to generate 1,000 likes on Facebook last month. If our ad spend increased to $1,000, we should generate 2,000 likes this month. However, it's more complicated; we must also factor in other events, such as changes or updates to Facebook Advertising or other factors and data points.
Therefore, we can assert that predictive analysis forecasts future outcomes based on previous or current data. The forecast accuracy relies on how detailed the information you have sourced and how much you researched it. You don’t have to be a data analyst or some other type of data science expert to do this job. However, having some data visualization tools helps, especially if you have many data sources.
Prescriptive analysis
This form of analysis leverages insight from all data to decide on an action plan or resolve an issue. Many data-driven enterprises use prescriptive analysis as descriptive and predictive are not enough. Prescriptive analysis uses current problems and events to analyze data and reach decisions. Prescriptive analysis can yield powerful sets of visual data that can improve several critical areas such as marketing, sales, customer experience, HR, fulfillment, finance, etc.
How to analyze data in 7 steps
Step 1: Ask the right questions
In your data analysis, you should start with the appropriate survey questions that are measurable, clear, and concise. Tailor those questions so they can annul or disannul likely solutions to the specific issues or opportunities.
For instance, a PPC agency is experiencing rising costs and finding it challenging to tender competitive contract proposals. One possible question to resolve this issue is: Can the agency downsize without compromising quality?
Step 2: Establish clear measurement priorities
You can break this step into two sub-categories:
- Conclude what you intend to measure (e.g., customer satisfaction from social media)
- Decide the strategy to adopt for measuring it.
Let's examine those two sub-categories.
Conclude on what you intend to measure
By the analogy of that PPC agency, you should examine the types of data required to answer important questions. In this situation, you'd need to understand the number of employees and freelancers working with you. Their cost, as well as the percentage of duration they spend in the business operations — all of this is important for choosing the suitable data analysis methods.
This question alone will generate several sub-questions, such as
- Are we maximizing our workforce?
- If not, what processes can we improve to become more agile?
Lastly, when you are ready to measure, ensure you factor in any reasonable objections your team might have. For instance:
- How will the company cope with increased demand if the agency reduces staff?
Decide the strategy to adopt in measuring it
It is important to consider how you will measure your data before the data collection phase. This is because your measuring procedure enhances or jeopardizes your analysis later — some salient questions:
- What's the time frame — annual or quarterly expenses?
- What's the unit of measurement — USD or Euro?
- What parameters should be incorporated? Annual or yearly salary, coupled with the cost of employee benefits?
Step 3: Collect data
Having defined the question and established your measurement priorities, you will need to keep these vital points in mind:
Before collecting data, consider the data from existing databases.
- Source this data first.
- Decide on a file storing and labeling framework ahead of time to enable all members to collaborate. That way, you can save time and prevent double-sourcing.
- If you need to adopt an interview or observations, design a template for the interview beforehand to guarantee consistency and save time.
- Organize the data you've sourced along with sourced dates and include any source notes as you progress. This action will validate your findings as you go.
The best practice is to collect both quantitative and qualitative data:
- Quantitative data: Structured data that can be measured (quantified), such as tags, metrics, and other numerical data.
- Qualitative data: Unstructured data must be structured before mining, such as texts, images, speech, videos, etc.
Quantitative data is usually already stored in databases or a data warehouse, while for quality data, you need to analyze:
- Social media,
- Customer emails,
- Chat conversations,
- Online reviews,
- Open-ended survey responses.
The success of your data analysis depends on the quality of your data. For this reason, you need to prepare your data and remove noise and unnecessary elements, which brings us to the next step:
Step 4: Clean data
When you have collected your data, there’s one more step before you can analyze it — to clean it and make sure you have high-quality data to work with.
Data cleaning includes:
- Removing irrelevant values: You don’t need data that doesn’t fit the context of your analysis, including outliers.
- Removing duplicate values: Get rid of the duplicates when you see them. They commonly occur when you combine data from multiple sources or repeat a value by mistake.
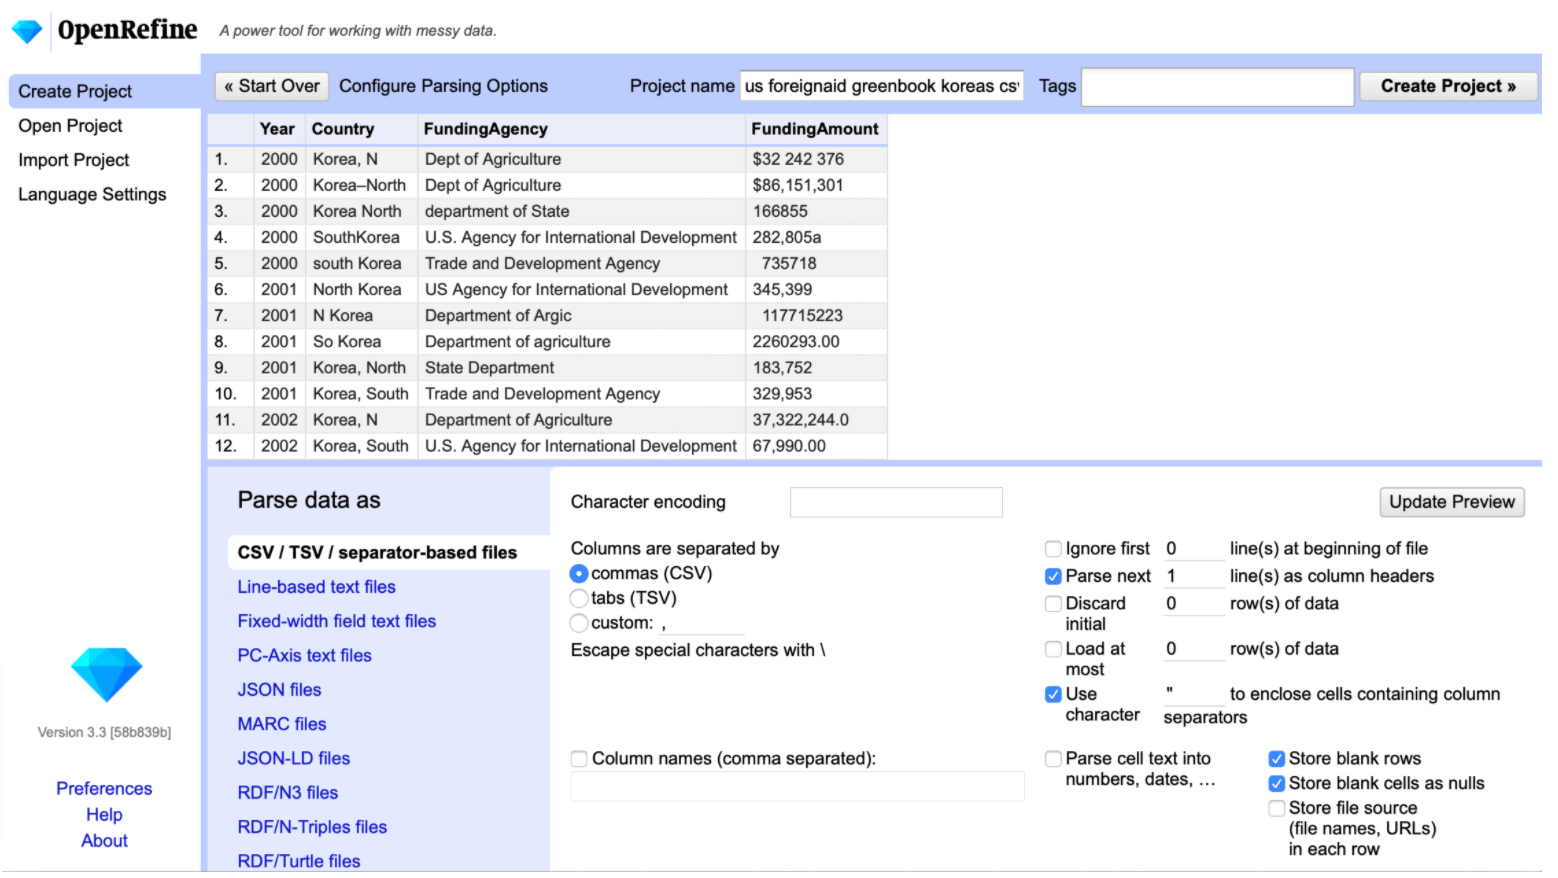
- Correcting errors: Incorrect capitalization, different naming conventions, and typos can cause different models to treat your values differently. Map these values and convert them into the correct spelling.
- Converting data types: Make sure your data types are uniform across a dataset, such as ensuring that numerics are entered as numerics, not strings.
- Fill in gaps and missing values: Use median or linear regression to calculate the missing value or copy the data from a similar dataset. Flag missing values using “0” for numeric or N/A for categorical values.
Although data cleaning can take more than half of your data analysis time, it helps you avoid taking wrong data points into account and compromising the accuracy of your results.
Step 5: Analyze data
After you've sourced the correct data to resolve your question in the first step, the next step is going deeper into data analysis.
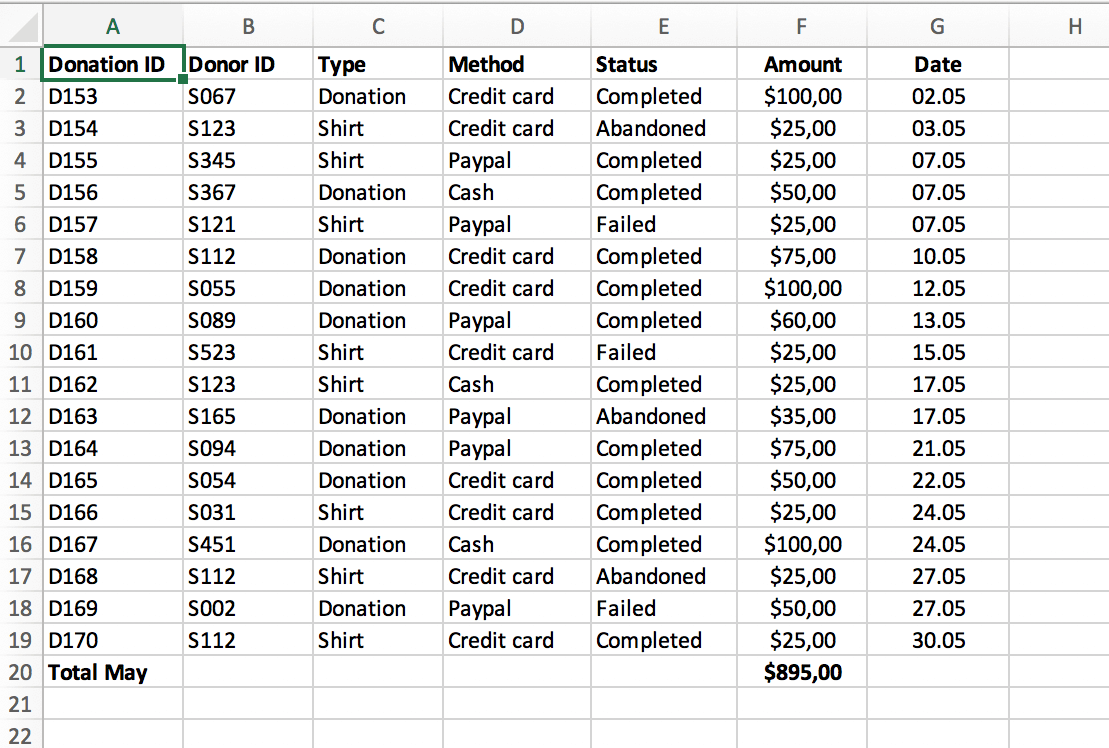
Start by converting your data in several ways, like plotting it on a graph, examining the correlations, or creating a pivot table in Excel.
What is a pivot table?
This table enables you to sort and filter data over different variables to calculate the mean, minimum, maximum, and standard deviation of that data. This is also where data cleaning happens.
Data analysis software and tools are essential during this stage. You can try apps and analytics tools like Stata, Visio, Minitab, and Microsoft Excel or explore other data analysis tools.
Step 6: Interpret results
As soon as you've analyzed your data, you need to interpret the results. While interpreting your analysis, remember you can't prove the validity of a hypothesis. Instead, you can only accept it. This means unforeseen circumstances can interfere with your results regardless of how much data you collect.
So you need to ask yourself as you proceed:
- Does this data provide a solution to the first question? How?
- Does the data empower you to safeguard against any objections? How?
- Are there limitations to the findings?
- Are there any new perspectives to be considered?
If the interpretation holds against all these questions and factors, you have possibly reached a productive conclusion. What remains is to utilize the results of the data analysis process and make informed decisions.
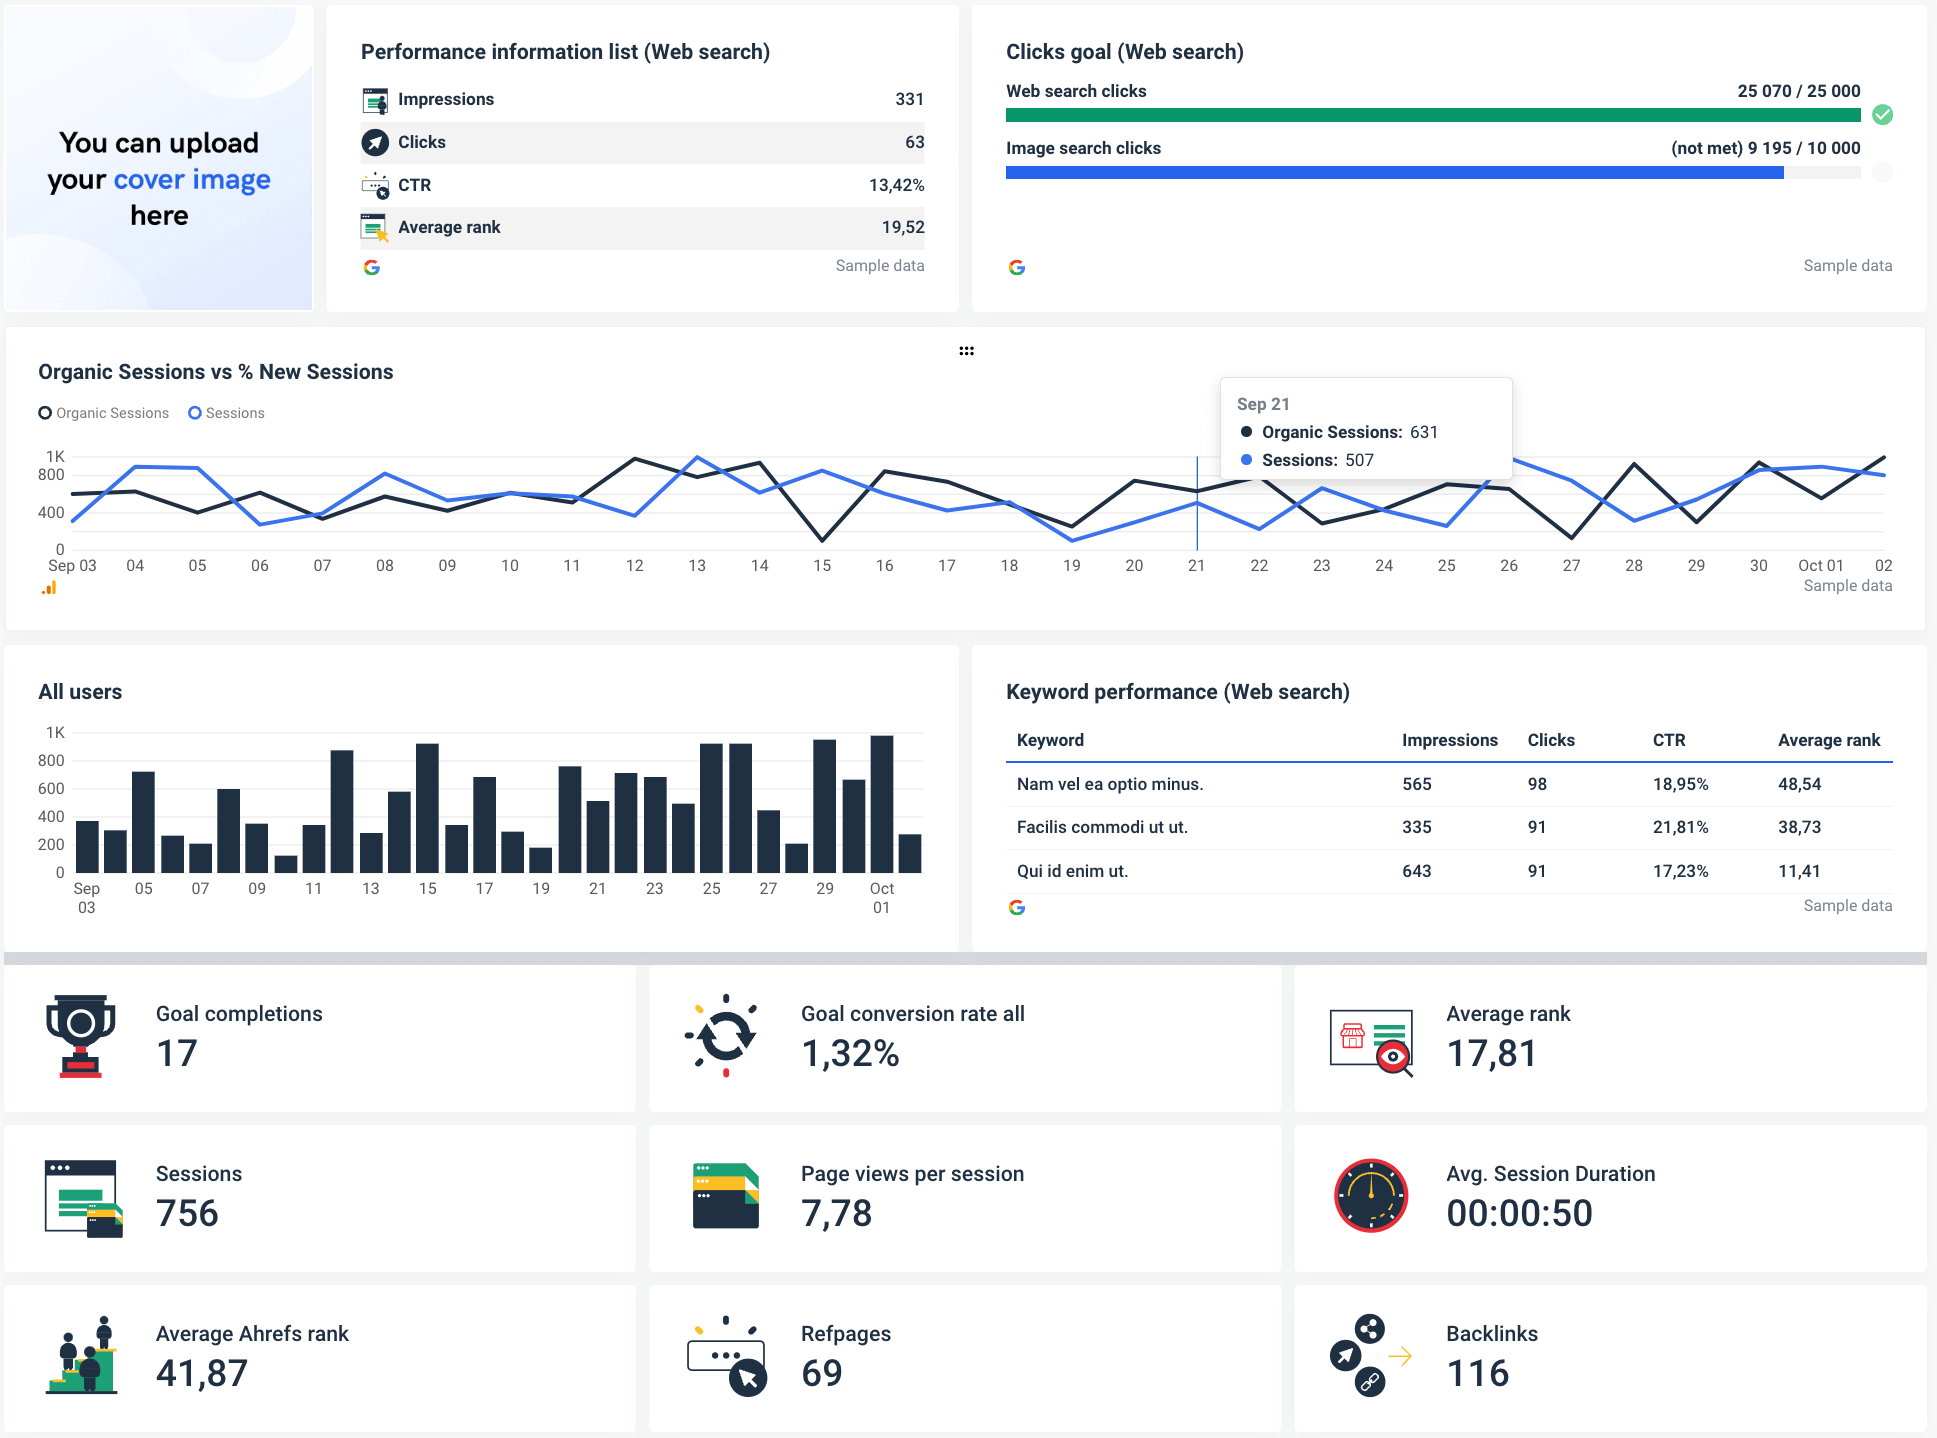
Step 7: Visualize and share data
Having analyzed your data, it is helpful to represent the data in a graph, chart, or other visual formats. This is where data visualization comes in. It uncovers the relationships of the analyzed data using images, whether it’s quantitative data or qualitative data. With data visualization, you can easily see trends and patterns.
Whatagraph has more than 45 integrations with the most popular marketing data analysis tools, allowing you to create beautiful visual reports in minutes.
Pick a report or dashboard template from our library and visualize the results of your data analysis in a way that is easy to understand.
Once you create a report, you can change the details you want, including the logos and colors of the elements. And even white-label the report to remove Whatagraph branding.
Finally, Whatagraph allows you to share the visualizations you create as automated emails or live links to reports and dashboards.
Choose the tools you need for data analysis
Data analysts have long used Excel and other spreadsheet tools to store and analyze data. Far from being practical, these tools make specific analysis tasks impossible. For example, try analyzing qualitative (non-numerical) data like social media comments or customer support
conversations in spreadsheets. No way.
Similarly, if you need to analyze large data sets with multiple complex variables, you’ll need more specialized tools to automate the process and reduce the chance of human error.
Let’s look at some of the data analysis tool types you might find helpful.
Spreadsheets
Spreadsheets like Excel are still among the most flexible tools for analyzing small or medium data sets. You don’t need any technical expertise to use it, and the interface is already familiar to many users.
On the other hand, Excel may crash or freeze if you try loading large data sets. Not to mention that the data typing system is slow, and data visualization options are limited.
For these reasons, spreadsheets are not suitable for analyzing large amounts of data, despite their availability and versatility.
However, you can use them to bring marketing data from any source to your more capable data analytics tool.
Whatagraph, for example, has a native Google Sheets integration, so users can connect data they’ve exported from any marketing tool and visualize it in a Whatagraph report.
This option is a good workaround for visualizing marketing data from platforms that are outside of current integrations.
Business intelligence tools
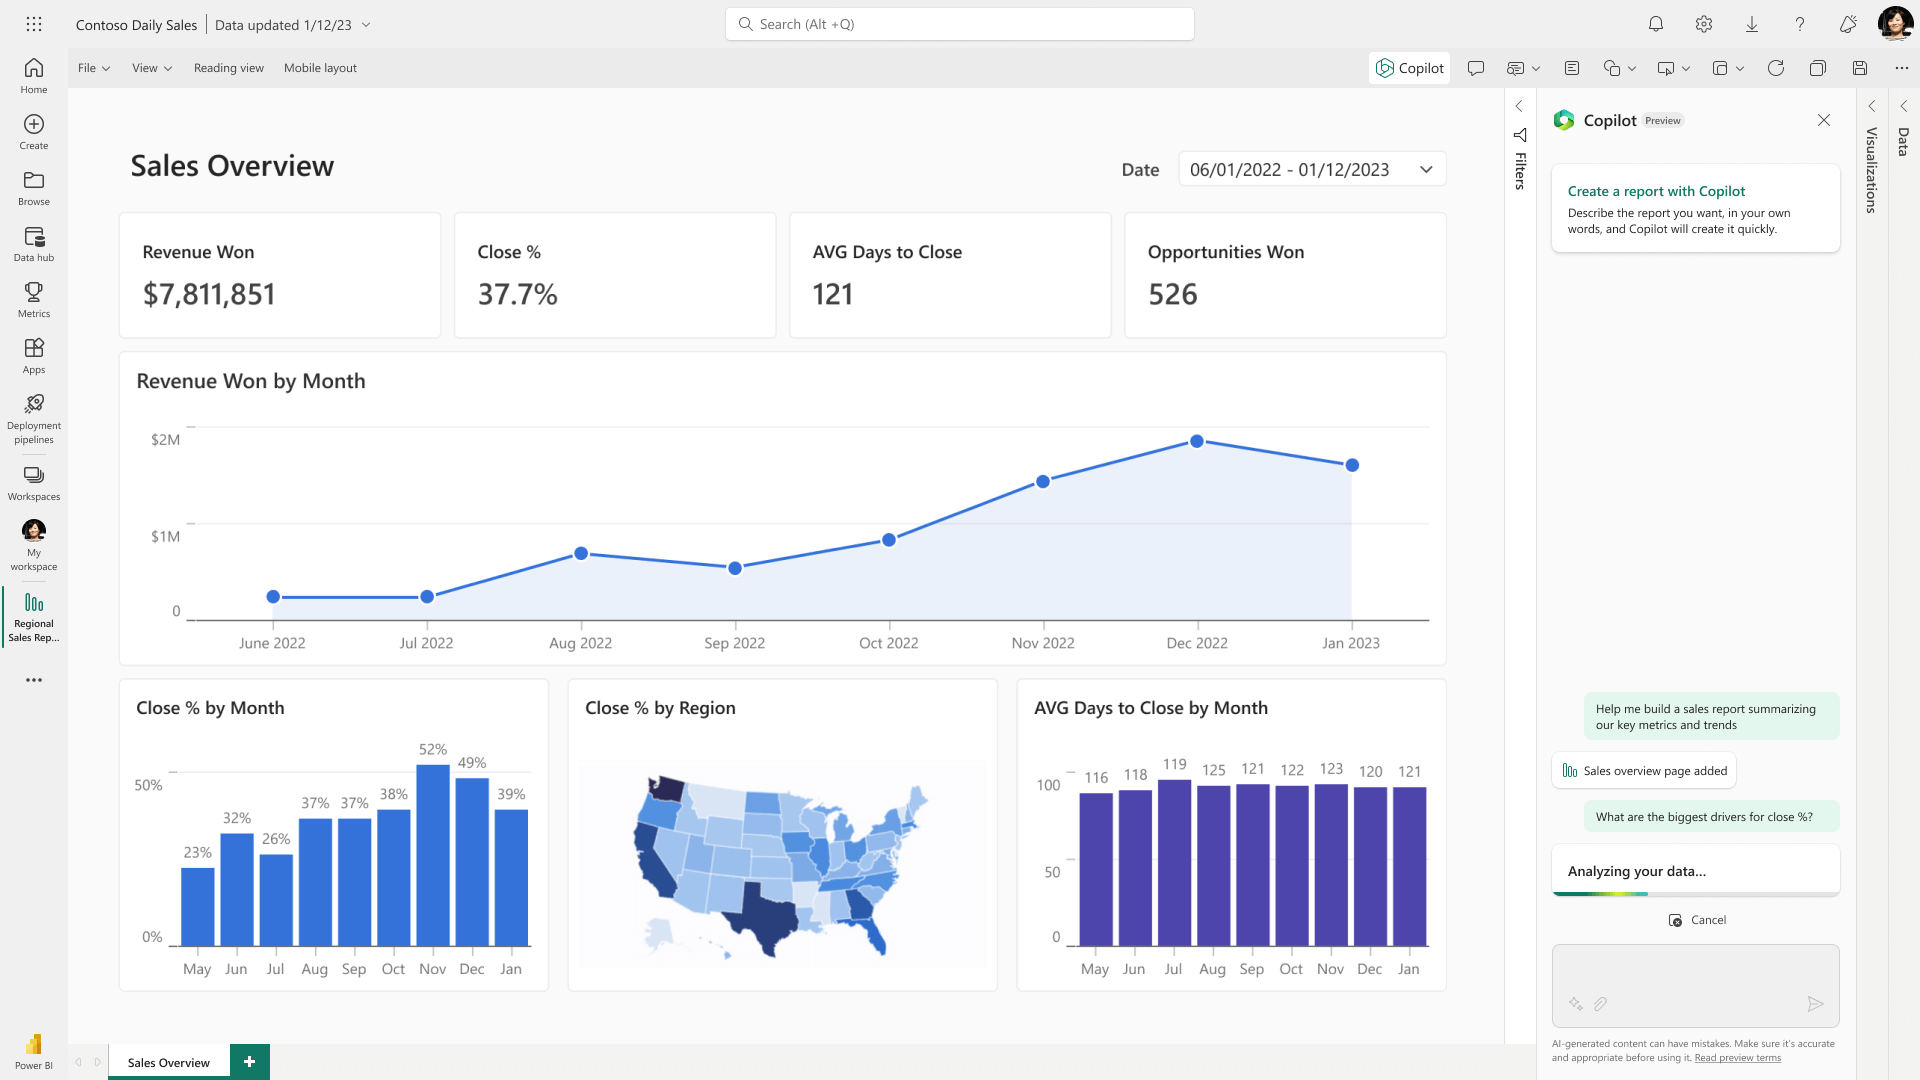
Business intelligence tools are specifically designed to help teams analyze large data sets and spot trends and patterns in data. Data platforms like Power BI and Tableau also include visualization features so users can easily create charts, graphs, and other visual elements to present data insights to stakeholders.
Predictive analysis tools
Predictive analysis tools rely on machine learning, data mining, and other advanced analytic techniques to spot trends and create predictions based on those trends. You can use these tools to predict what scenario will most likely occur in the coming months and how it will affect your business.
Data modeling tools
Data modeling tools help you understand relationships between different data objects. Data models allow non-technical stakeholders a simplified way to discuss the needs of the business and how data insights can be used for better decision-making.
Modern data modeling tools automatically build database schemas that set the pattern of how your data is stored within a database or warehouse and model mergers and comparisons. This allows you to reverse-engineer existing databases into these models.
Team-specific analytics tools
Team- or department-specific analytics tools help with data analysis in specific teams or areas of organization. In other words, they are specifically designed to fit the needs of individual departments like marketing, finance, or human resources.
For example, a marketing analytics tool can analyze organic traffic by pulling data from Google Search Console or identify sales data trends by pulling data from the company’s CRM.
A finance analytics tool can be used to analyze financial data, create budgets and forecasts, and identify financial performance trends.
Conclusion
By adopting these seven data analysis steps, you will make better and more informed decisions for your business or digital marketing agency. You’ll be able to back your choices with carefully sourced and analyzed data.
As time passes, you will gain speed and accuracy and choose better data analysis techniques to help you become a better decision-maker and run your business effectively.
Whatagraph gives you a user-friendly and fast no-code way to visualize your marketing data and complete the analysis by sharing the insights with clients, managements, or stakeholders.
Instead of using two or three separate tools, you can use one platform to connect, visualize, and share your marketing data, accelerating and simplifying your process.
Interpret multi-source data with ease using custom formulas and visualize the exact metrics you need through custom widgets you can save as templates for future use.
Whatagraph lets you dig deep into marketing data and make educated decisions about your clients’ campaigns. Book a demo call and learn how Whatagraph can help you analyze marketing data and present the results as visual reports that are easy to understand, organize, and share.
Published on Apr 01 2020
WRITTEN BY
Mile ZivkovicMile is the ex-Head of Content at Whatagraph. A marketing heavy with almost a decade of SaaS industry experience, Mile has managed multiple content marketing teams without losing an ounce of his writing passion.