12 Facebook Ads Metrics to Track
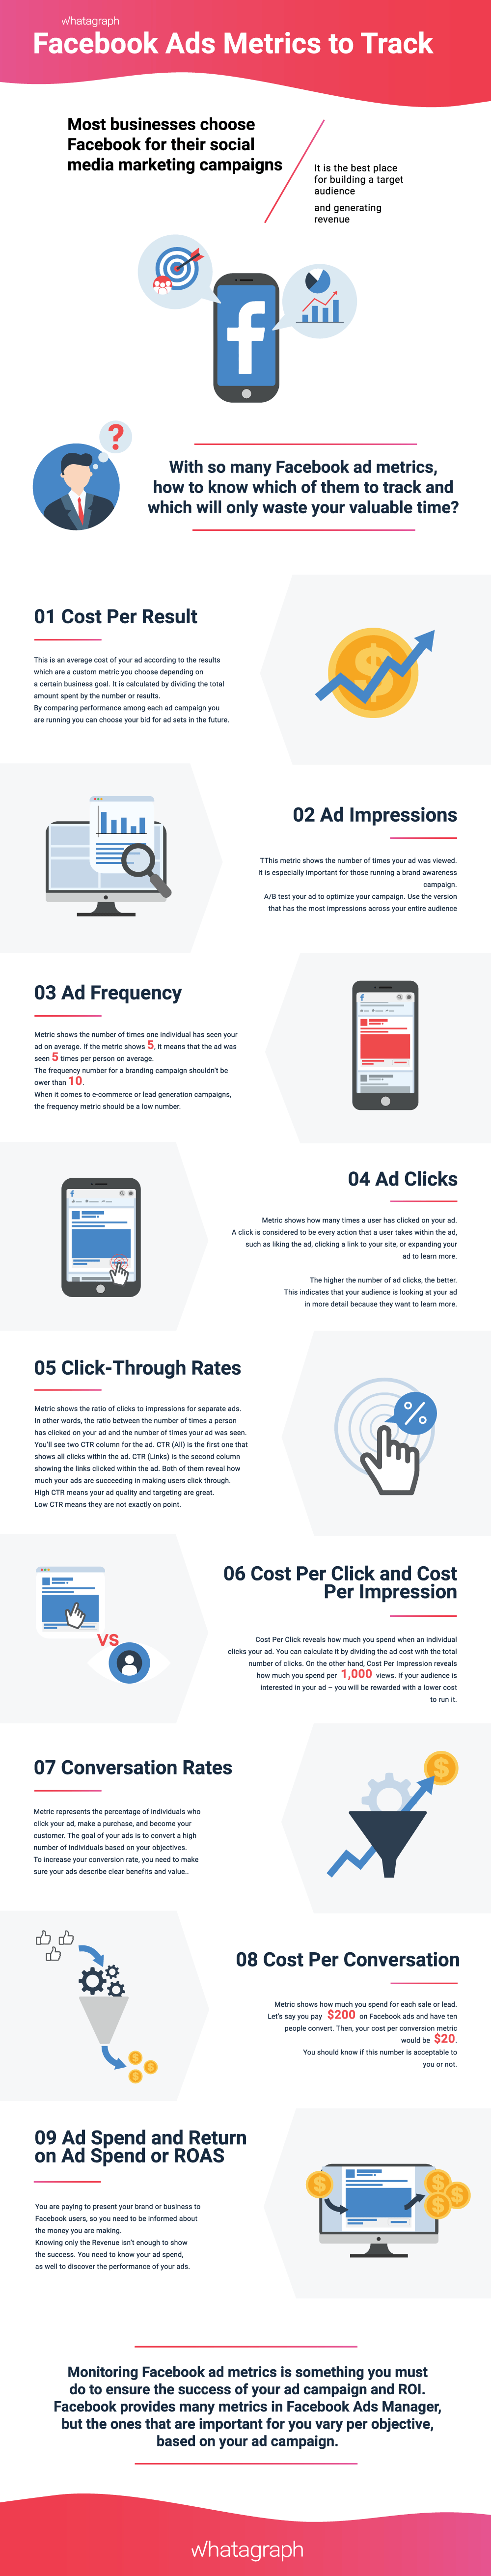
Most businesses choose Facebook for their social media marketing campaigns, and that’s understandable. It is the best place for building a target audience and generating revenue. Once you get your Facebook ad campaign up and running, you need to start tracking Facebook Ads metrics.

Jan 24 2020●7 min read


- Most Important Facebook Ads Metrics
- 1. Cost Per Result
- 2. Ad Impressions
- 3. Ad Frequency
- 4. Ad Clicks
- 5. Click-Through Rates
- 6. Cost Per Click and Cost Per Impression
- 7. Conversion Rates
- 8. Cost Per Conversion
- 9. Ad Spend and Return on Ad Spend or ROAS
- 10. Total Conversion Value
- 11. Cost Per Action (CPA)
- 12. Relevance Score
- To Sum Up
Facebook ads metrics will answer every question you have about your ad campaign. Tracking them is necessary for the success of your social media platform campaign. It will help you build a target audience, attract customers, bring traffic to your website, calculate your ROI, as well as understand how your users interact with your ads and what you can do to improve them and increase the return on investment (ROI) of your Facebook page.
But, with so many Facebook ad metrics in the Facebook Analytics dashboard, how to know which of them to track and which ones are vanity metrics — those that only waste your valuable time?
Here are the most important Facebook ad metrics that will help you track how well your Facebook campaign performs and make better decisions about how to run it in the future.
Most Important Facebook Ads Metrics
To monitor your Facebook Ads campaigns or ad sets, you need to open your Facebook Ads Manager and select the ad, ad set, or campaign you want to monitor. Here you create, send, and manage the campaign.
When it comes to ad campaigns, it’s important to monitor them while performing as well as evaluate the results once they are completed.
Even though the metrics that will let you know if your campaign is performing well depend on the type of campaign or objective, here are the most important ones to keep an eye on.
1. Cost Per Result
This metric presents the average cost of your ad according to the results which are a custom metric you choose depending on a certain business goal.
Let’s say you set a result that’s associated with conversion, and every time a customer purchases your site after viewing your ad, it’s counted as a success.
The metric shows how cost-efficiently you accomplished your objectives set in a specific ad campaign. It’ll help you recognize areas of opportunity by comparing performance among each ad campaign you are running and choose your bid for ad sets in the future.
It’s calculated by dividing the total amount spent by the number or results.
2. Ad Impressions
This Facebook Ads metric shows the number of times your ad was viewed in the News Feed. It is especially important for Facebook advertisers running a brand awareness campaign as it reveals the exposure level of your brand name. Still, if someone has seen your ad, it doesn’t necessarily mean they will remember you.
But, being able to recall who you are as a brand is crucial for a branding campaign.
When running an e-commerce or lead generation campaign, knowing the exact number of ad impressions is not important.
A/B test different ads to optimize your campaign. Use the version that has the most impressions across your entire audience.
For example, if you track ad impressions for a week and you notice an increase in exposure during that period, it means the content and design of your ad creative is a winning combination as they are getting noticed.
Tracking ad campaign performance at a higher level allows you to see how different types of ads perform in relation to one another.
3. Ad Frequency
The ad frequency metric shows the number of times one individual has seen your ad on average. If the metric shows 5, it means that the ad was seen 5 times per person on average.
The frequency metric should be as high as possible when you run a branding campaign as that helps a person who’ve seen your ad to recall or remember your brand name. The frequency number for a branding campaign shouldn’t be lower than 10.
When it comes to e-commerce or lead generation campaigns, the frequency metric should be a low number. If it’s 9, for example, it means the cost per click is increased by 160%. So, by the time a person sees your ad nine times, they have already shown no interest to click or have already clicked.
4. Ad Clicks
This important Facebook metric shows how many times a user has clicked on your ad. Ideally, you want a higher number as that would mean people often click because they are interested in your ad or what you are saying.
A click is considered to be every action that a user takes within the ad, such as liking the ad, clicking a link to your site, or expanding your ad to learn more.
The higher the number of ad clicks, the better. This indicates that your demographic is looking at your ad copy in more detail because they want to learn more. And, the more interested they are in the ad, the more likely they are to look for your brand when they need the type of service or product you’re offering.
5. Click-Through Rates
This metric shows the ratio of link clicks to impressions for separate ads. In other words, the ratio between the number of people who have clicked on your ad and the number of times your ad was seen on Facebook.
This Facebook metric presents the percentage of individuals who click on an ad out of all individuals who have seen the ad. You can find this data in the campaign view in Facebook Ads Manager.
You’ll see two CTR columns for the ad. CTR (All) is the first one that shows all clicks within the ad. CTR (Links) is the second column showing the links clicked within the ad. Both of them reveal how much your ads are succeeding in making users click through.
High CTR means your ad quality and targeting are great. Low CTR means they are not exactly on point, so people aren’t interested in your ad. A medium to high-range CTR is ideal.
6. Cost Per Click and Cost Per Impression
Cost Per Click (CPC) reveals how much you spend when an individual clicks your ad. You can calculate it by dividing the ad cost by the total number of clicks. On the other hand, Cost Per Impression reveals how much you spend per 1,000 landing page views. To calculate this metric, multiply the advertising cost by 1000 and divide the result by the number of impressions.
If Facebook notices that your audience is interested in the ad you’re presenting to them, they will reward you with a lower cost to run it, or lower cost per click and cost per impression.
7. Conversion Rates
This metric represents the percentage of individuals who click your ad, make a purchase, and become your customer. The goal of your ads is to convert a high number of individuals based on your objectives. This, in turn, will bring you more sales.
To increase your conversion rate, you need to make sure your ads describe clear benefits and value.
8. Cost Per Conversion
This metric shows how much you spend for each sale or lead. Let’s say you pay $200 on Facebook ads and have ten people convert. Then, your cost per conversion metric would be $20. You should know if this number is acceptable to you or not.
For example, your cost per conversion is $20 on a $500 product that you sell on your e-commerce store. This means that you’re still making some profit. But, if your product is $30 and your cost per conversion number is $20, you’ll need to optimize your ad campaign to lower that cost.
9. Ad Spend and Return on Ad Spend or ROAS
You are paying to present your brand or business to Facebook users, so you need to be informed about the money you are making. This will help you realize in which way to continue your ad strategy in the future.
Knowing only the Revenue isn’t enough to show the success of your ad campaign. You need to know your ad spend, as a benchmark for determining the performance of your ads.
10. Total Conversion Value
Total conversion is a numerical value that’s assigned to specific conversions to show their impact on your business.
This is a key metric for Facebook ads and you get it by adding conversion values like conversion value per cost, conversion value per click, and value per conversion.
These conversion values can help you track, optimize, and report on your return on ad spend.
11. Cost Per Action (CPA)
An action is a desirable behavior that you expect from your prospect.
For example, it can be a click to your website, a video view, a share, or something else.
The Cost per Action will give you a more accurate view of your ads. If you can lower your CPA, then you’ll manage more conversion rates and drive higher revenue for the same spend.
So, for example, if you’ve got a CPA of 70 cents, it only tells you that you’re generating an action for that cost. If you compare it with your spend and frequency, then you’ll see a better picture of your most compelling ad set.
12. Relevance Score
The relevance score is a qualitative assessment of the relevance of your ad to your target audience.
It’s measured on a scale of one to ten and consists of three parts:
The quality ranking — the quality of ads displayed to the same audience.
Engagement rate ranking — the expected engagement rate of ads displayed to the same audience.
Conversion rate ranking — the anticipated conversion rate of ads displayed to the same audience.
Just keep in mind that these comparative engagement metrics aren’t alone the proof of your campaign’s success. It’s just nice to be able to see how your ads stack up.
To Sum Up
Monitoring Facebook ad metrics is something you must do to ensure the success of your ad campaign and the ROI of your marketing strategy. Facebook provides many metrics in Facebook Ads Manager, but the most important metrics vary per objective, based on your ad campaign.
We hope we helped you learn more about nine of the most important KPIs (Key Performance Indicators) or Facebook metrics that will guide your ad campaign strategy and lead them to success.
Published on Jan 24 2020
WRITTEN BY
Krystyna KrajevskajaKrystyna believes optimizing the way you report data is the key to a good marketing strategy. A seasoned social media manager with experience in B2B companies, she loves to identify and share new business opportunities.