Goal Tracking for Agencies: The Practical Guide
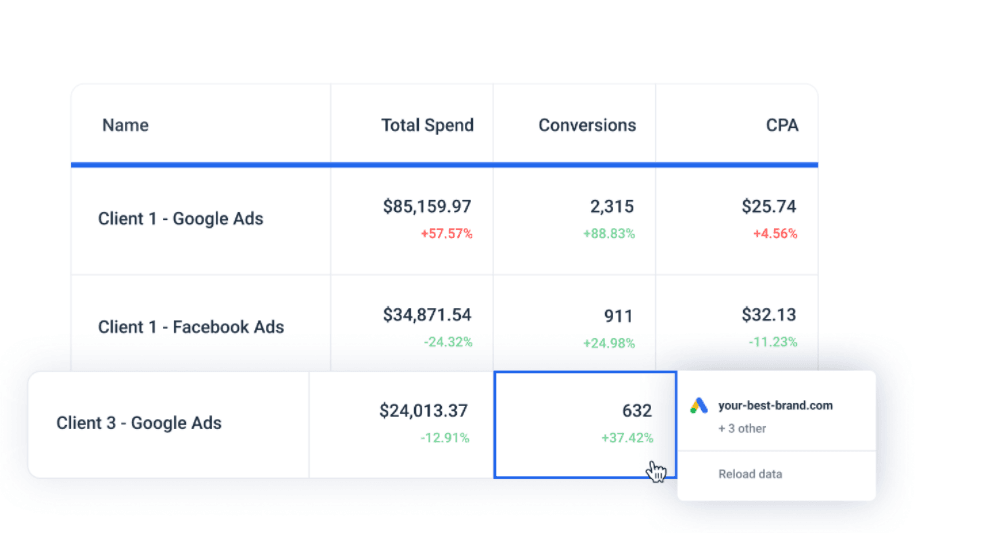
Whenever marketing analytics come into the discussion, the first question is always the same: which metrics to look at? And while building marketing reports provides freedom to include a lot of angles and KPIs, it’s the instant overview of the marketing campaign situation that is the real challenge. And Whatagraph says: challenge accepted! Macro marketing reports are now available with Overview.

Aug 12 2021 ● 6 min read
How are marketing KPIs a challenge?
Each marketing campaign is run on multiple channels. This means that every time your client asks you about how the campaign is performing, you have to go to all those channels and check certain metrics. And this is fine if you have just one campaign, or have the possibility to build a report every time. The challenge presents itself when you have multiple clients, running multiple marketing campaigns on a number of different channels.
This is where you need the Overview board: a place where KPIs of each client can be viewed in a single board.
Overview is simple
So how does Overview work? Quite simple:
- Pick the most important KPIs;
- Select all your clients that you want to track;
- Add your data sources (existing or new).
That’s it. The Overview tool, presented by Whatagraph, offers a uniquely simple way to build your own KPI board. Whatagraph is already known for making report-building an effortless experience - and Overview is no different.

See how simple it is to use Overview here.
The hardest part is deciding on your KPIs. While we can’t determine that for you, we can surely provide some use case scenarios that might help you make the most accurate decisions on using the Overview board.
Use case 1: stand-up meetings
If you’re working in sprints - morning stand-up meets are an essential part of your routine. The more people there are on your team, the longer the stand-up takes, and the more time it wastes.
Overview helps by providing a quick look over everyone’s client KPIs. If everything is in the green - you have a quick cheer and move on. If there are some red indications (e.g.: increased spending, fallen engagement, etc.), the issues can be presented and looked at deeper by the whole team. This way, you can only focus on the challenges and not waste time on irrelevant details.
Use case 2: Quick insights for clients
Some clients require a little more attention than others. While for the most part, you can get away with weekly or monthly reports, sometimes you need to provide frequent insights. That’s where Overview can help. After you set KPIs with your client, you can always have a quick chat with them and show how their marketing campaign is doing. No long calls, no deep analysis. Just quick benefits and solutions for problems - if any.
Use case 3: higher-up reporting
When discussing strategy or planning marketing campaigns ahead of time, quick insights into what works and what doesn’t are needed. Because Overview can be used by every team member with access to Whatagraph, during these meetings you can always keep track on their campaign KPIs and make decisions accordingly.
Try it yourself
Whatagraph now offers Overview as part of our packages. The first 3 rows are free to use, so you can experience the benefits the tool offers. During the 7-day free trial with Whatagraph, you can test the capabilities of Overview without any limits. We invite you to bring your marketing analytics to a whole new level!
Published on Aug 12 2021

WRITTEN BY
Indrė Jankutė-CarmaciuIndrė is a copywriter at Whatagraph with extensive experience in search engine optimization and public relations. She holds a degree in International Relations, while her professional background includes different marketing and advertising niches. She manages to merge marketing strategy and public speaking while educating readers on how to automate their businesses.