What You Must Include in Your Monthly Marketing Report [+ Free Templates]
All successful agencies and marketers use monthly marketing reports to check if their performance is on track and to increase conversions. You and your team have been working hard and making adjustments all month. Now, it is time to see the results and tell everyone else how your marketing performs.

May 21 2021●7 min read


![What You Must Include in Your Monthly Marketing Report [+ Free Templates]](https://media.whatagraph.com/monthly_marketing_report_b6d7d8aab3.png?width=992)
Continue reading to find out how to write a monthly report and find five report templates at the end.
What is a monthly marketing report?
A monthly marketing report is a document that helps marketers present the results of their marketing campaigns and strategies to their teams, managers, and clients over a month.
Monthly marketing reporting allows founders, CEOs, and directors to see if their marketing efforts are paying off. It is also an effective way to present vital information to help them make more informed decisions.
With this type of report, you can involve everyone on your team in the marketing process, including departments other than yours. It’s a brilliant way to ensure marketing and sales work together to achieve common goals.
Sharing a monthly marketing report with your clients lets them see clear and concise data to help them understand what you’ve done in the past month and prove your worth.
Why monthly?
There are different types of marketing report intervals — daily, weekly, monthly, quarterly, and annual marketing reports. While each provides valuable information about your marketing plan, in most cases, the monthly report works best for everyone — marketers, bosses, and clients. However, weekly marketing reports may work just as well.
Reporting too frequently with insufficient information will waste valuable time you could use much more productively. On the other hand, reporting every month gives you enough time to show meaningful results in a short enough time frame to make changes based on your performance.
Moreover, most executives don’t track marketing departments more often than once a month. The bottom line is that writing monthly performance reports will help you be a more agile marketer.
What to include in a monthly marketing report?
You don’t want your bosses or clients to read 20 pages of data every month, nor do they. For that reason, your monthly marketing report should be efficient and comprehensive.
1. Start with the report header
Start your monthly marketing template with a header, where you’ll introduce your client’s company name and logo. If your reporting tool has that option, you can change the color scheme to match their branding.
Here’s where you should also include the table of contents for your report. The contents will depend on your marketing goals, but most marketing reports include these sections:
- Marketing goals and KPIs,
- SEO data,
- PPC campaign data,
- Email marketing data,
- Leads and customers,
- Social media analysis,
- Key findings and recommendations.
Create the headers and organize the sections of key metrics you want your new marketing report to have.
2. Outline your main KPIs and monthly accomplishments
The second part should be the executive summary, where you’ll explain what the marketing team has accomplished and how that aligns with the overall marketing goals.
If there’s an extensive campaign underway, say what tasks you have completed and what are the roadblocks.
Ensure your goals and key performance indicators for their evaluation are clearly defined and included in your monthly marketing report.
This will also help your managers know your future strategies and understand how to evaluate your marketing success.
Sam Browne, CEO and Founder of HARO SEO, says that they typically incorporate leads by source, top landing pages, paid vs. organic leads, and marketing reach into their monthly marketing report because it helps their clients assess the ROI of their marketing purchases.
3. Define the month’s marketing reach
Show how many people you’re reaching through your marketing efforts and whether that reach increases month-over-month (MoM). The greater your reach, the more leads you can hope to get.
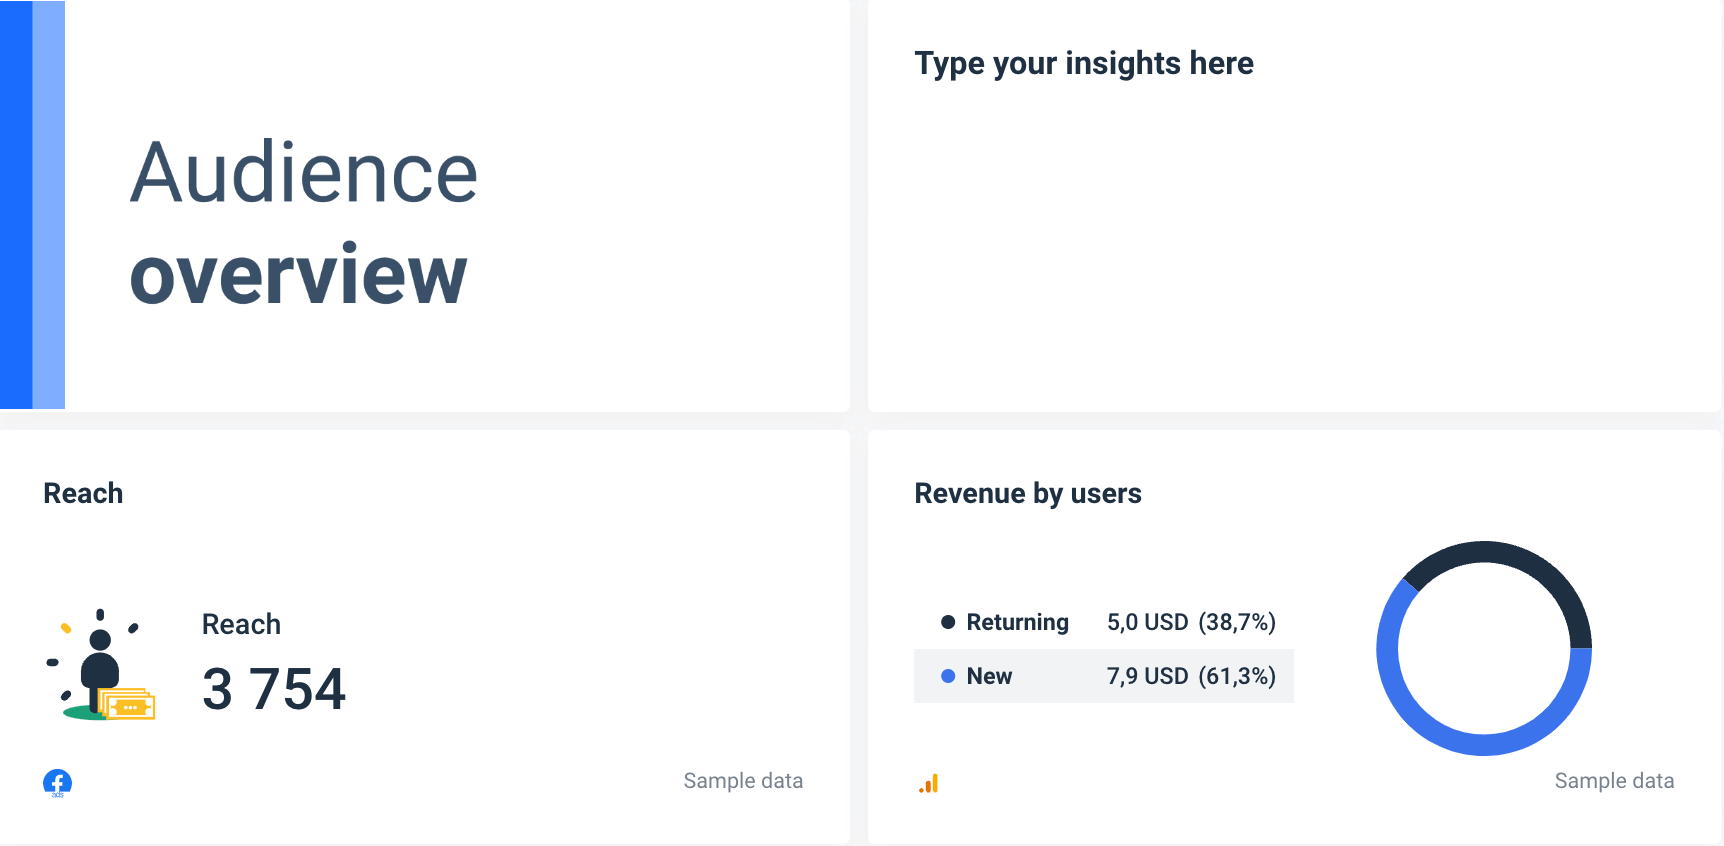
The marketing reach metrics are a solid measure of how your content efforts engage your audience.
The KPIs you should include to highlight the success of your reach include:
- Organic traffic to your website landing pages,
- Followers across all social media channels,
- New email newsletter subscribers,
- Total marketing reach across all platforms.
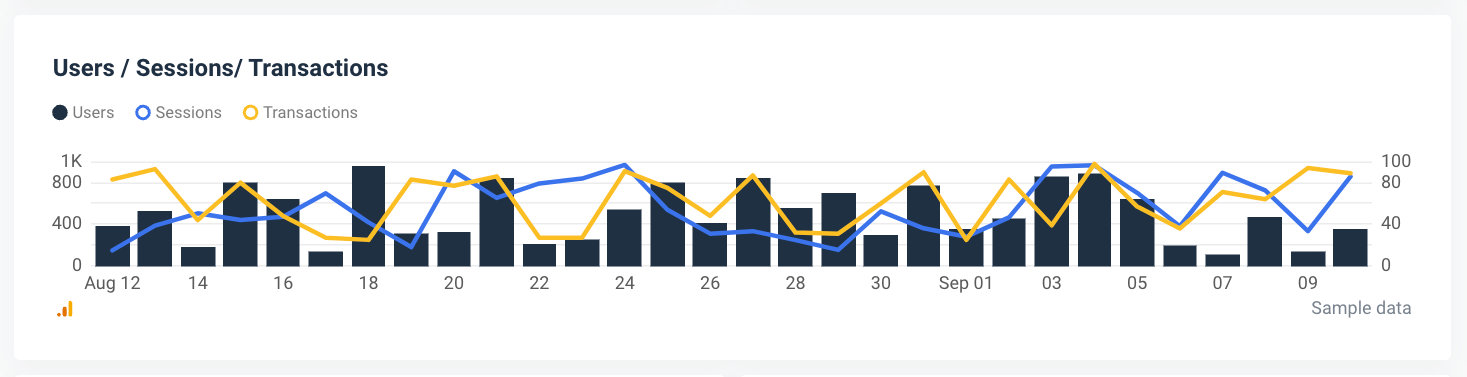
4. Monitor the website traffic
Connect Google Analytics 4 or another website analytics tool to track your website traffic. These metrics are essential for understanding how well your inbound marketing is performing and creating opportunities.
Also, you want to segment the visitors, as some might have viewed your product page, read your blog, or just checked out your home page for a company overview.
So include the top 3 pages by visits that month:
- Home page,
- Product page,
- Top blog post.
You can use a pie or donut chart to visualize your site traffic segments.
Also, include the number of website visitors, how they found your website, and how many of them have become leads.
5. Show monthly SEO results
In this section, you should share what you have done to increase organic search rankings and organic visitors to your website.
List the content you’ve created and published each month, such as blog posts and their metrics. This will help you determine if your content marketing and search engine performance are heading in the right direction.
Thanks to this valuable data, you can decide if you need to increase or decrease the number of articles published and the length of the articles to improve your rankings.
To find this data, you can use analytics tools like Google Analytics 4, Ahrefs, Semrush, and Moz.
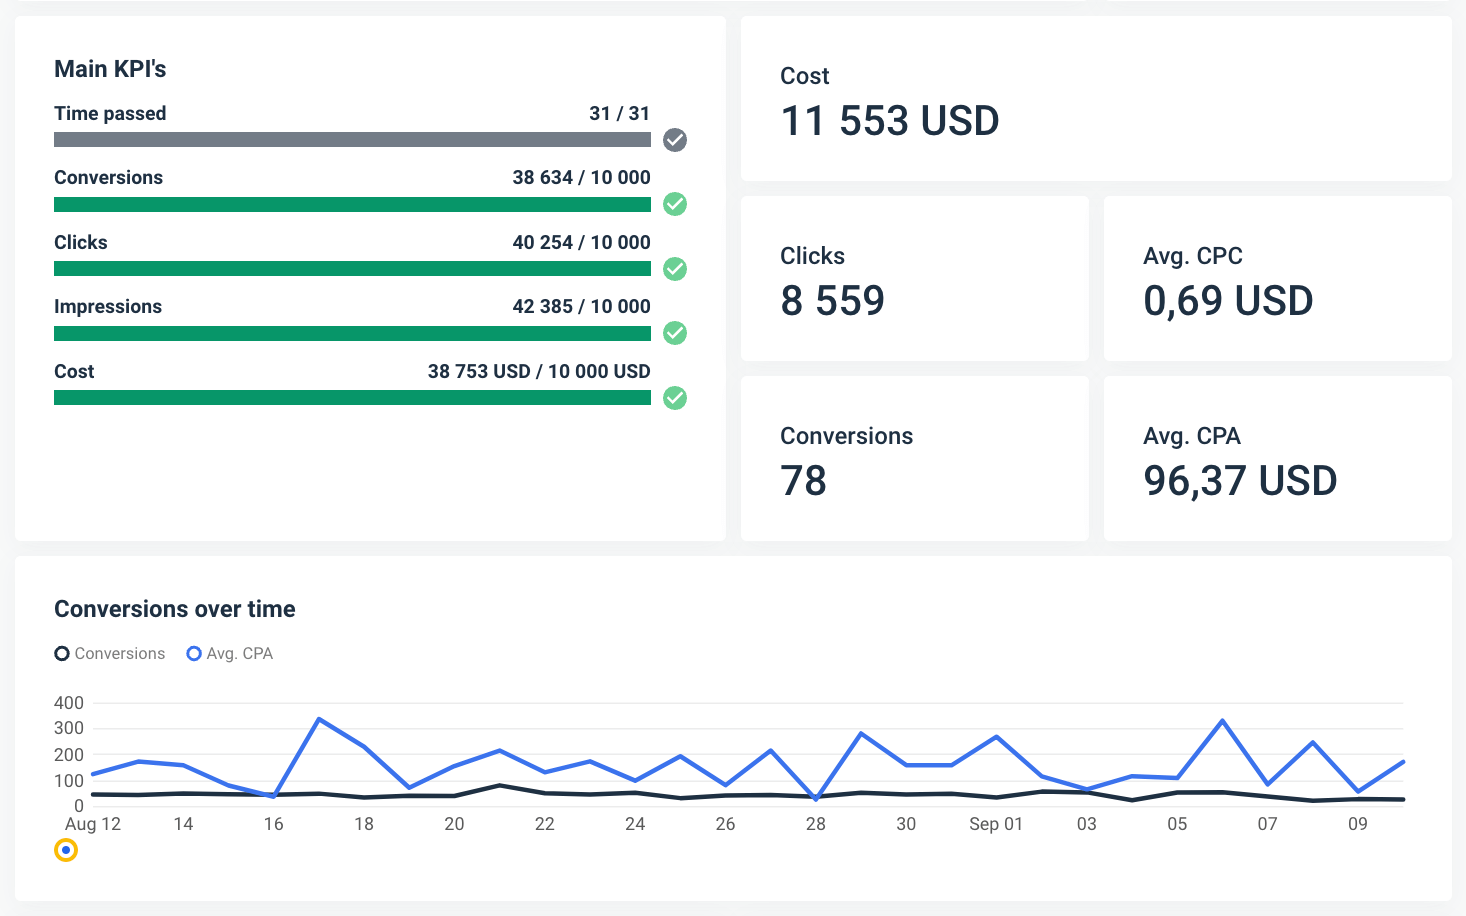
6. Make room for paid search metrics
If PPC campaigns are part of your monthly marketing efforts, include a report section for metrics that are specific to paid channels, such as:
- Clicks,
- Impressions,
- Conversion Rate,
- Cost per Conversion (CPC),
- Click-through Rate (CTR),
- Ad Spend.
7. Include email marketing data
An email campaign is a great way to nurture leads and drive conversion and engagement. If you use an email marketing platform like MailChimp or Campaign Monitor, these already have in-app analytics that you can connect and pull data from.
The metrics you’re interested in here are:
- Open rate,
- Bounce rate,
- Unsubscribes,
- Conversions,
- Click-through rate.
Monitoring and reporting these statistics will allow you to optimize your email marketing campaign.
If you connect your CRM data, you can add your sales numbers and make this a hybrid email marketing/ecommerce section.
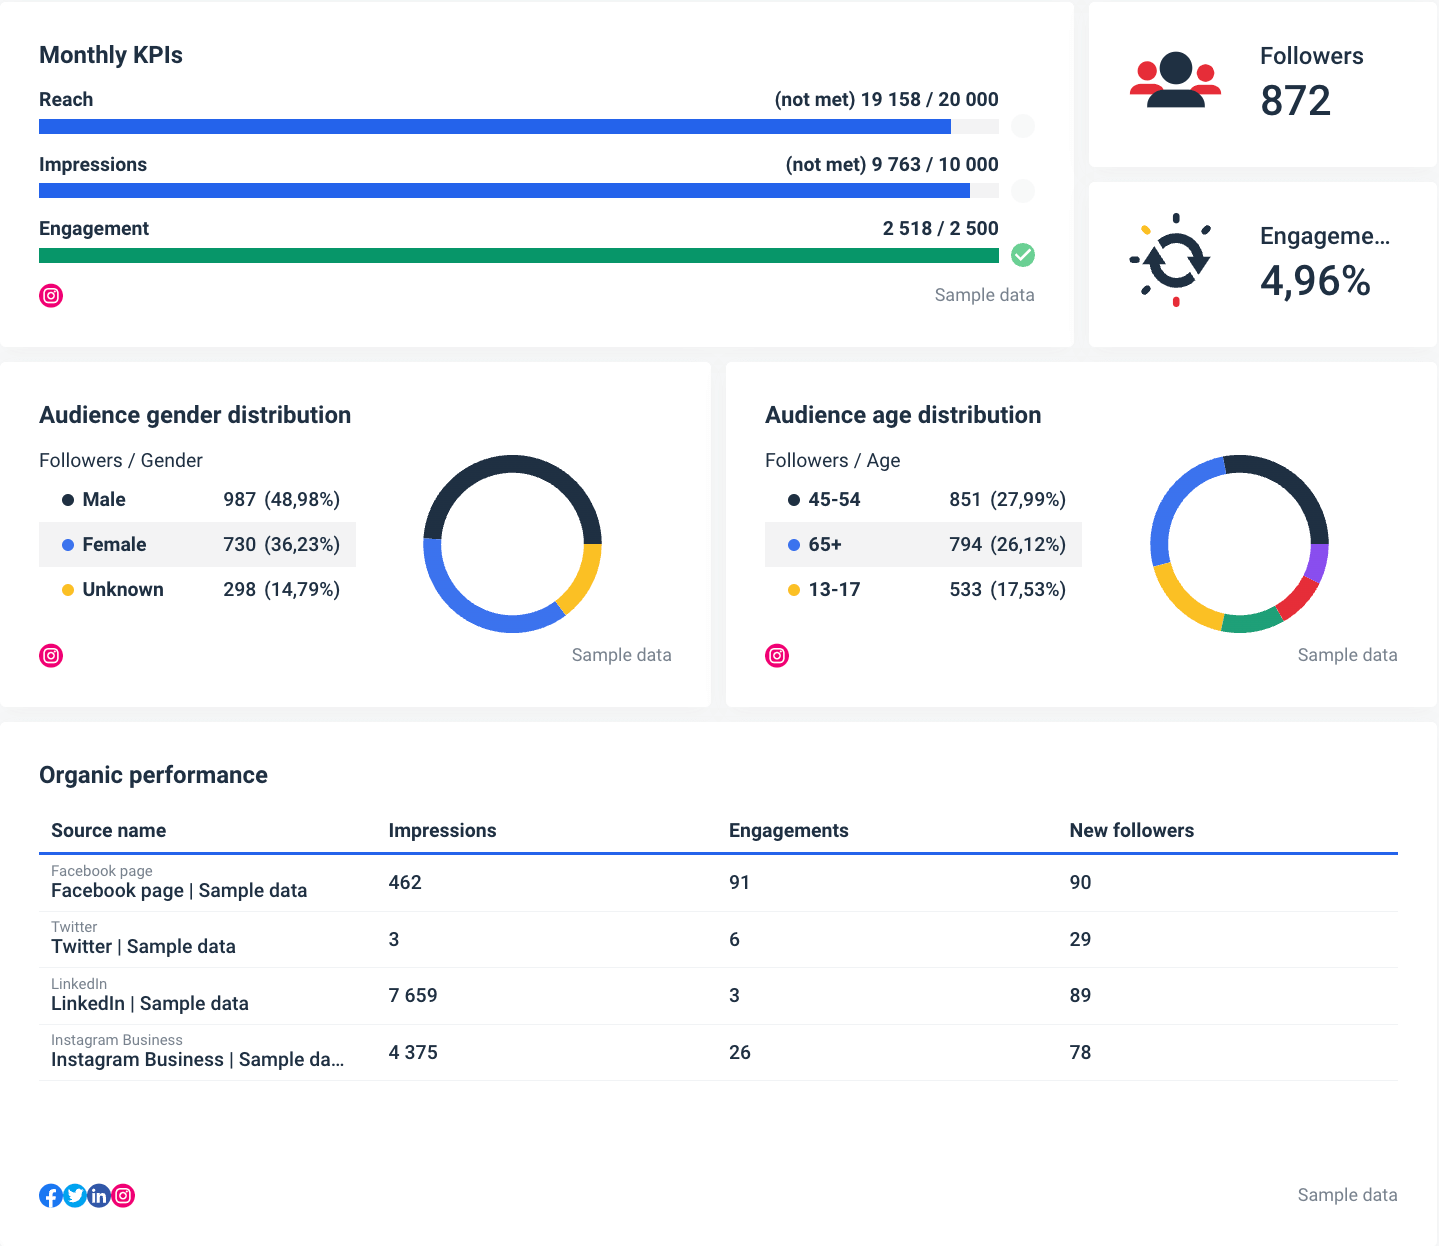
8. Report social media marketing activity
Social media marketing insights are an essential part of every monthly marketing report. Use this section to present the performance of each active social media channel you run for your client or company.
Here, the focus will be on engagement metrics that show the performance of each channel:
- Reach,
- Impressions,
- Engagement,
- Followers,
- Posts.
As well as a table of Top Performing Posts by:
- Post Impressions,
- Clicks,
- Reactions,
- Comments,
- Shares.
If you believe social media needs much more analysis, you can create a separate social media analytics report and make it a part of your monthly marketing report.
9. Don’t forget the performance trends
Month-over-month performance trends are essential as they help you stand out from the competition. Instead of explaining all individual metrics and data to your team, clients can see if your marketing campaigns are successful from the report.
Moreover, you can see if there is anything you can do to improve results and how your company’s marketing activities compare to industry standards.
10. Statistics
Make sure you include lots of informative data by including the following statistics:
Marketing qualified leads – including these statistics will help rate your website performance and the marketing performance that increases your traffic. Adding leads over time and other informative details are recommended.
Monitoring and reporting your sales-qualified leads will ensure your marketing strategy aims at the right target audience. Including details on your leads vs. goals can be of great help.
Marketing qualified leads and sales qualified leads to sales – the rate of leads generated that convert to sales will partially determine the success of your sales team. Thanks to these statistics, you can decide if your sales department needs to change its strategy.
11. Notes for significant changes and wrap-up
Adding notes to explain significant positive or negative changes in metrics from time to time is helpful for both you and those receiving the report. They make it easier to refer to a past report or explain the data and numbers to others. This will prevent you from receiving plenty of questions after sending a report.
Doing your job is only possible by digging into the numbers to understand these changes. If you determine the change was positive, you can change your marketing campaign to keep seeing that positive trend. On the other hand, noticing a negative trend means an opportunity to fix it.
At the end of your monthly marketing report, include a comment box to list your monthly achievements, tests performed with results, main points and conclusions, your plan for the next month, and the total return on investment from the marketing budget.
Whatagraph makes monthly reporting faster and easier
To create a monthly report, you’ll need a tool to pull relevant data, visualize it, and share it with your audience. Whatagraph might be just what you need to upscale your digital marketing reporting.
Here are a few reasons why you should consider Whatagraph as your reporting platform of choice:
All-in-one platform
Whatagraph is an all-in-one platform to connect, visualize, and share your marketing data. This makes the whole process much faster and more stable than using a separate tool for connecting or visualization.
Instead, Whatagraph has native integration with over 45 marketing platforms, so the speed and performance of your reports don’t depend on 3rd party connectors.
If you want to connect a source that isn’t supported yet, you can use a custom API, Google BigQuery, or Google Sheets.
Save anything as a template
You can edit every marketing dashboard or report template from our library and save it as your custom template. Change the report color and logo to match your or your client’s branding.
Resize and rearrange widgets using drag and drop; change their sources and add filters. You can save and use any graph or widget you customize in future reports without going through the same steps again.
Custom formulas
Whatagraph lets you combine and change “vanilla” metrics you pull from the marketing platforms and create new metrics. Edit any widget with an intuitive custom formula builder using simple mathematics.
This way, you can create unlimited new metrics, which is handy when creating tailored cross-channel marketing reports.
Organize reports in folders
Create folders for reports and dashboards you create for easier organization. When you build many reports, it’s easy to misplace them or even send one to the wrong client.
This folder scheme also helps in-house marketing teams in large companies who need to create monthly reports on different brands or divisions.
Bulk edit templates
This feature saves you a ton of time whether you’re an agency or in-house marketer. It doesn’t matter how many reports you are actively sending. If you need to add or remove a marketing channel, change the name, or company logo, do it to all reports at once.
Automated reporting
Create an email template, pick the frequency, add recipients, and set the delivery time. Whatagraph does the rest. No more downloading and attaching every report and worrying about deadlines and schedules.
Reviewing what gets sent is also an option, so you have some control before the send-outs.
Alternatively, share a live link to a report and let them check data as it updates.
Ready to get started with creating outstanding marketing reports? Request a free trial of Whatagraph today!
5 marketing report templates
Here are some of our marketing report templates for monthly reporting.
1. Marketing report template
A comprehensive all-around monthly marketing report template that includes all your marketing activities from website traffic to SEO, to social media and paid search, and everything in between.
The general-purpose marketing report contains the goal-tracking widget, which allows marketing agencies to assess their progress and measure performance.
This report example is more of a one-stop overview. To investigate the important metrics, check some of the report templates below.
2. Google Ads report template
If you want to create a more specific monthly report, such as Google Ads, you can quickly grab our Google Ads report template. Tracks all your KPIs for Google Ads across different accounts: conversions, clicks, impressions, CPC, ROAS, and Cost per Acquisition, or how much it costs to get a new customer.
3. Social media report template
Our social media report template is a pre-made document that pulls all your social media KPIs and performance metrics in one place. For example, combine Facebook Ads with LinkedIn Ads reports and add any social media metrics you want.
Moreover, you can use it for cross-channel reporting by combining data from platforms such as LinkedIn, Instagram, Facebook, TikTok, etc.
4. SEO report template
Examine your client's website performance KPIs, keywords, SERP positions, and other key SEO metrics using our SEO report template.
You can provide detailed data to your clients with just a few clicks. Track and display organic traffic, referral traffic, clicks, impressions, CTR, link-building analytics, and more for your client's website.
5. Sales report template
Use Whatagraph’s sales reporting software to highlight your key sales metrics and concentrate solely on important KPIs for you and your team members. Connect your CRMs, call center, email, and other sources into a consolidated sales report that puts your critical sales data in one place.
Conclusion
Creating a monthly digital marketing report and sharing it with your team, bosses, or clients will help everyone understand your marketing strategies and goals while making your job easier.
Sending such valuable data on a monthly basis will help your managers make data-driven decisions and help your clients and team be on board with your decisions, goals, and plans while making you a more agile marketer.
Published on May 21 2021
WRITTEN BY
Mile ZivkovicMile is the ex-Head of Content at Whatagraph. A marketing heavy with almost a decade of SaaS industry experience, Mile has managed multiple content marketing teams without losing an ounce of his writing passion.