


What is a Shopify reporting tool?
A Shopify reporting tool pulls your store data - sales, orders, revenue, customer behavior - out of Shopify's native dashboard and into a format you can actually work with.
Shopify's built-in reports are fine for day-to-day store management. But the moment you need to show a client how their Meta Ads spend connected to actual purchases, or compare ROAS across Google Shopping and organic traffic, you've hit a wall. A dedicated Shopify analytics tool bridges that gap.
Shopify holds the largest share of any ecommerce platform on the market - by a significant margin. That means a huge portion of ecommerce marketing work runs through Shopify data. And for agencies managing multiple ecommerce clients, having a proper Shopify reporting dashboard isn't a nice-to-have - it's the difference between spending two days on reports or two hours.
A good Shopify reporting tool does the real work for you:
- Connects directly to Shopify and pulls accurate, real-time store data
- Blends Shopify sales data with your paid channels into one unified view
- Tracks Shopify metrics like conversion rate, average order value, and revenue by source, alongside ad spend
- Delivers branded, automated reports that your clients can actually understand
With Whatagraph IQ, it goes further than that. Instead of assembling reports from scratch, you can:
- Type a prompt and get a complete Shopify analytics dashboard built for you - charts, tabs, and KPIs included
- Upload a client logo and have IQ Themes apply branding automatically
- Ask IQ Chat plain-language questions about your Shopify data and get instant answers
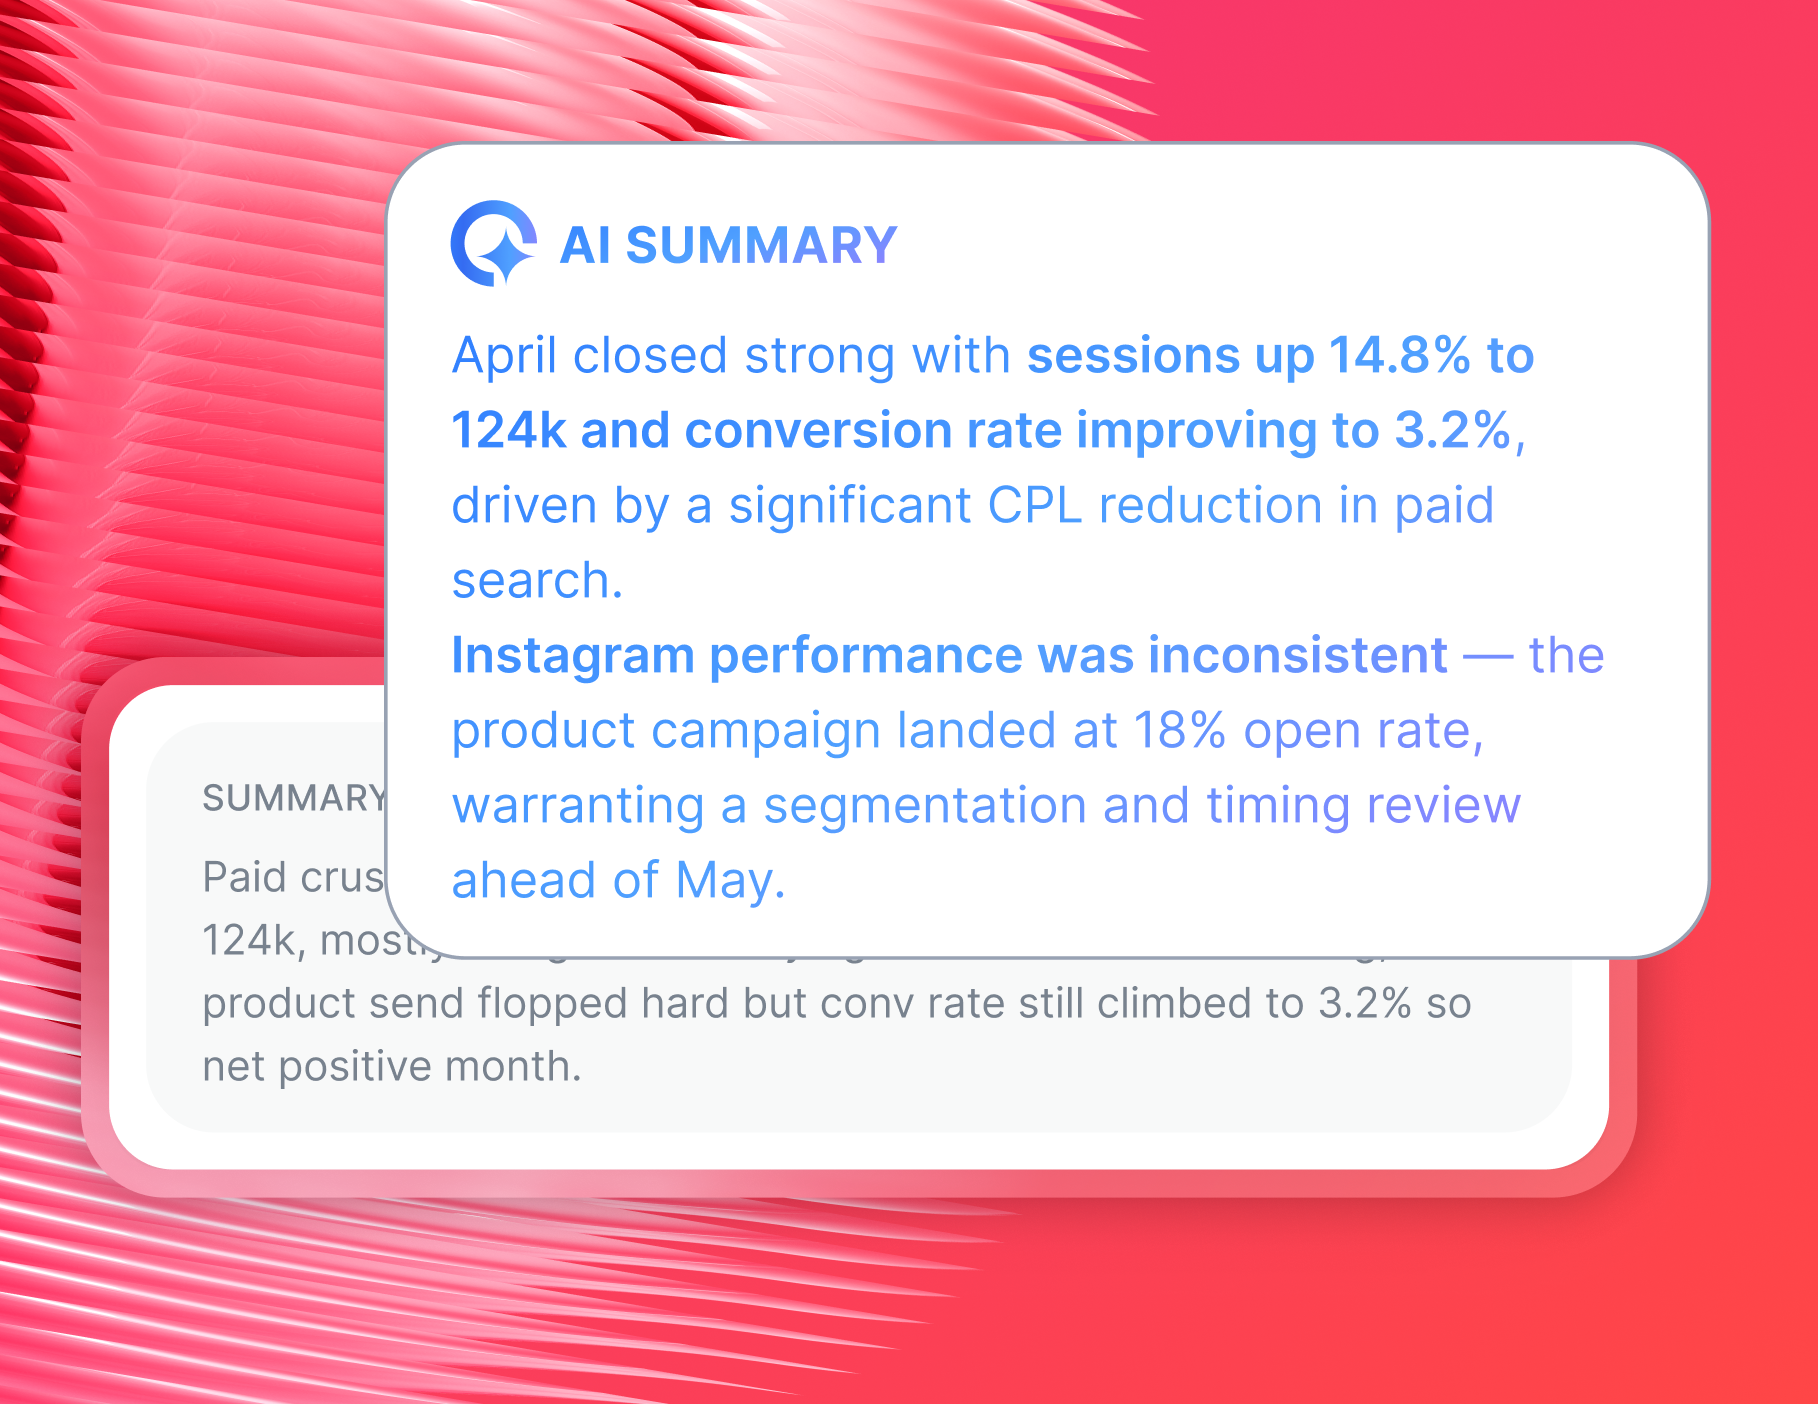
- Add AI-written performance summaries directly into reports - then edit them however you like
Whatagraph has also launched an MCP that lets you connect your data to Claude or ChatGPT and do your analysis there.
Peak Seven, an advertising agency in Florida managing 25 clients and 100+ ad campaigns, cut their reporting time from 4 hours per report to 1.5 hours after switching to Whatagraph. That's 63 hours saved every single month.
Whatagraph has helped everyone on our team get on the same page about clients, what's important, and how to talk to them. Our relationships with clients have been amazing, and we've even been able to retain them longer. Whatagraph is now our Bible - both for our clients and internal teams. - Kim Strickland, Digital Marketing Specialist at Peak Seven
How do I create Shopify reports for marketing clients?
Building a Shopify report for a client shouldn't mean logging into three platforms, copying numbers into an Excel spreadsheet, and hoping nothing breaks before the meeting.
With Whatagraph, you go from raw Shopify data to a polished, branded client report in under 30 minutes. Here's how it works:
1. Connect Shopify as a data source
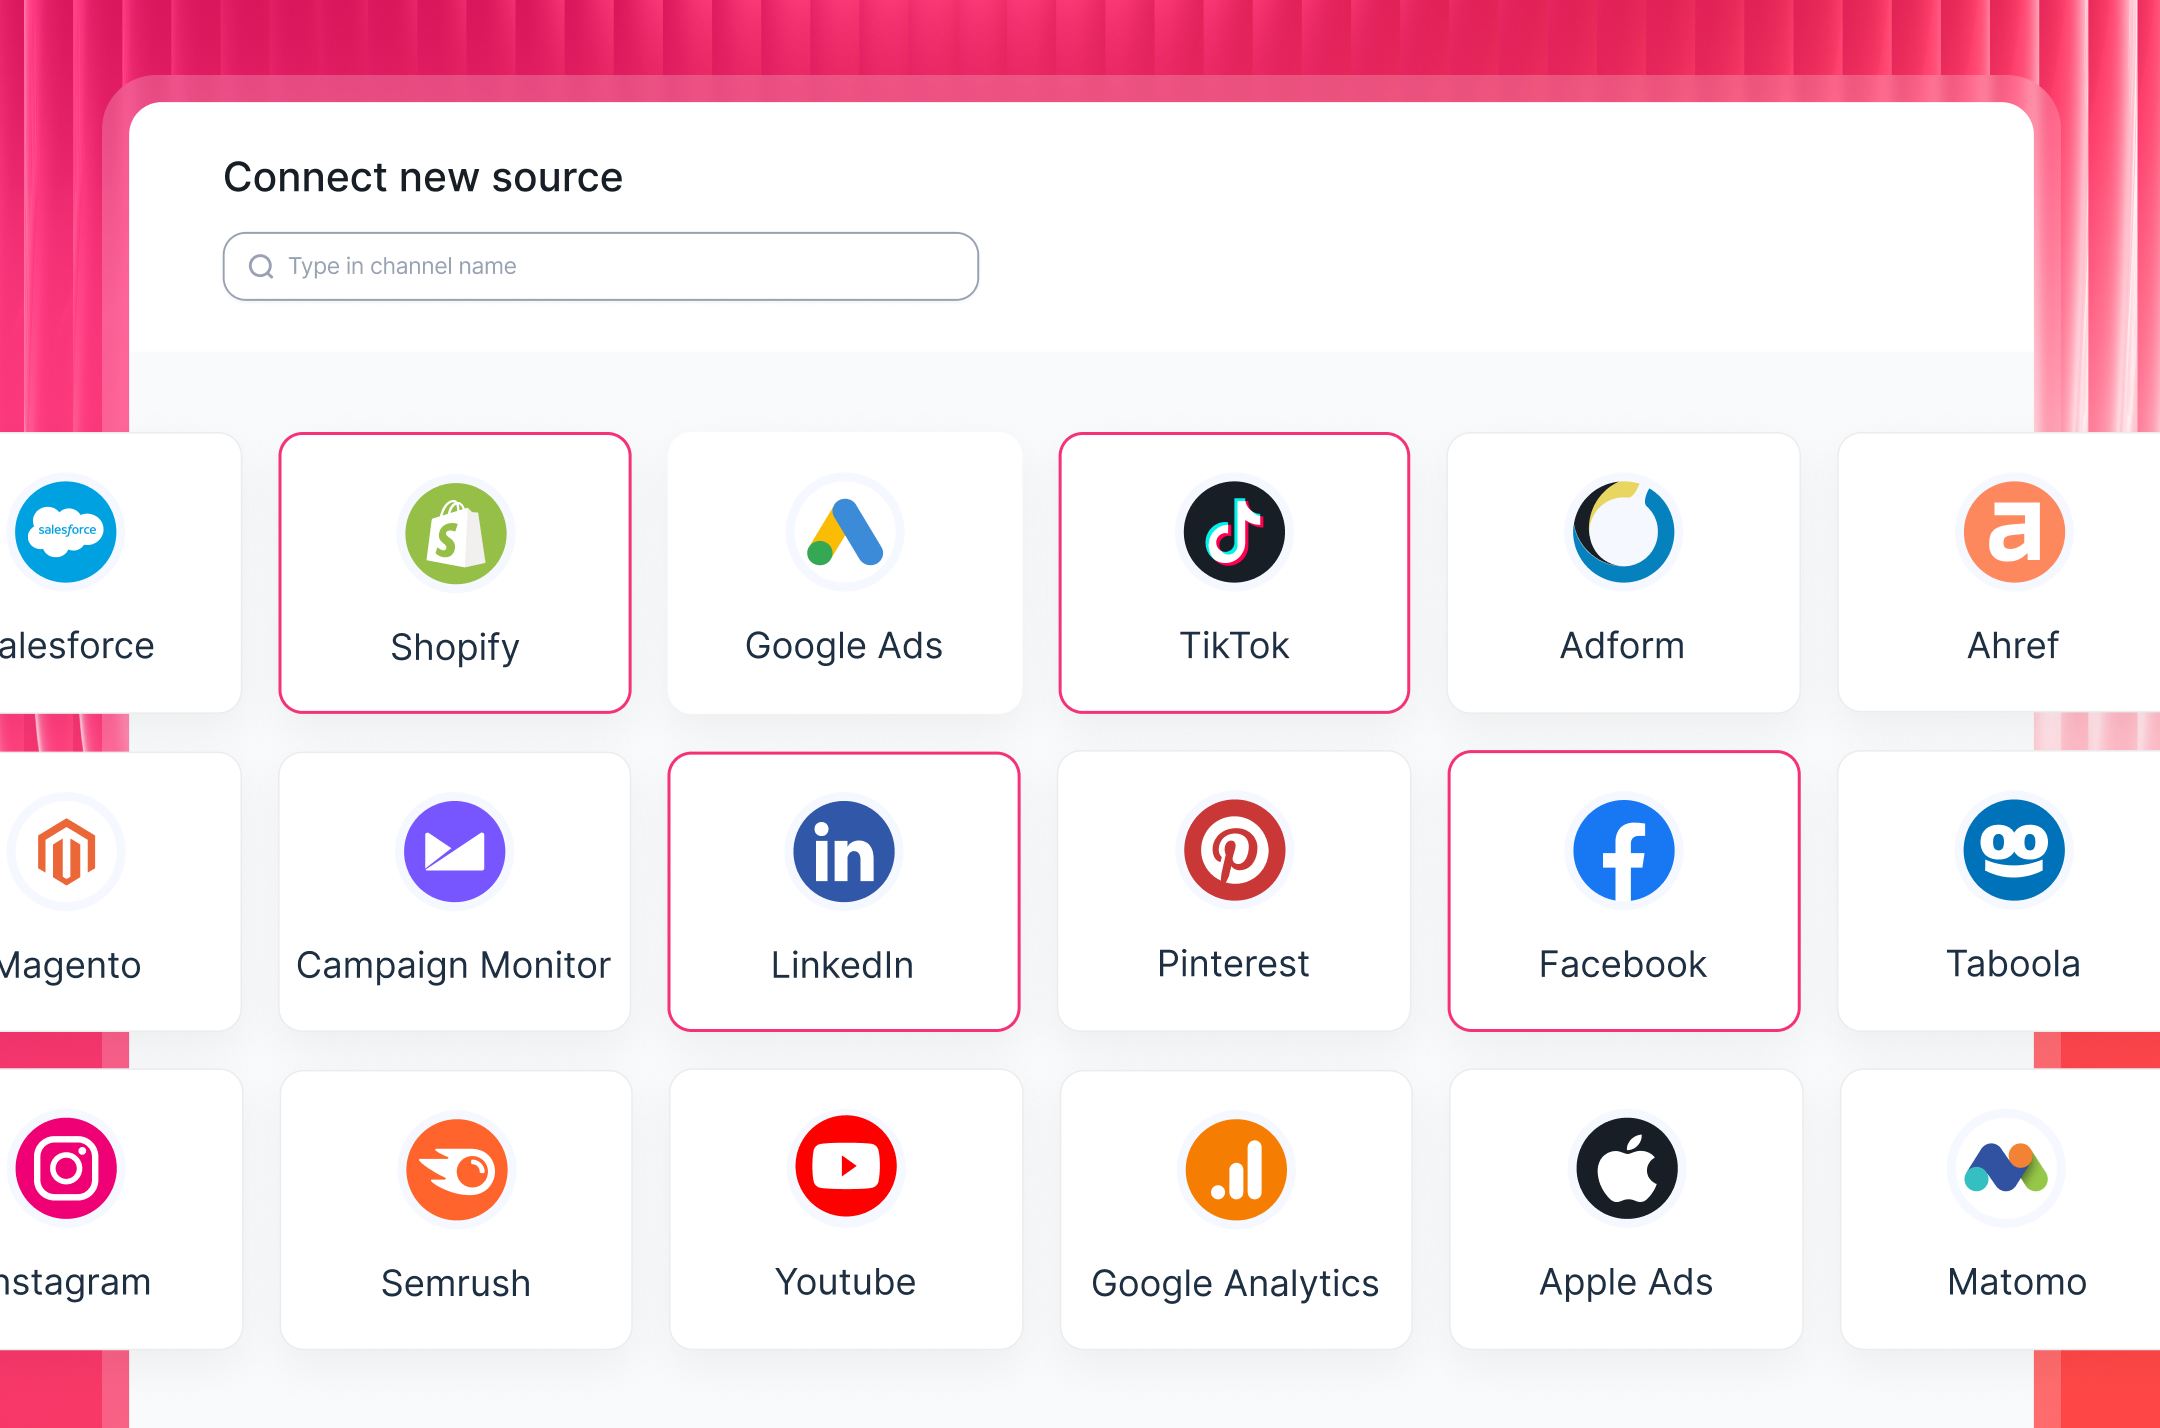
From your Whatagraph workspace, search for Shopify, authenticate with your store credentials, and your data starts flowing in.
No developers, no API setup, no third-party connectors.
Want to pull in Google Ads or Meta Ads alongside it? Add those too - it takes the same amount of effort.
Whatagraph’s integrations cover:
- Ecommerce: BigCommerce, WooCommerce, Magento
- Social: Instagram, Facebook, TikTok, LinkedIn, YouTube
- Paid ads: Google Ads, Meta Ads, TikTok Ads, LinkedIn Ads, Pinterest Ads
- Analytics: Google Analytics 4, Adobe Analytics, Matomo
- SEO: Semrush, Ahrefs, SE Ranking, Google Search Console
- Email: Klaviyo, Mailchimp, ActiveCampaign, Constant Contact
Whatagraph's integrations have averaged 99.95% uptime over the past six months. Your data is there when you need it.
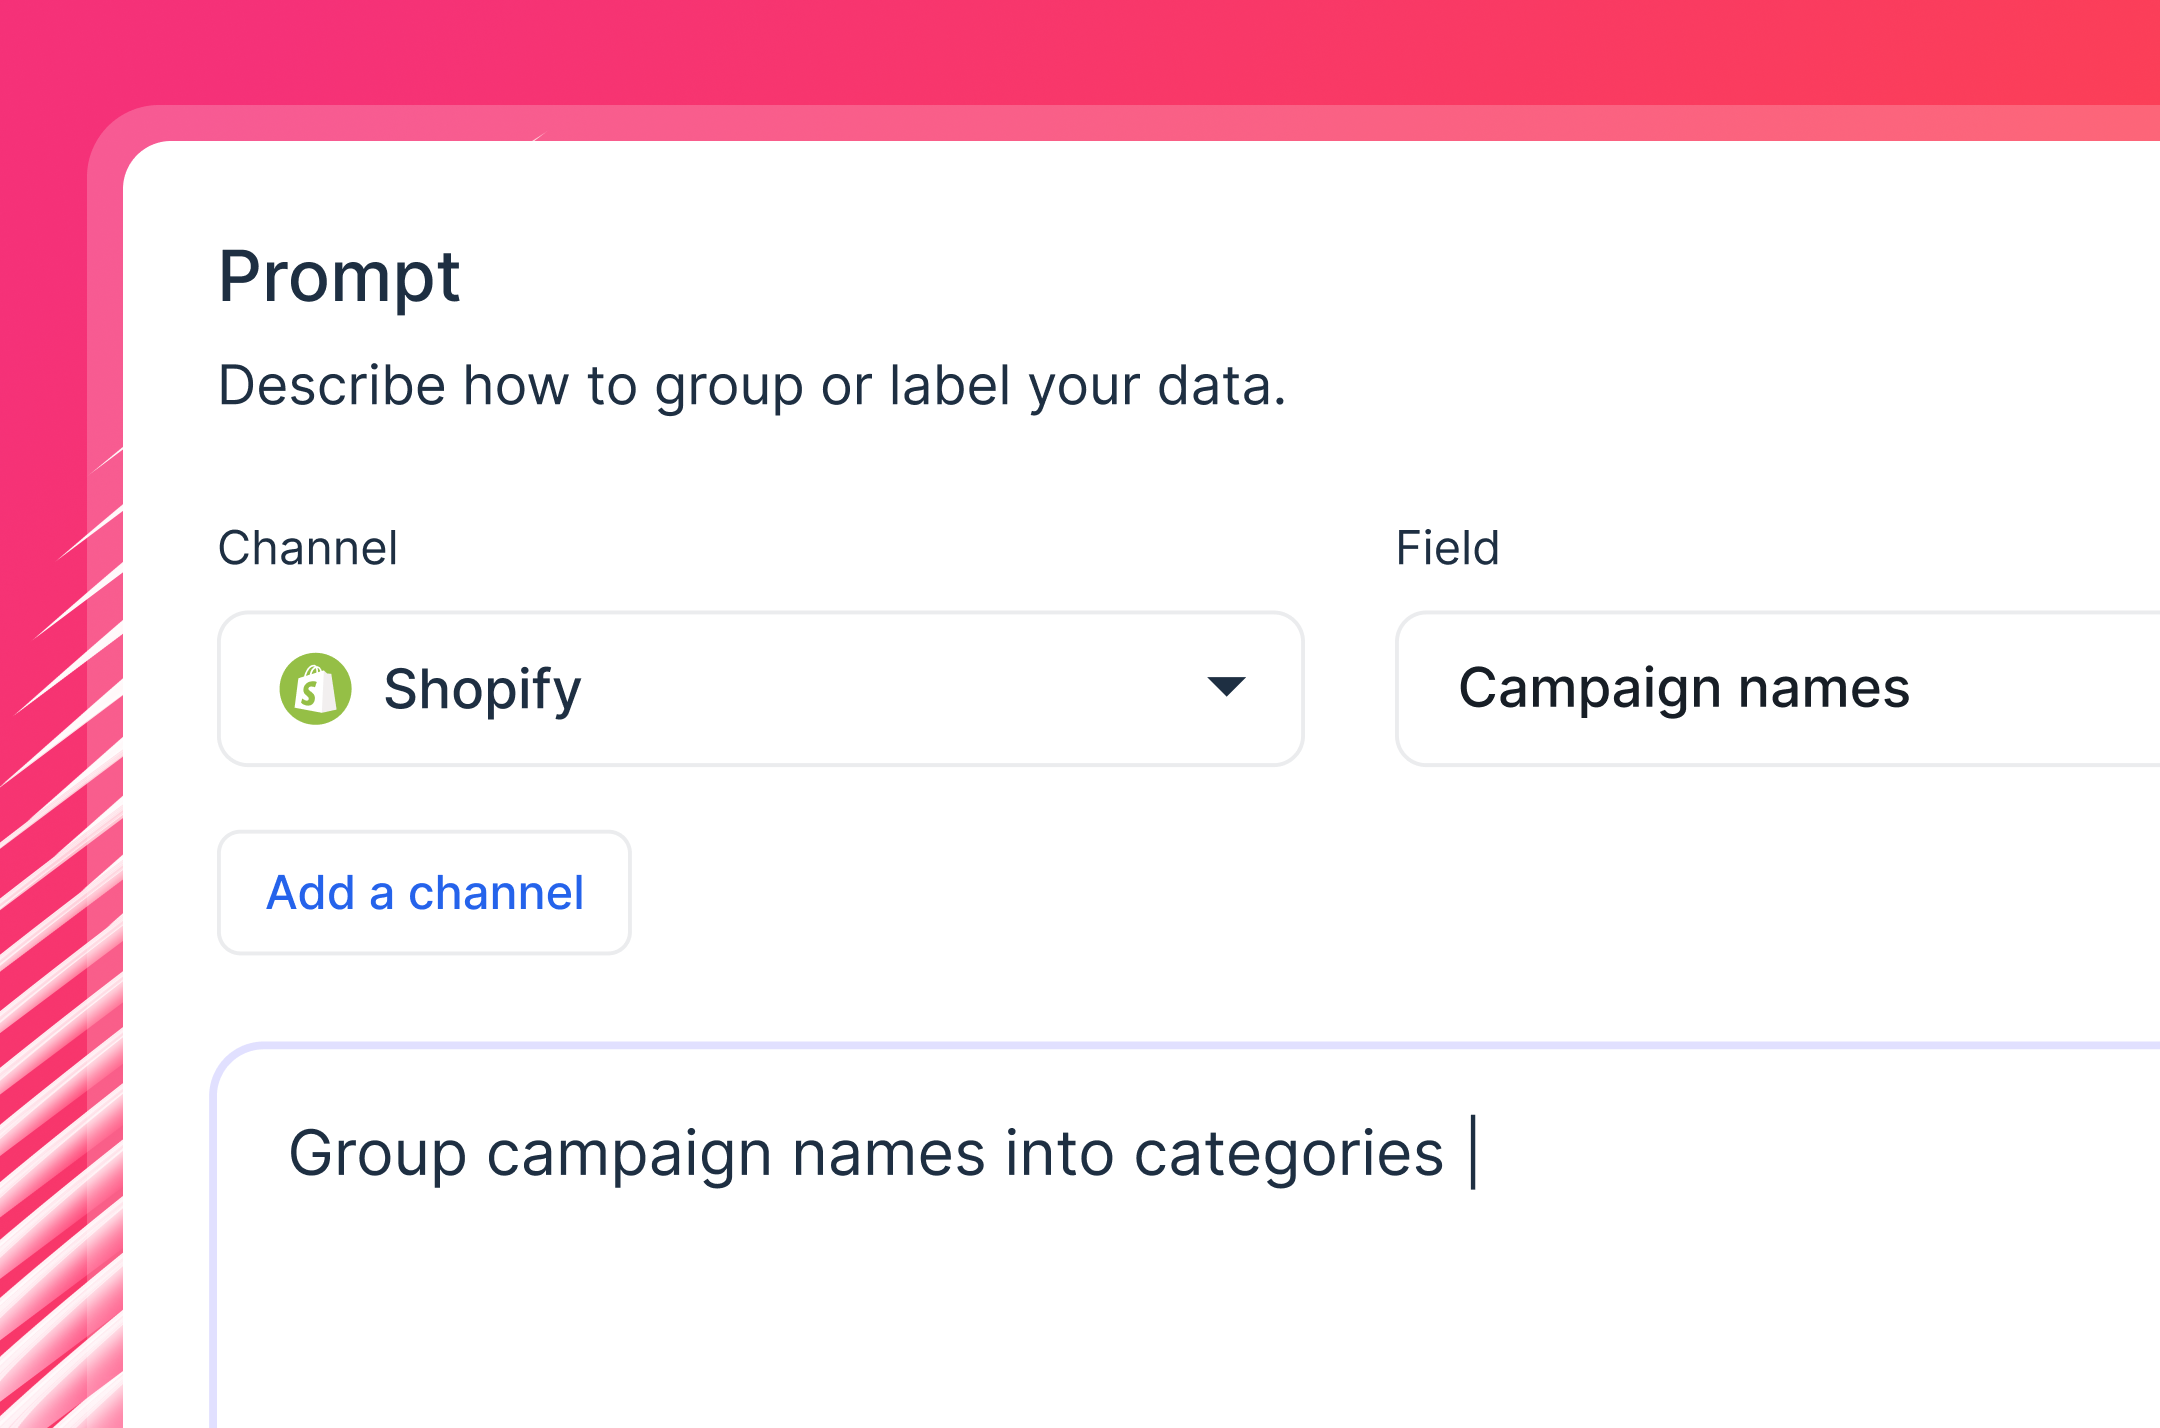
2. Organize and blend your Shopify data
Once your data is connected, clean it up so it actually makes sense to clients.
Standardize campaign naming, align currencies, and structure everything around the metrics that matter for that specific account.
With Whatagraph, you can:
- Blend Shopify revenue data with ad spend from Google, Meta, TikTok, and more
- Group products, campaigns, or channels by any dimension you choose
- Filter by date range, device, geography, or custom segments
- Apply tags to organize reports by client, account manager, or region
Want to define a custom dimension but don't want to build it from scratch? Just describe it to IQ Dimensions, and it builds the blend for you. No coding, no manual calculation.
Organizing data is especially important if you combine Shopify data with data from other channels in your reports. Without well-structured data, cross-channel reporting can turn into a mess.
As Chris Coussons, Founder of Visionary Marketing, puts it:
Cross-channel reporting is one of those things that can either be very useful or the total opposite, filled with numbers that many don't understand. The key is simplicity with depth.
3. Build your Shopify report
This is where Whatagraph IQ saves the most time. Instead of dragging and dropping widgets one by one, you tell IQ what kind of Shopify report you need - and it builds the full thing. Charts, KPI tiles, tabs, graphs, layouts, all of it.
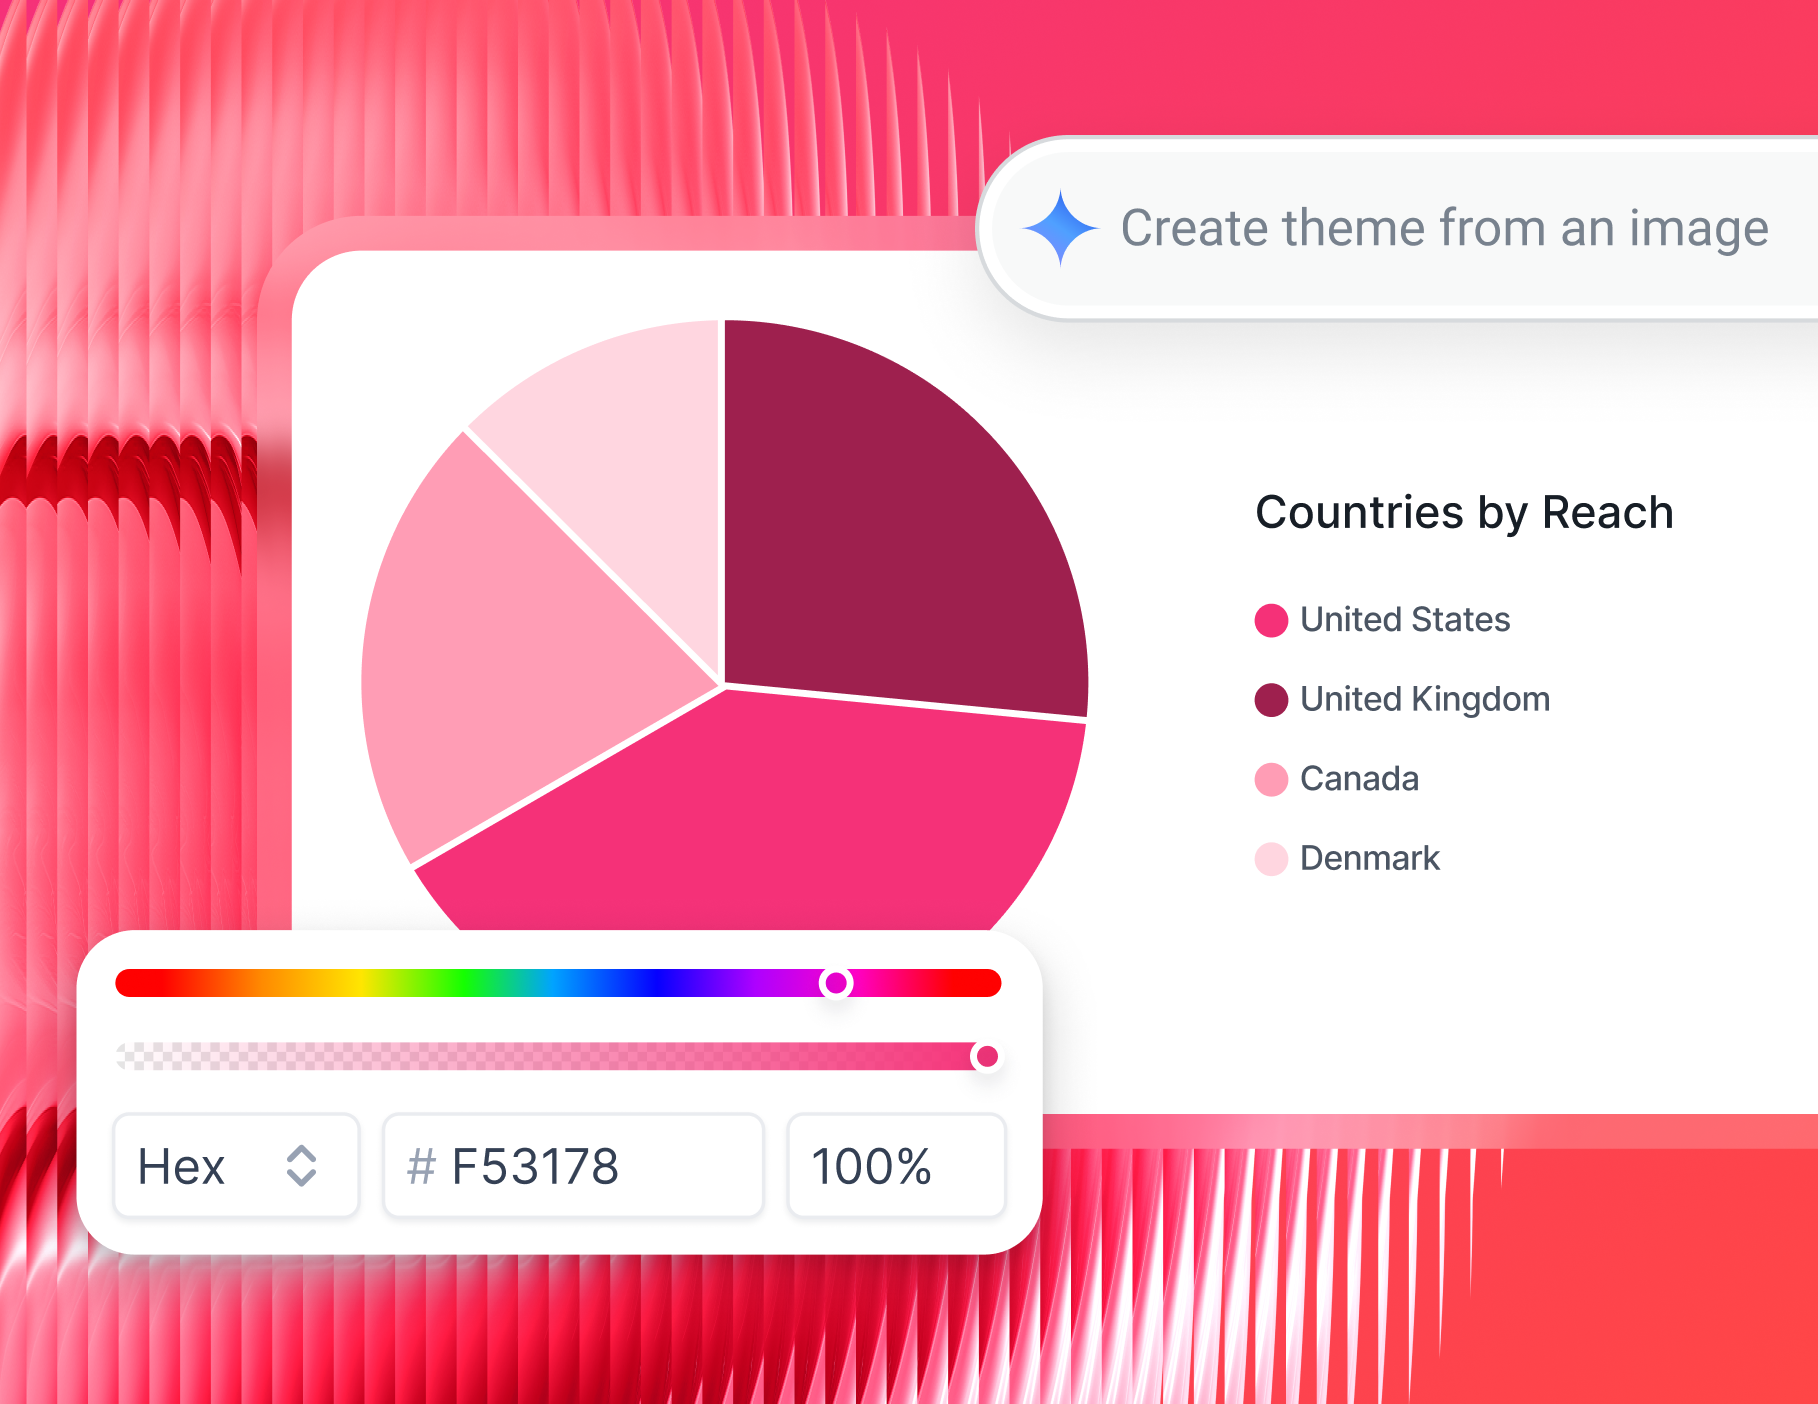
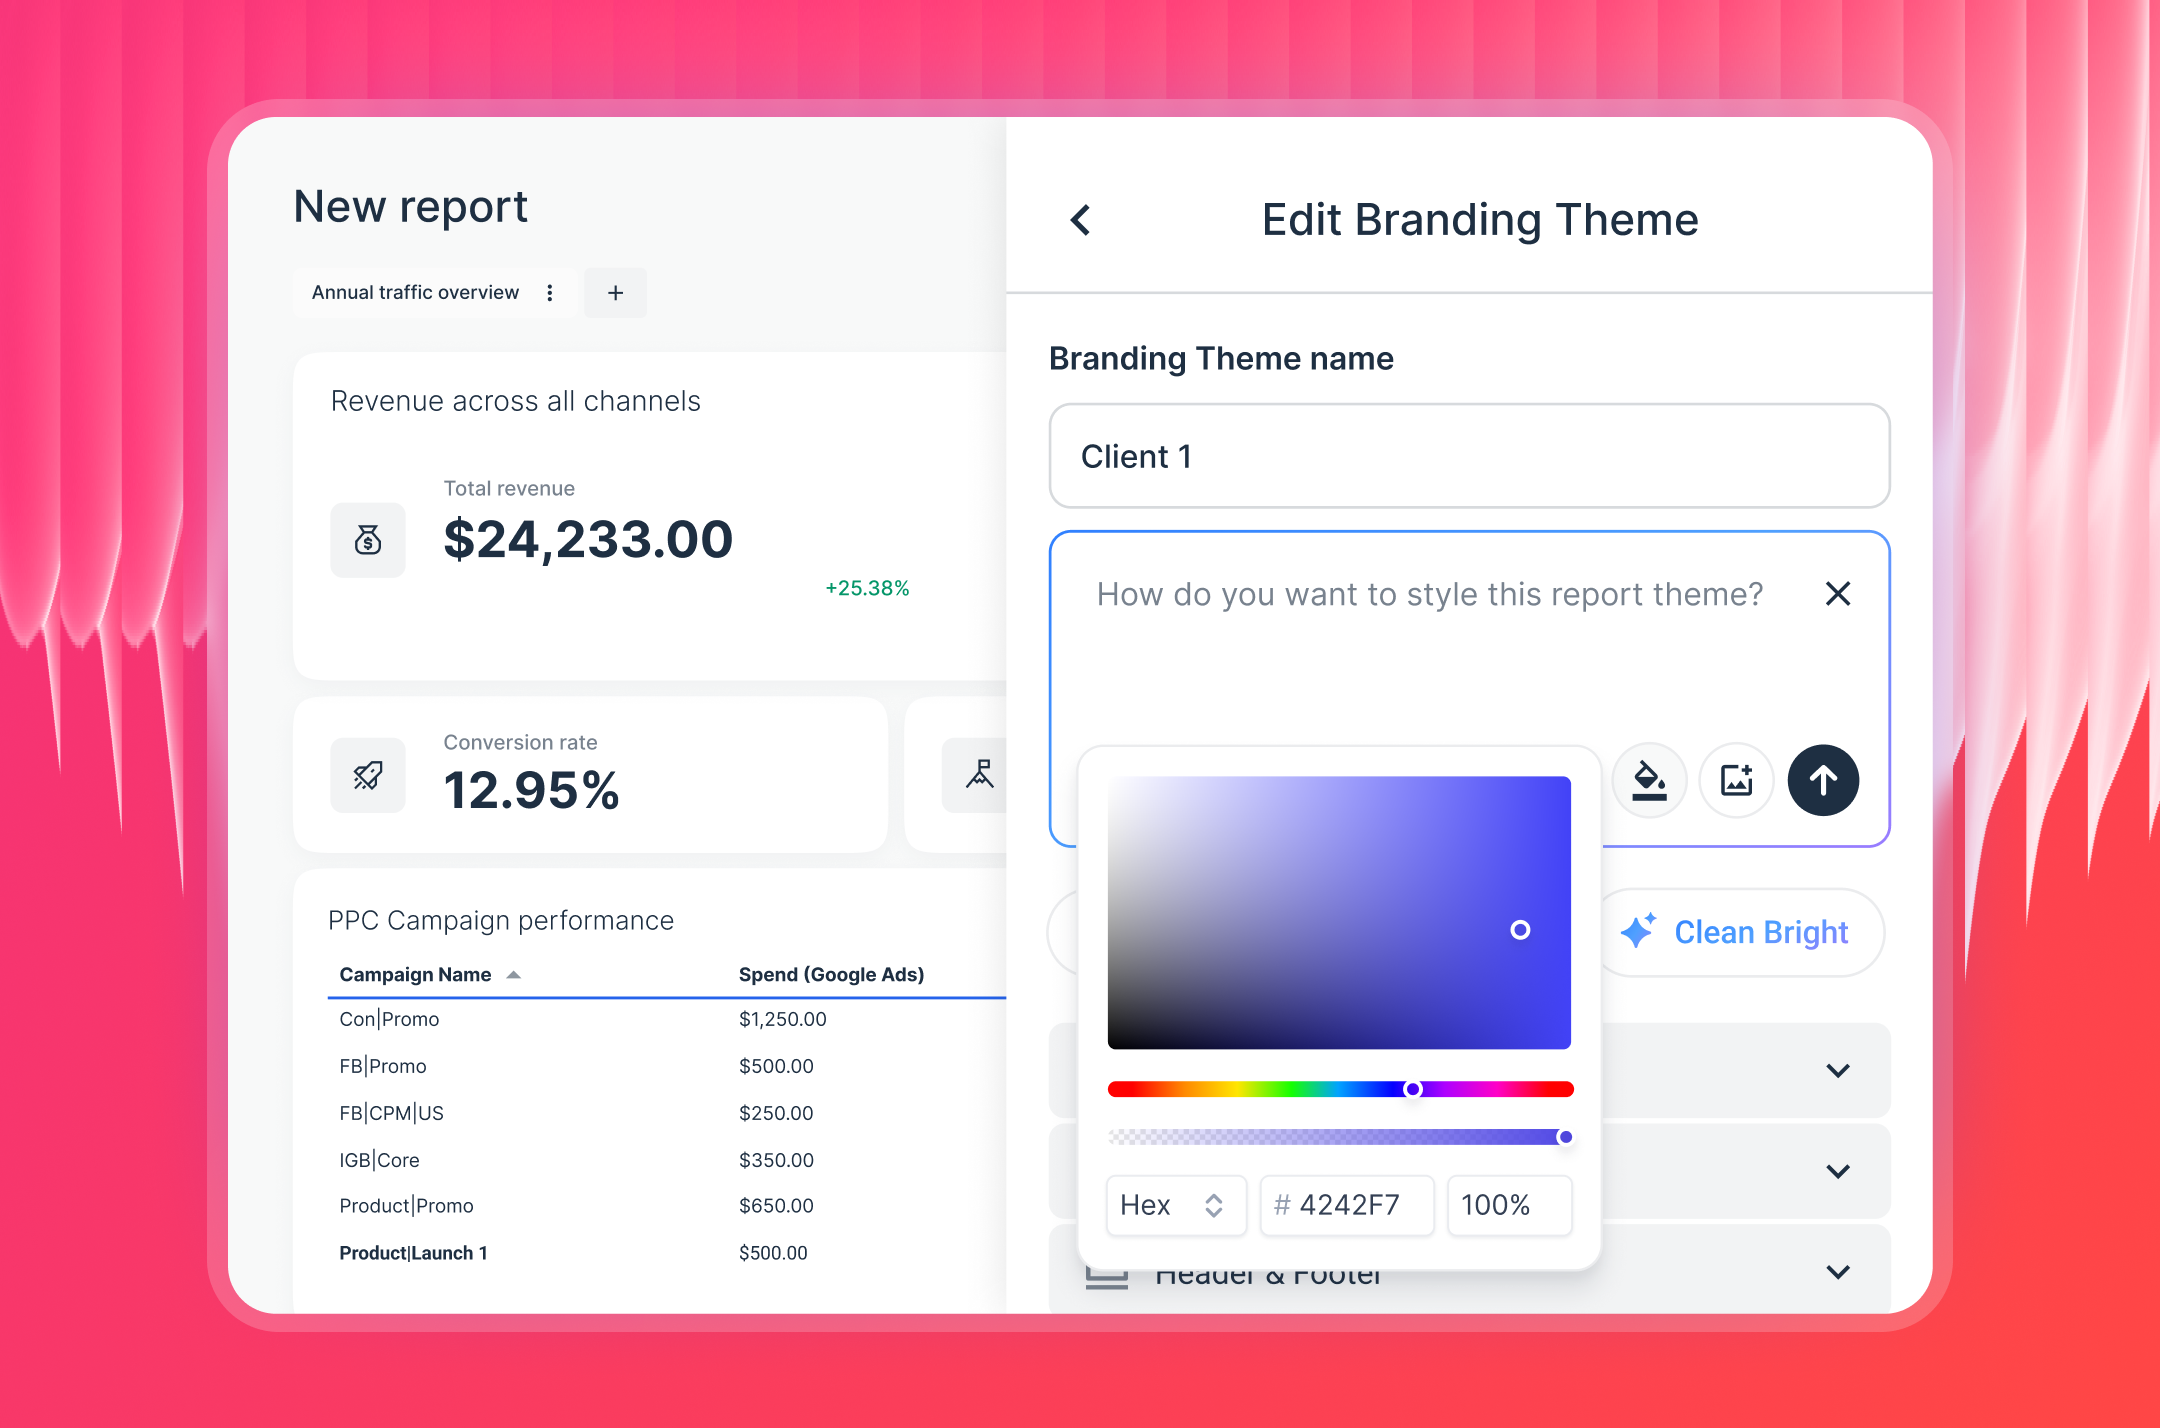
Want it branded to your client? Upload their logo or paste in their brand colors, and IQ Themes applies the styling automatically - fonts, HEX codes, and icons included.
Prefer to drag-and-drop each widget manually? Start from a blank canvas and customize every widget exactly how you want it.
With each widget, you can:
- Adjust labels, sizing, and layout
- Apply custom formulas to any metric
- Set specific date ranges or comparison periods
- Show or hide sections depending on the audience
Pro tip: once you've built a report structure you like, save it as a linked template. Edit the master once, and every connected client report updates automatically.
4. Track store performance with an internal Shopify analytics dashboard
Client reports tell clients what they need to know. But your team needs a different view - one that shows all accounts at once, flags what's off-track, and helps account managers walk into every meeting prepared.
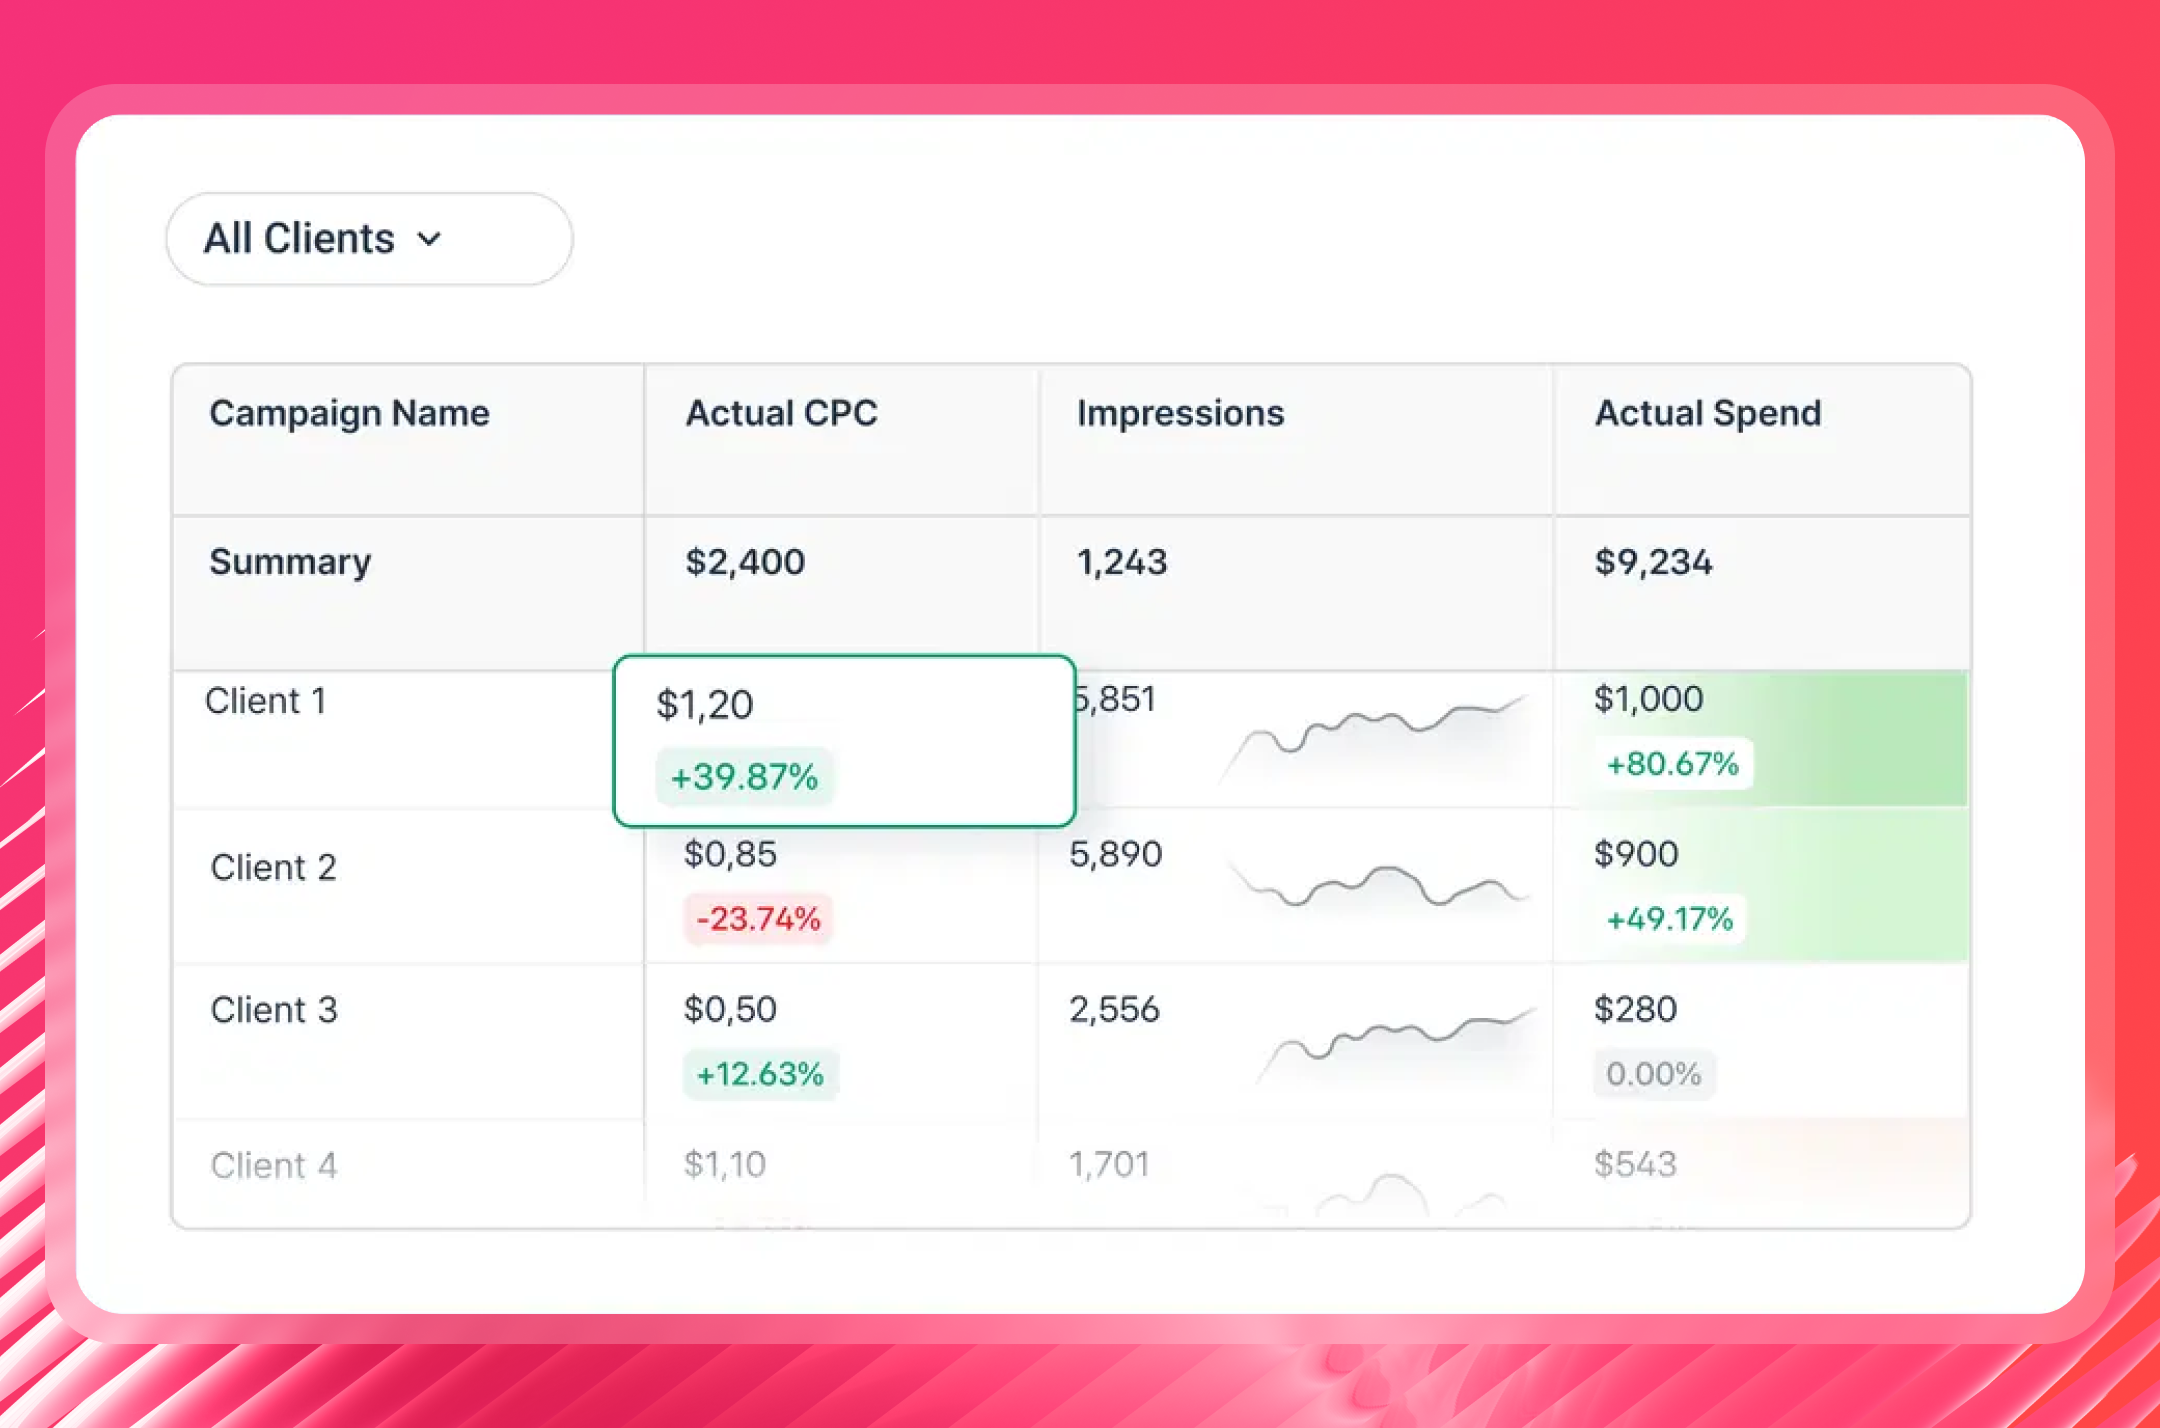
Whatagraph's Overviews give you exactly that. Use them to:
- Monitor Shopify KPIs across all ecommerce clients in one place
- Set spend caps or conversion goals and get alerted when something goes off-track
- Give account managers a clear view of every client's performance before calls
- Slice by channel, region, client, or manager - whatever your team's structure requires
The overview is the easiest for our internal way of working. Our Account Managers don’t have to ask me for KPIs anymore—they just grab the link and send it to the client quickly without my help. It’s just quicker and easier. - Tanja Keglić, Performance Marketing Manager at Achtzehn Grad
5. Add AI-written summaries to your Shopify sales report
Clients don't want to interpret charts on their own. They want to open a report and immediately understand what happened, what it means, and what comes next.
As Janet Mesh, CEO of Aimtal, says:
One of the biggest mistakes that marketers make when creating reports is just adding screenshots of performance charts without any context or analysis. Your role is to be a non-fiction storyteller.
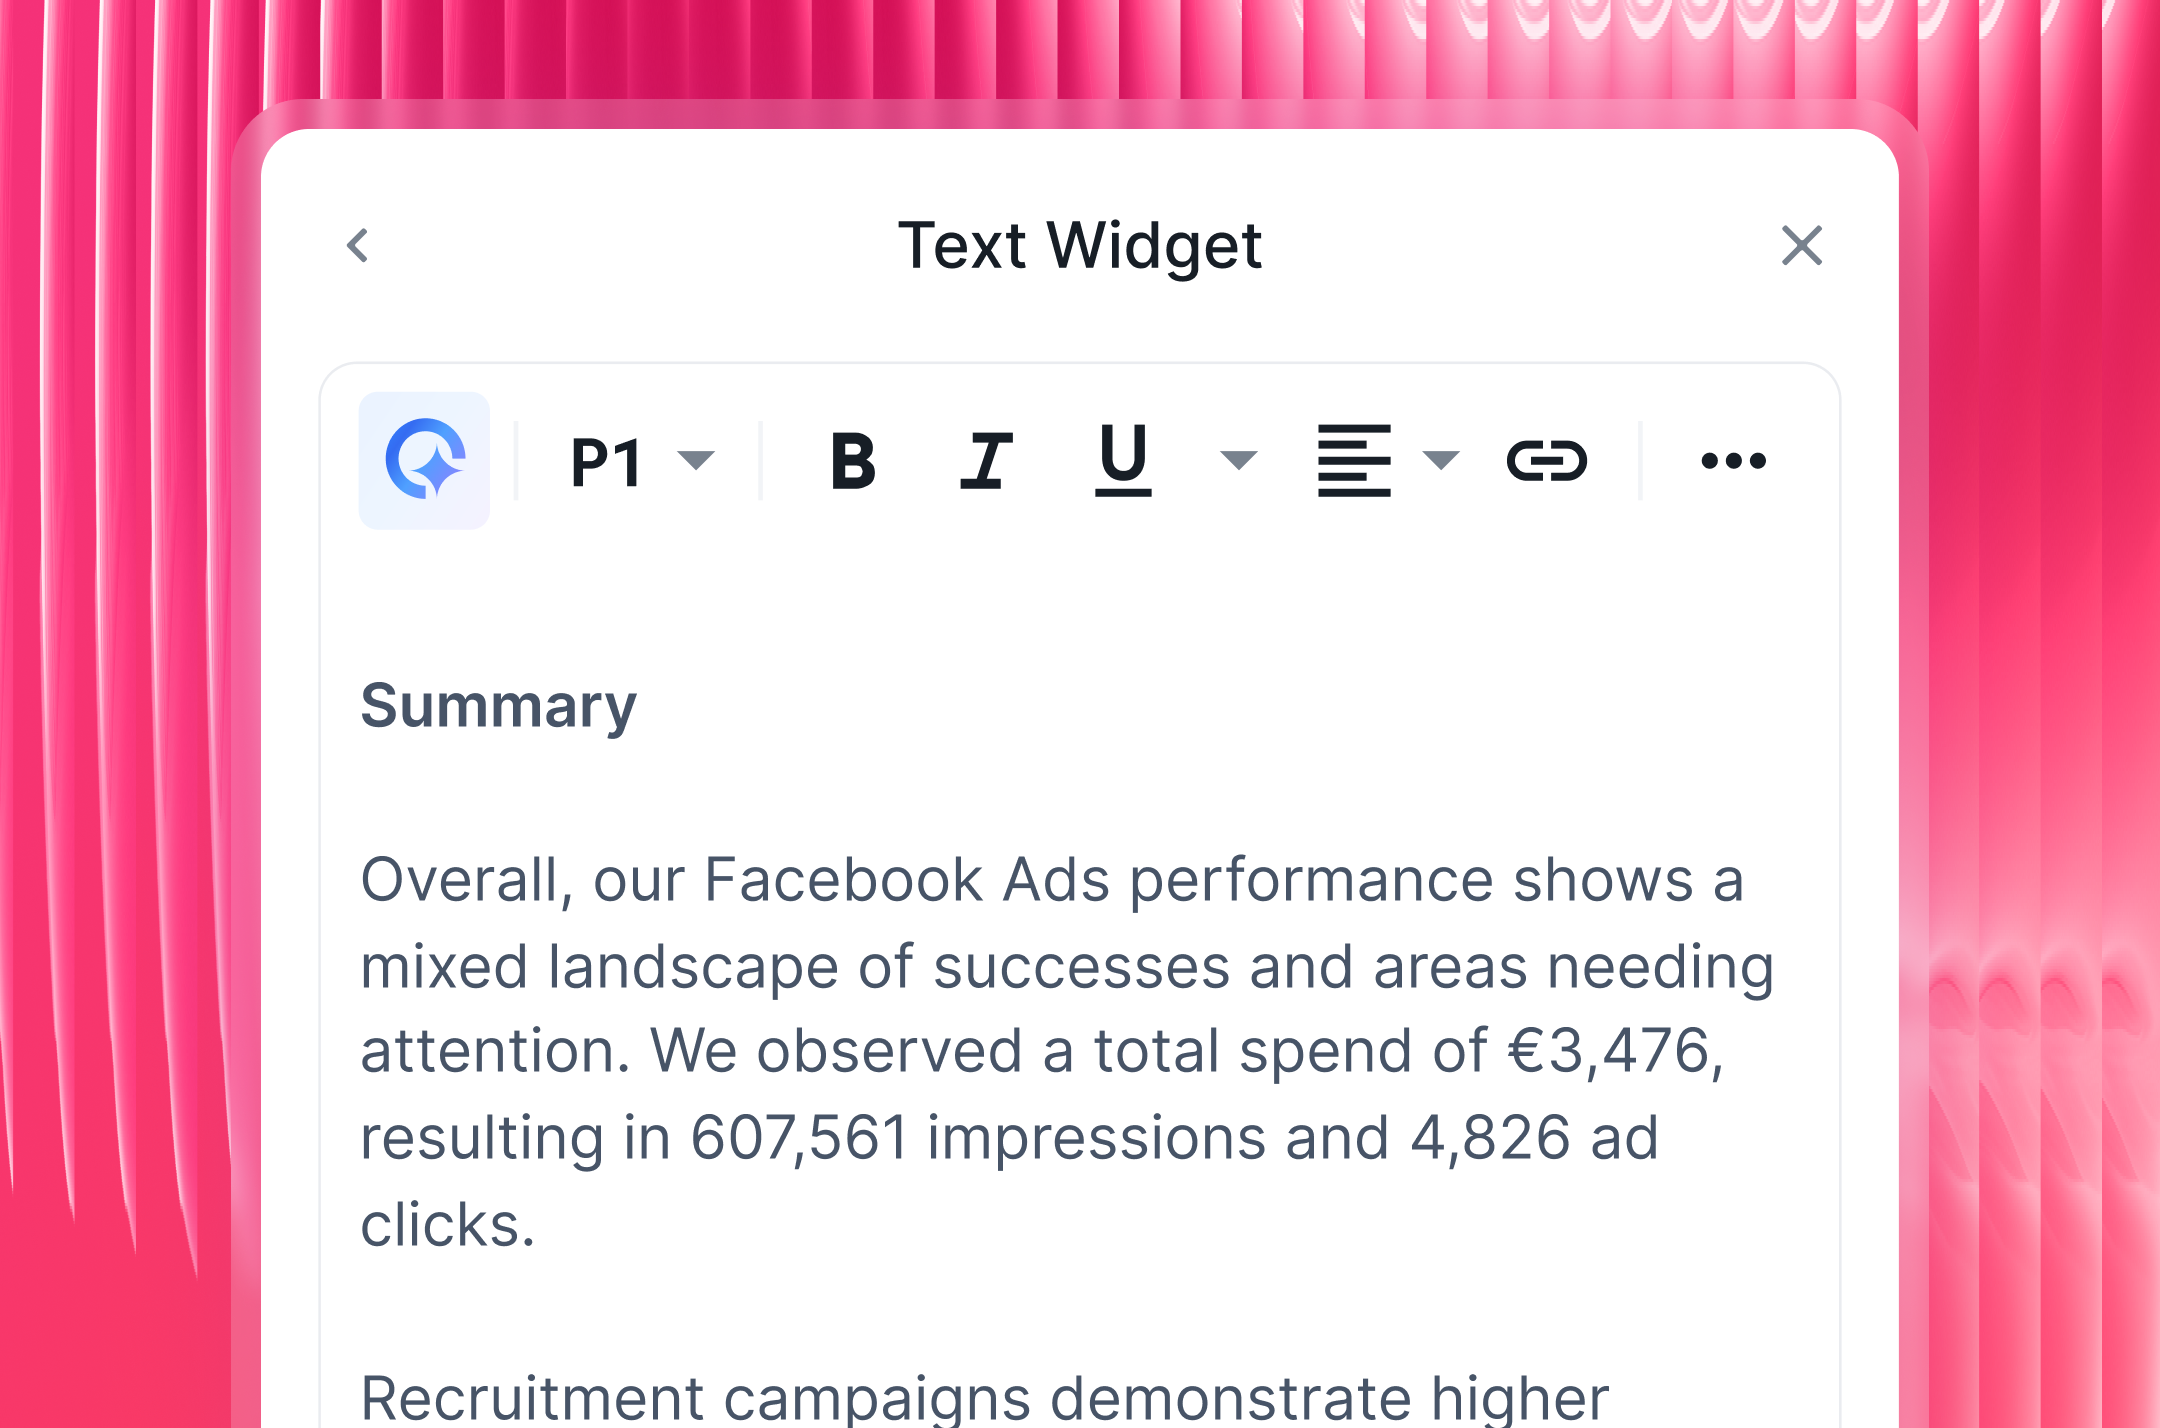
This is exactly what IQ Summaries helps with. Instead of writing summaries entirely from scratch, IQ reads the data in your report and writes a plain-language performance recap directly inside it.
Choose short or long format, adjust the tone, add your own context - then send it. No writing from scratch, no generic commentary.
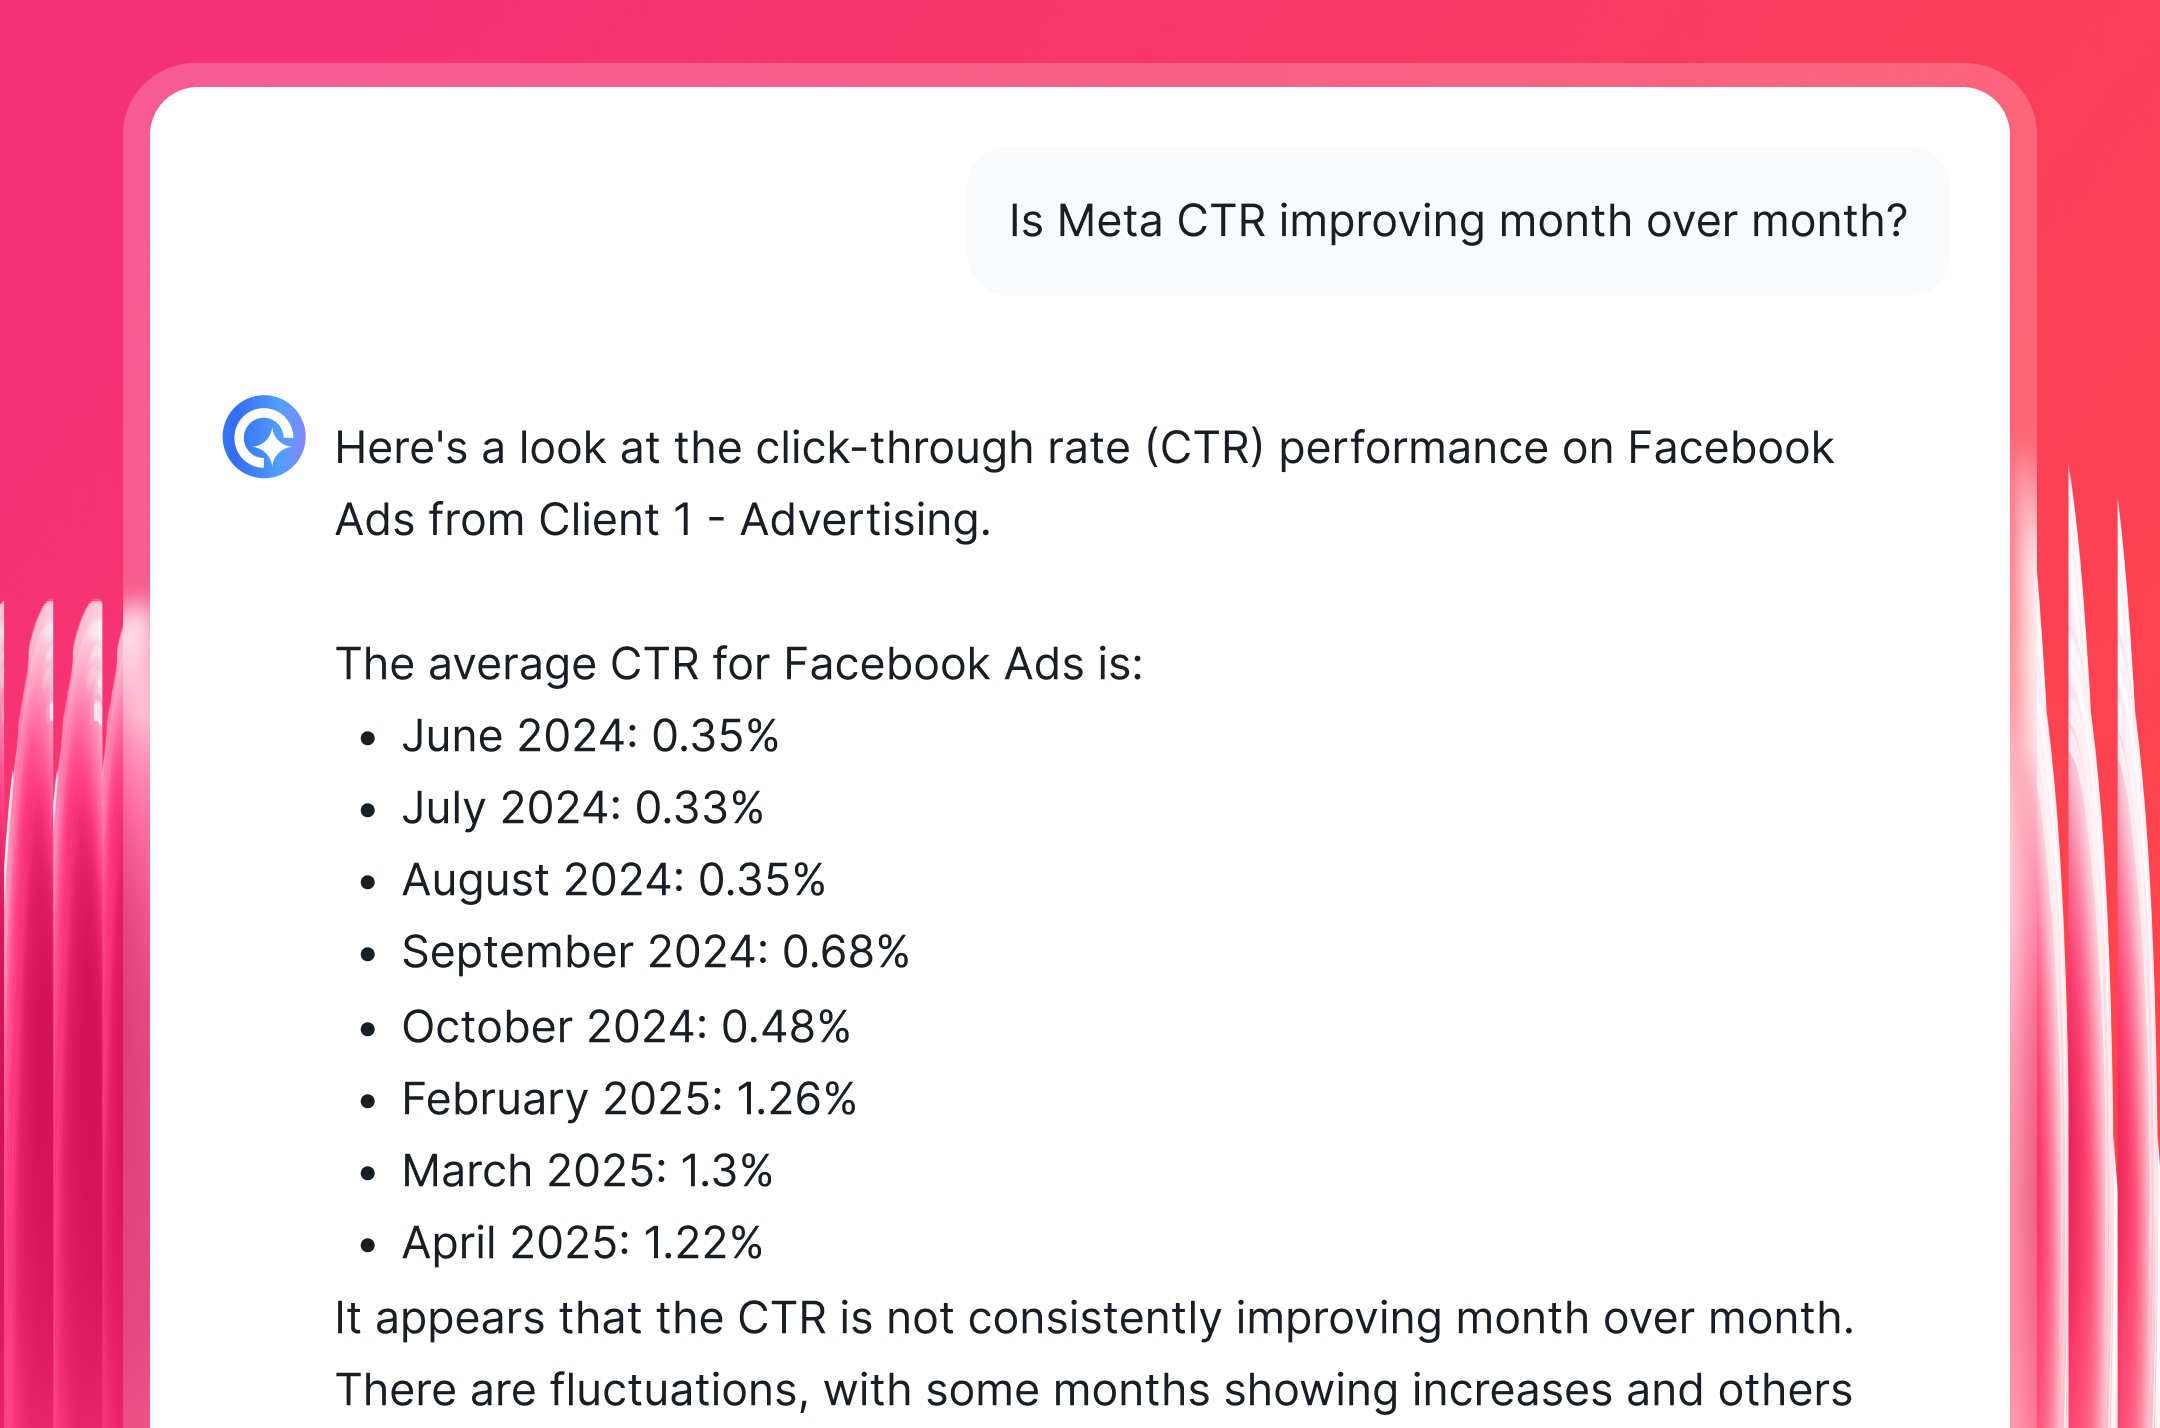
Your internal team can also use IQ Chat to ask direct questions about any client's Shopify data - "Which products drove the most revenue last week?" or "What was the conversion rate from Google Shopping?" - and get back an immediate answer, in plain English.
IQ Chat also extends directly to your clients. Turn it on for any live report link, and clients can ask questions about the data without needing to email you for answers.
Danielle Roberts, Director of Support from Rentable, has found this extremely useful:
Whatagraph’s AI cuts down the time our customers have to analyze reports. Say I send a report to a customer, but they don’t really understand it, they can just ask a question, and Whatagraph spits out answers to them right away.
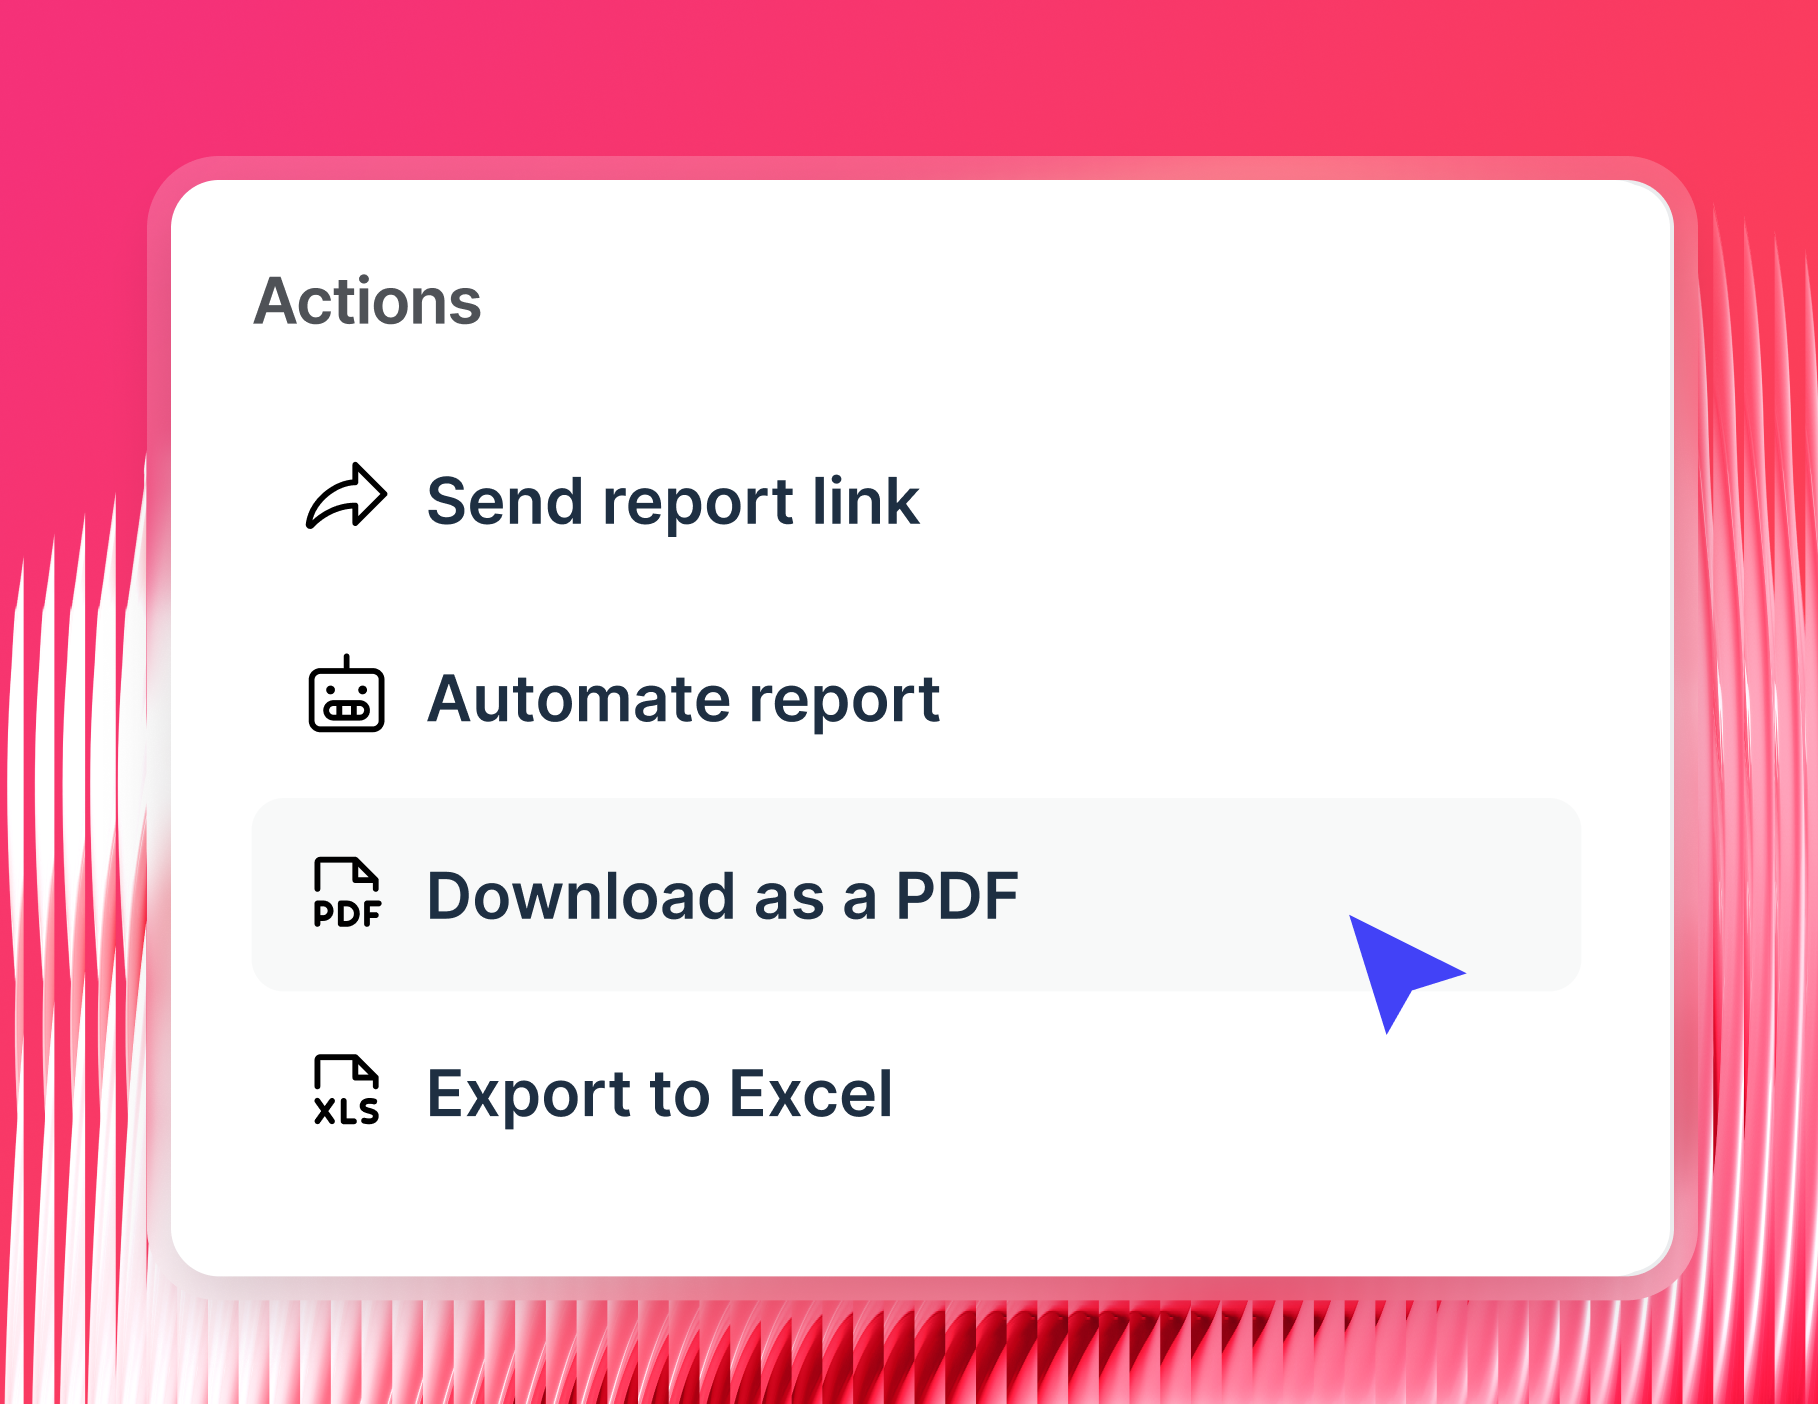
6. Share the report your way
When your Shopify report is ready, you decide how it goes out:
- Automated email or Slack delivery: Set a schedule - weekly, biweekly, monthly - and reports land in inboxes automatically at the exact time and cadence you choose
- PDF or CSV exports: For presentations, internal archives, or offline sharing
- BigQuery or Looker Studio: Send raw Shopify data downstream for deeper analysis or custom visualization
- Live links: Clients get a link to a live report with real-time data, no login required
Wise Pirates, a full-service digital agency, found that giving clients direct access to their live dashboards saved their team hours of back-and-forth every month.
It’s great that we can share a live link to the dashboard with a client, and the client can basically from their side change the dates and see specific numbers for a specific date. That makes the client a bit more autonomous, which makes our work easier and helps us build better relationships with clients. - André Cardoso, Project and Performance Marketing Manager at Wise Pirates
What Shopify metrics should I include in a marketing report?
Tracking the right Shopify KPIs helps agencies show clients the full picture - not just store activity, but actual business results.
Here are the most important categories to include in any Shopify marketing report.
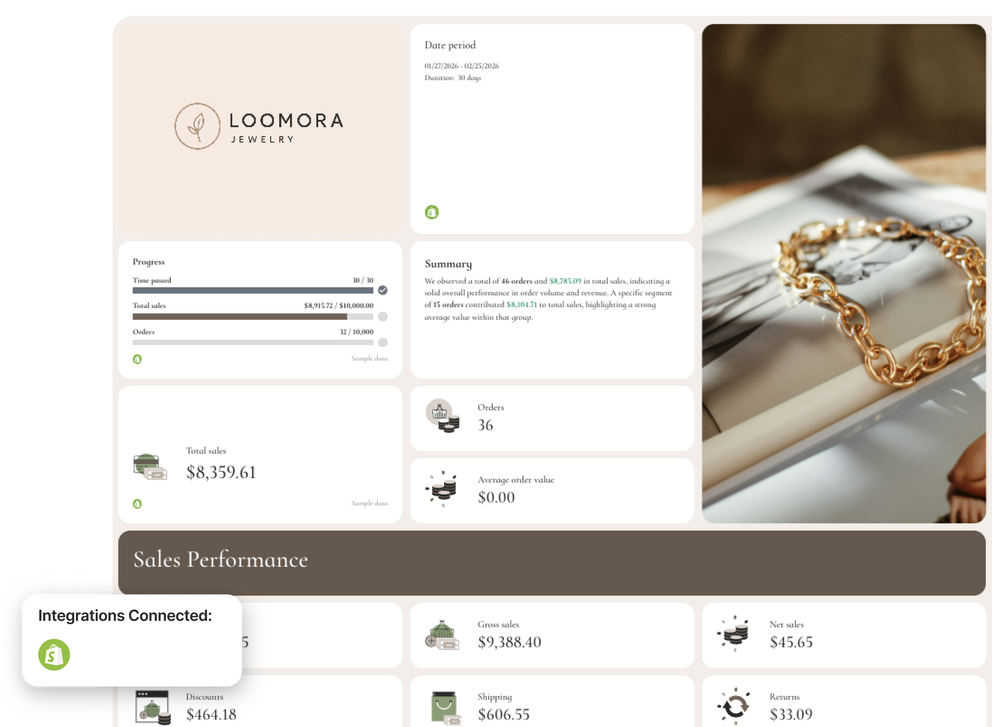
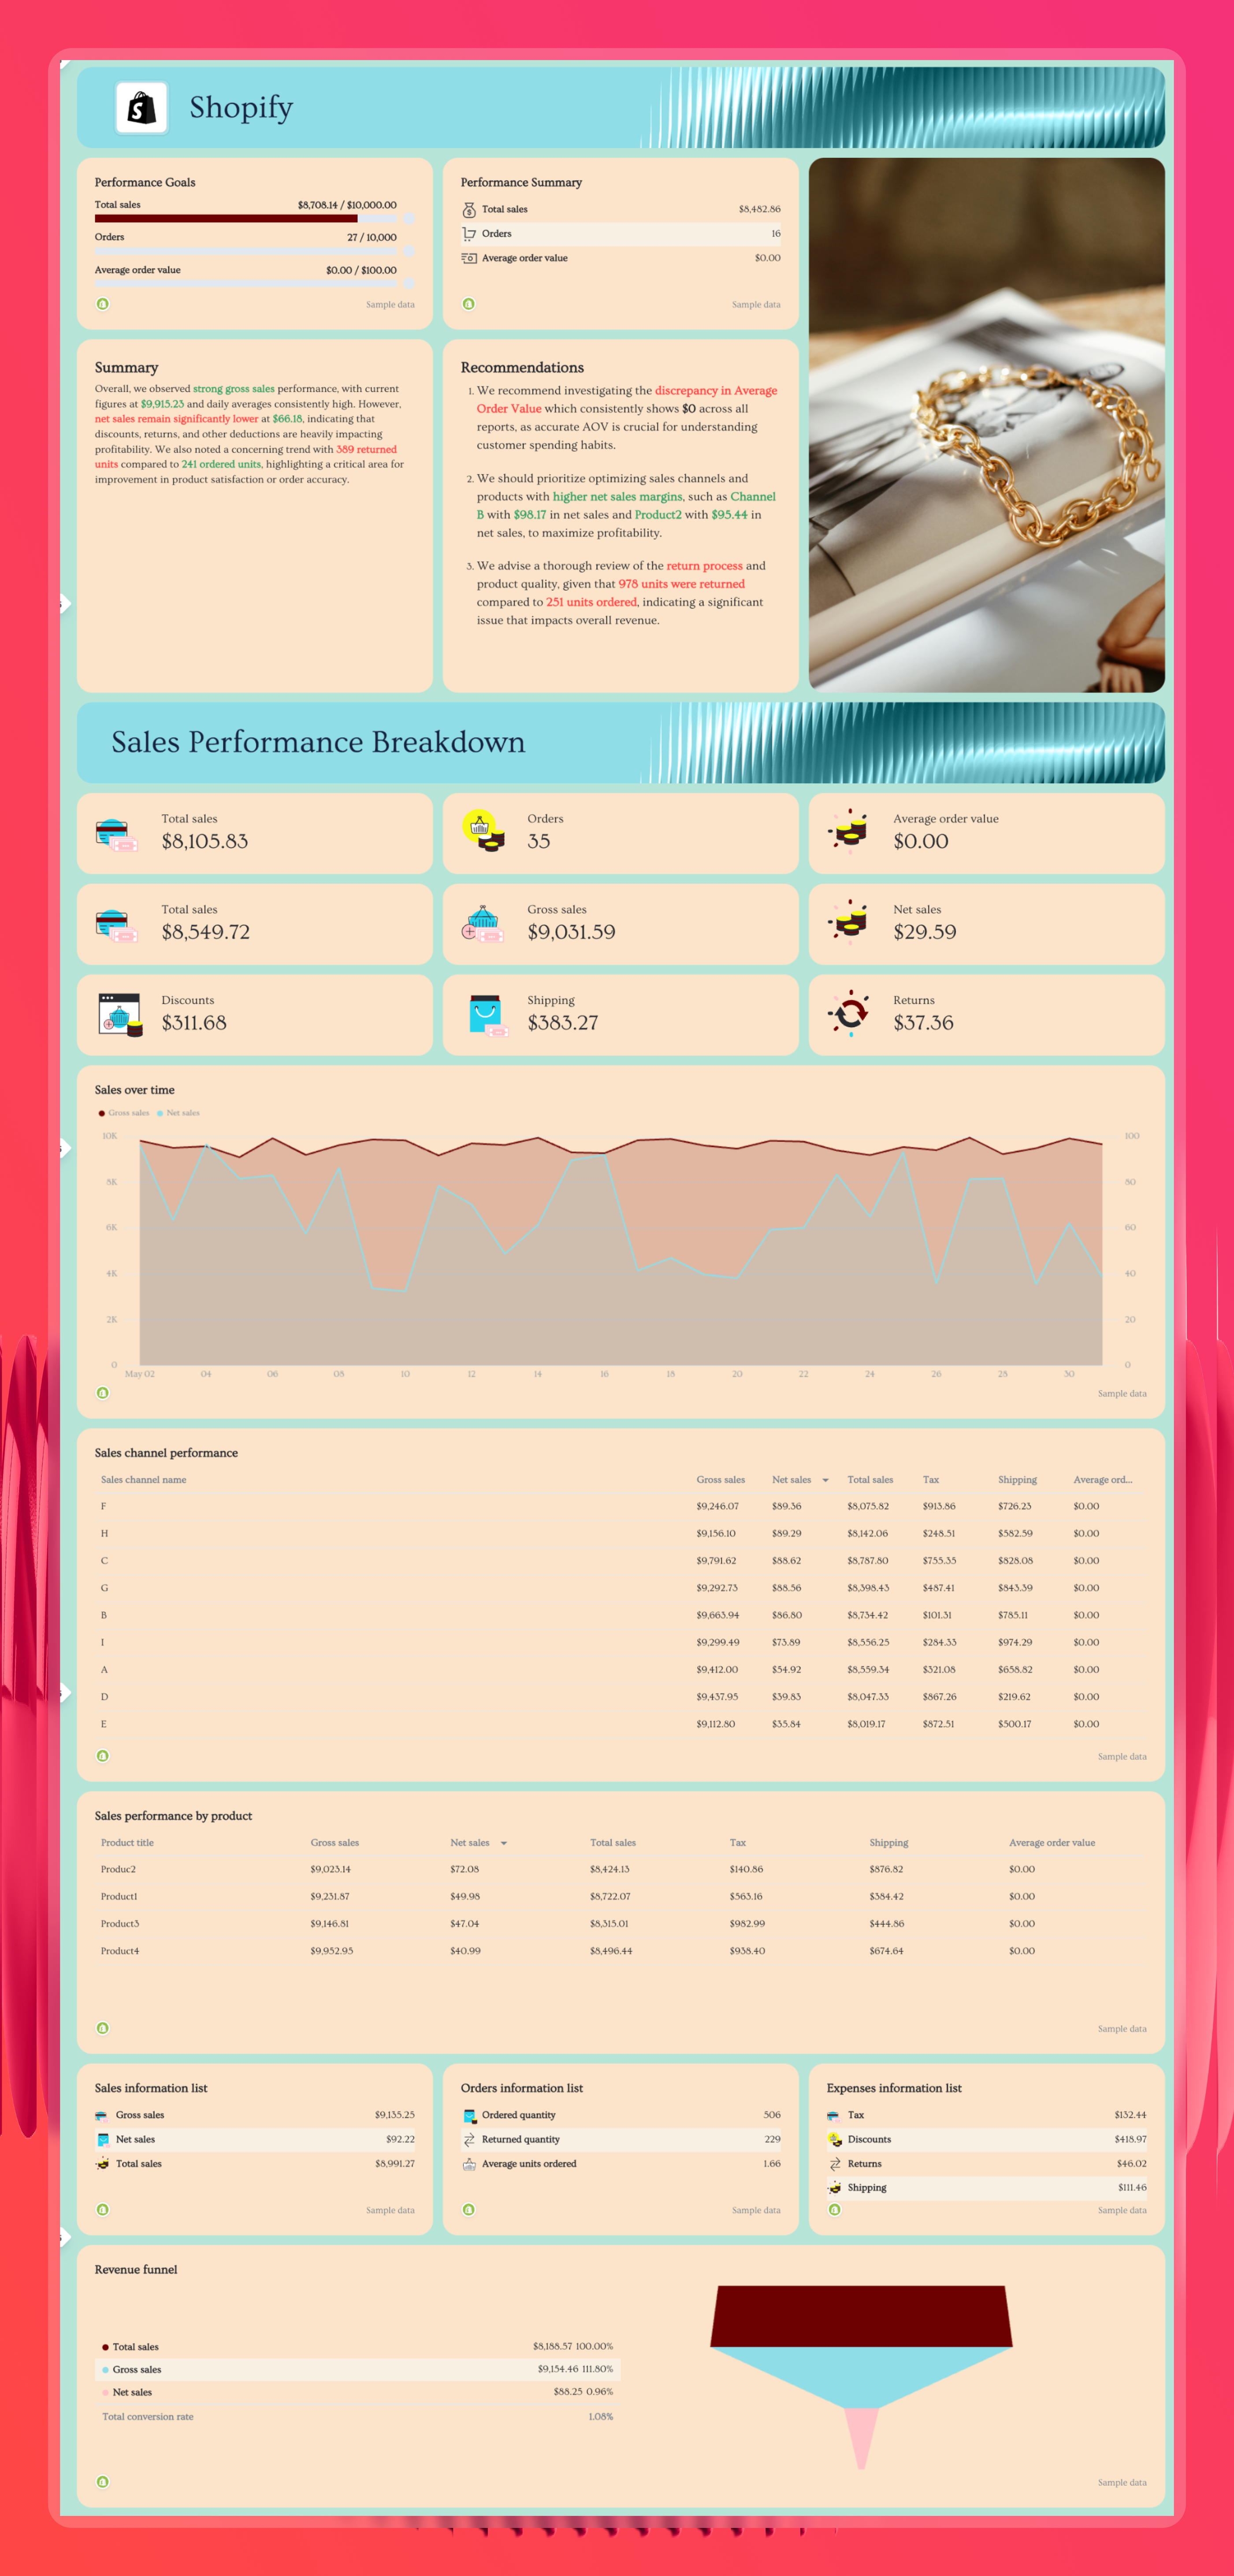
1. Progress and goal tracking
These metrics give clients an at-a-glance read on how the period is going before they dig into anything else.
- Total sales vs. target: Tracks cumulative revenue against the goal set for the period, so clients immediately know if they're on track
- Orders vs. target: The number of completed transactions measured against the expected order volume - a quick check on store momentum
2. Sales performance metrics
These are your core Shopify metrics - the numbers that show how much revenue the store is generating and where it's coming from.
- Gross sales, net sales, and total sales: Gross is revenue before deductions; net removes discounts, returns, and shipping; total sales is the final reported number
- Average order value (AOV): Measures the average spend per transaction. Tracking Shopify AOV trends over time helps spot shifts in buying behavior
- Discounts: The total value of discounts applied across orders - important for understanding how promotions affect margins
- Returns: The value of returned orders - rising return rates can signal product issues or fulfillment problems
- Shipping: Revenue collected from shipping charges
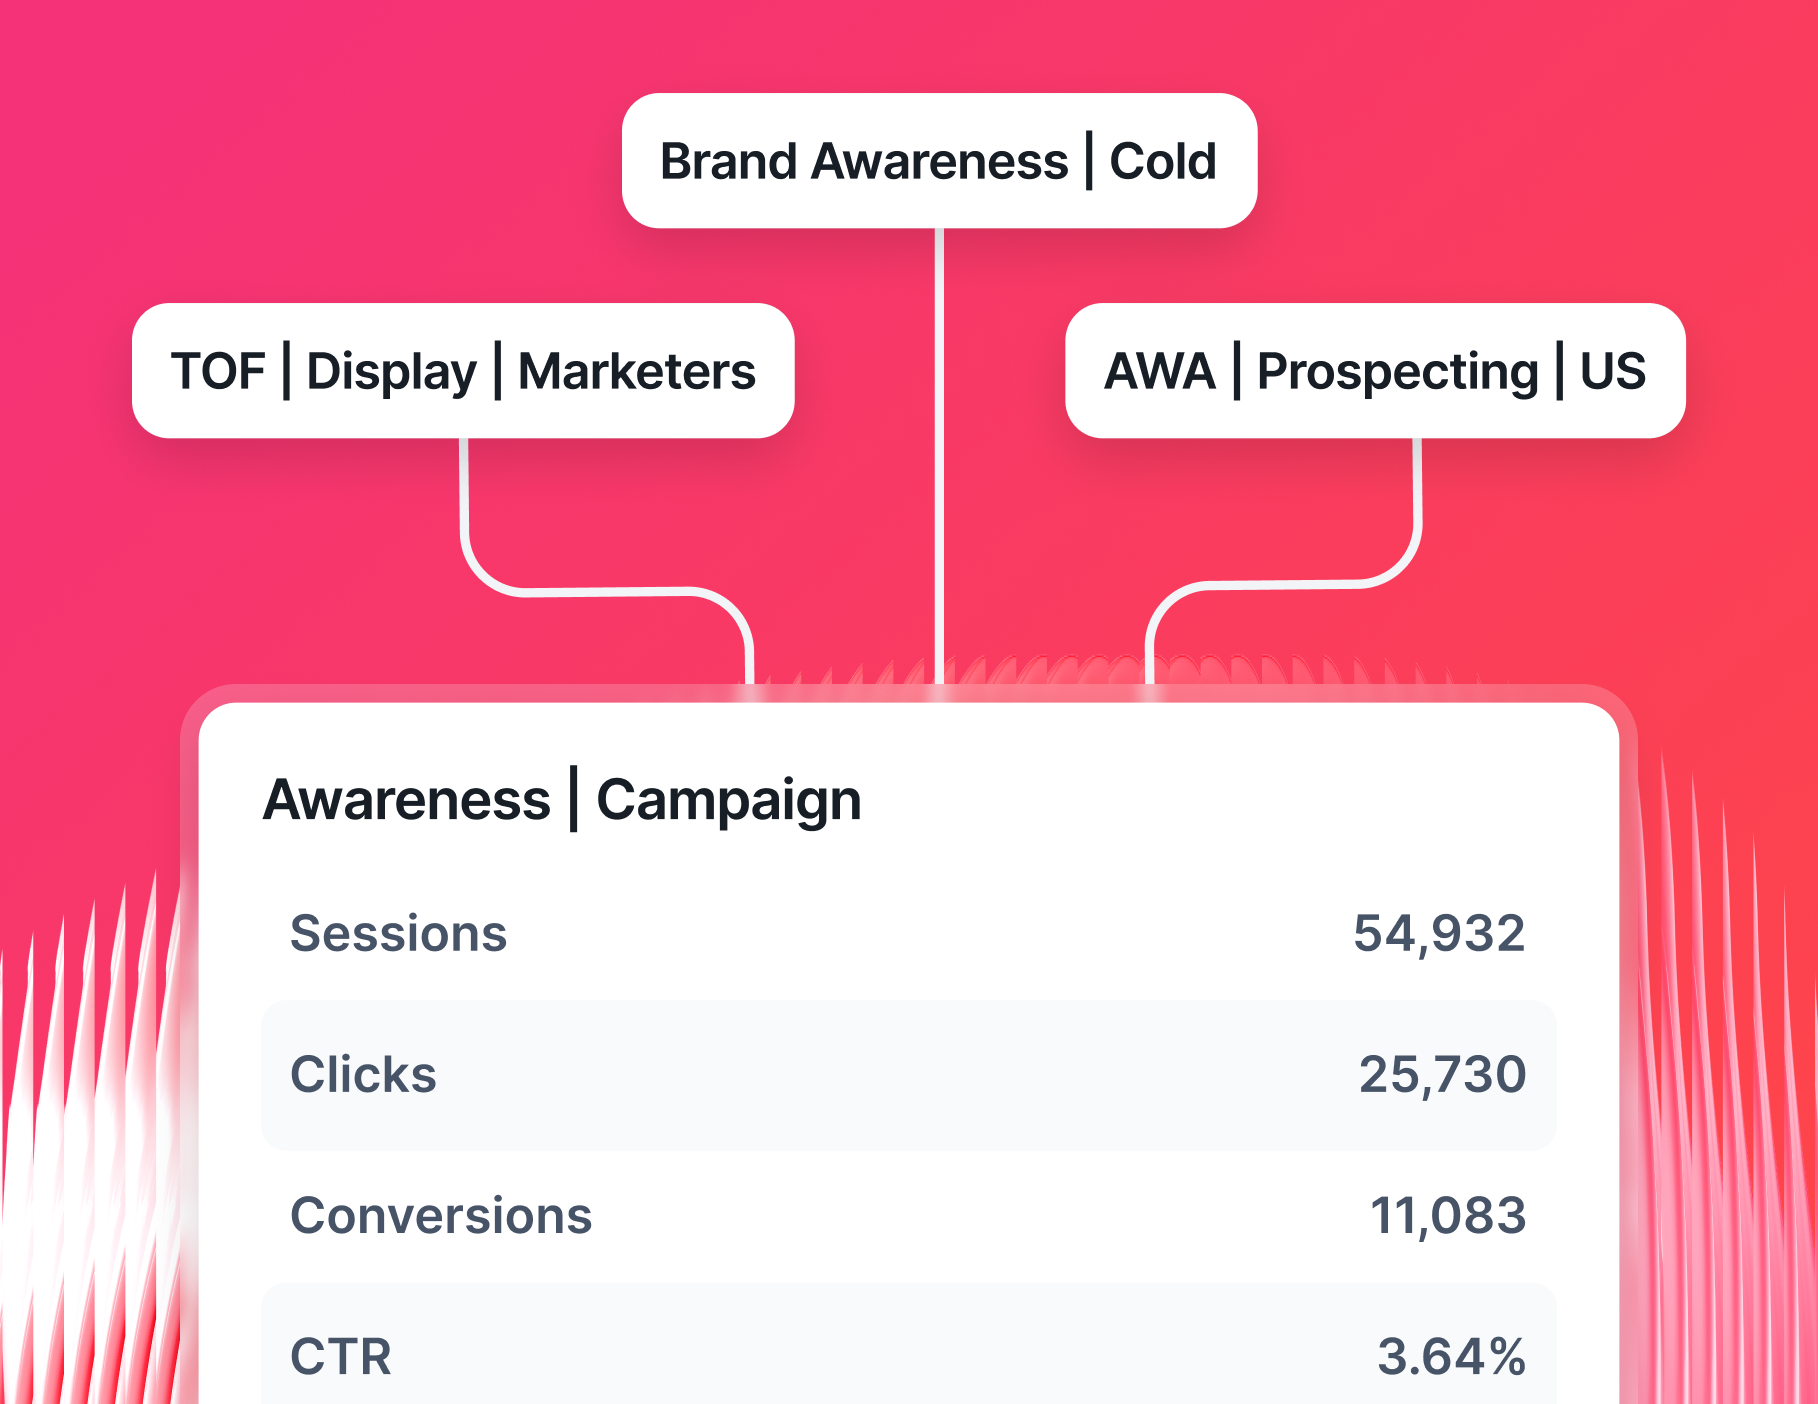
3. Sales trends and channel performance
These metrics show how performance moves over time and which channels are driving it.
- Sales over time: A time-series view of revenue across the reporting period - essential for spotting peaks, drops, and the impact of specific campaigns
- Sales channel performance: Breaks down gross sales, net sales, total sales, and Shopify conversion rate by channel (online store, POS, social commerce, etc.) - so clients can see exactly where revenue is coming from
4. Product-level metrics
Not all products perform equally. These metrics help clients and agencies understand what's selling, what isn't, and where to focus.
- Sales performance by product: Revenue, gross sales, net sales, and average order value broken down by individual product - critical for identifying top performers
- Sales information list: A consolidated view of gross sales, net sales, and total sales figures - useful as a quick reference summary inside the report
- Orders information list: Covers ordered quantity, returned quantity, and average units per order - gives a clear picture of order patterns
5. Cost and expense breakdown
Clients need to understand what's coming out, not just what's coming in.
- Expenses information list: Breaks out tax, discounts, returns, and shipping as individual line items - so the cost side of the store is fully visible
- Revenue funnel: Shows the relationship between total sales, gross sales, net sales, and total conversion rate in a single visual
6. AI performance summaries and next steps
Numbers tell clients what happened. A good Shopify report also tells them what to do about it.
That means going beyond the data and adding the context that clients actually care about. As Anton Kovalchuk, Digital Marketer at QliqQliq, puts it:
Most clients don't care about every minor metric - they want performance related to revenue, customer acquisition, and the like. Storytelling is important: instead of just reporting on numbers, explain why certain metrics changed and how they impact the overall marketing strategy.
Whatagraph's IQ Summaries read the data in your report and write a plain-language recap automatically - covering what performed well, what didn't, and why. You can edit the tone, add context, and have it client-ready in minutes.
Based on what the data shows, IQ flags specific actions - like investigating a high return rate on a particular product, or reviewing discount strategy after a drop in net sales.
And with the ‘Recommendations & Next Steps’ section, clients leave the report knowing exactly what the agency is focused on next, not just what happened last month.
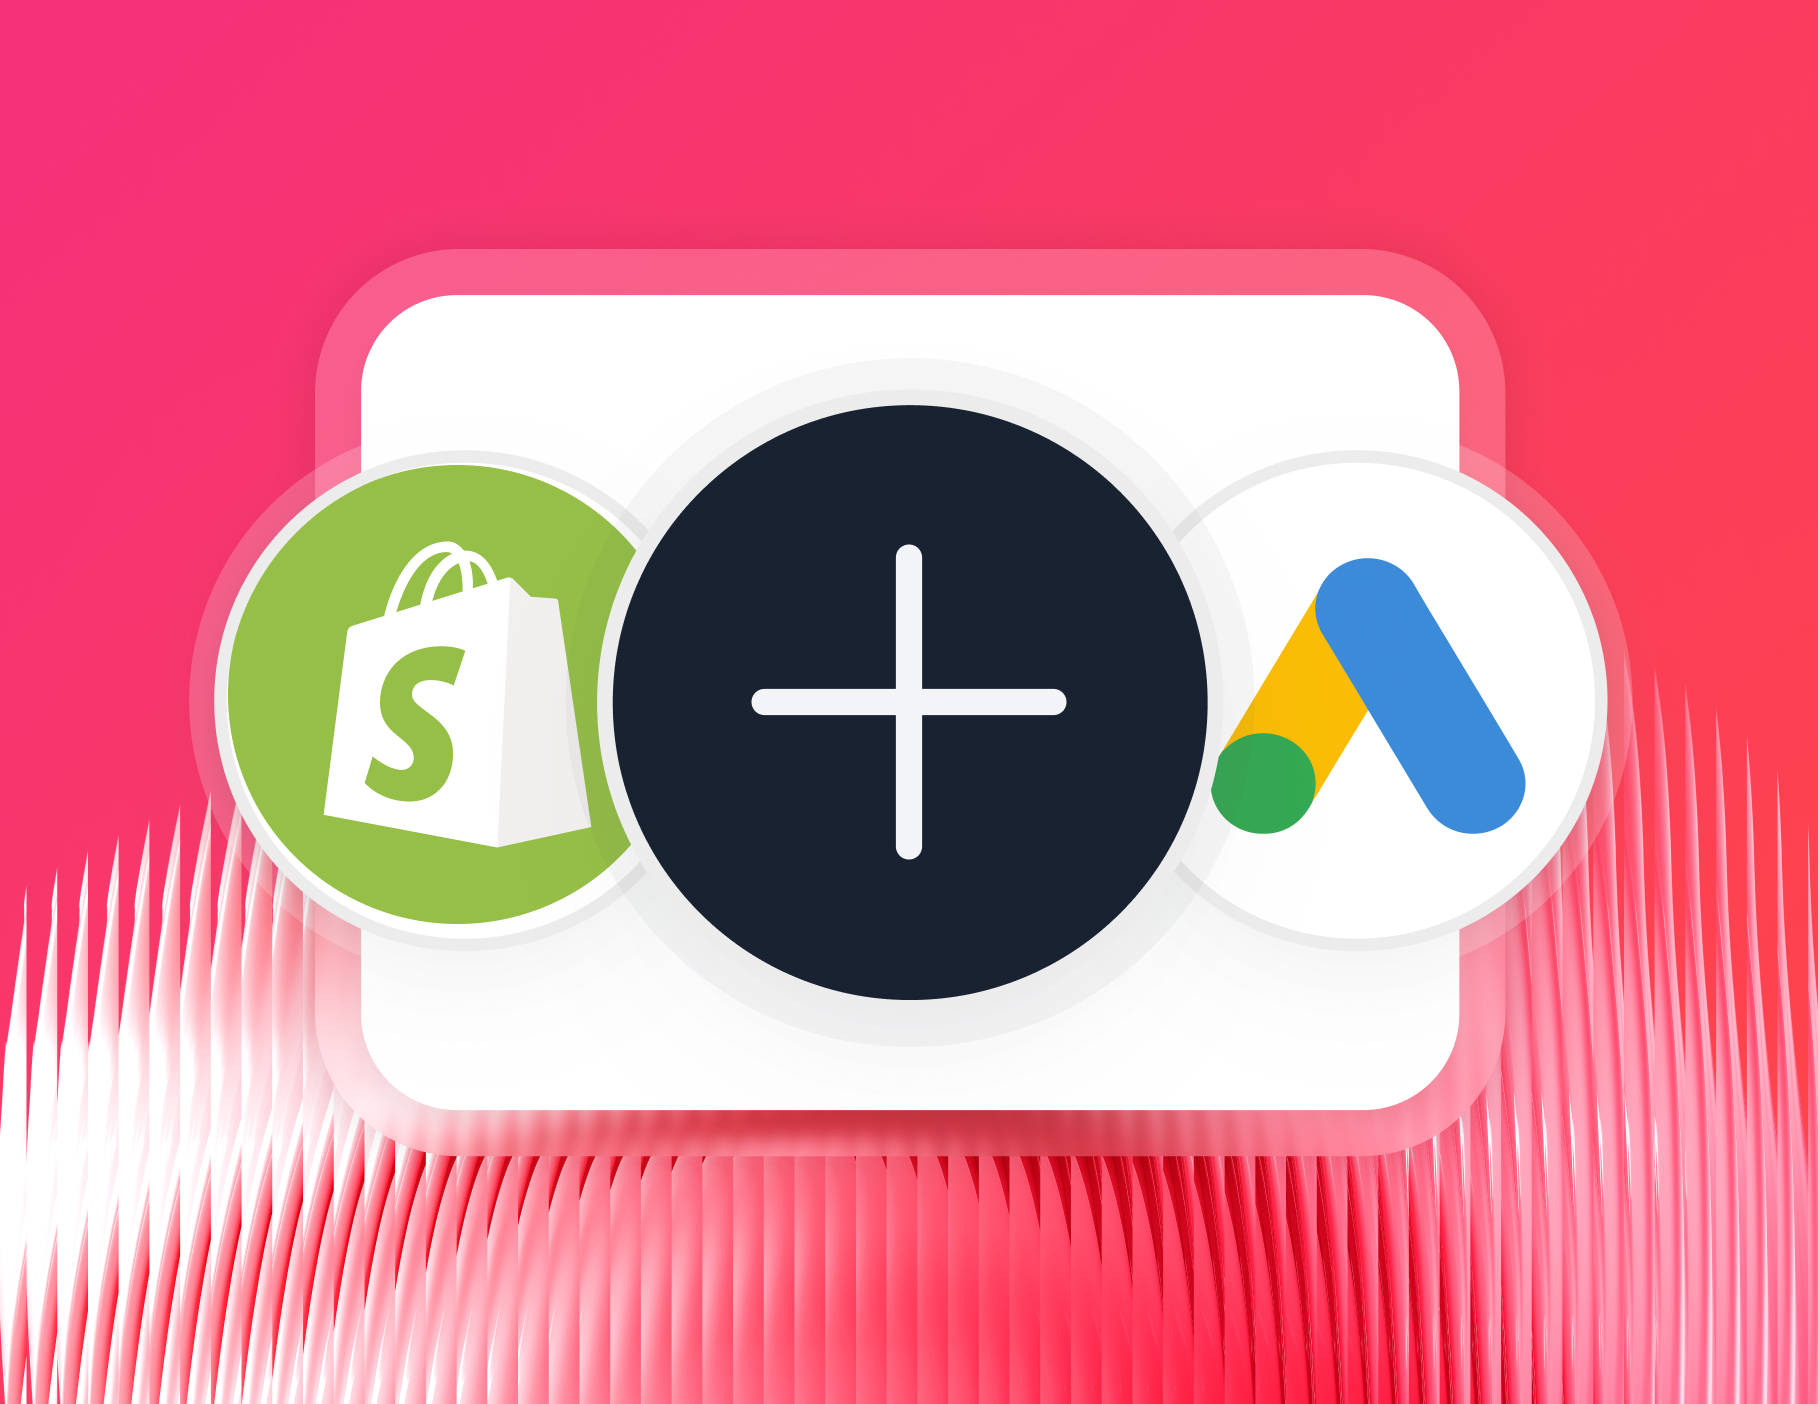
Can I combine Shopify data with Google Ads and Meta Ads in one report?
Yes - and for any agency running paid campaigns for ecommerce clients, this is exactly how Shopify advanced reporting should work.
Shopify revenue data alone doesn't tell you which campaigns drove it. Combining it with ad spend from Google, Meta, TikTok, and other channels gives you the complete picture: what was spent, what was earned, and what the actual return was.
Whatagraph connects all of these sources natively, so you can blend Shopify sales data with paid channel performance in one unified Shopify reporting dashboard - no Google Sheets, no manual reconciliation.
Here are two ready-to-use templates to get you started:
Google Ads and Shopify report template
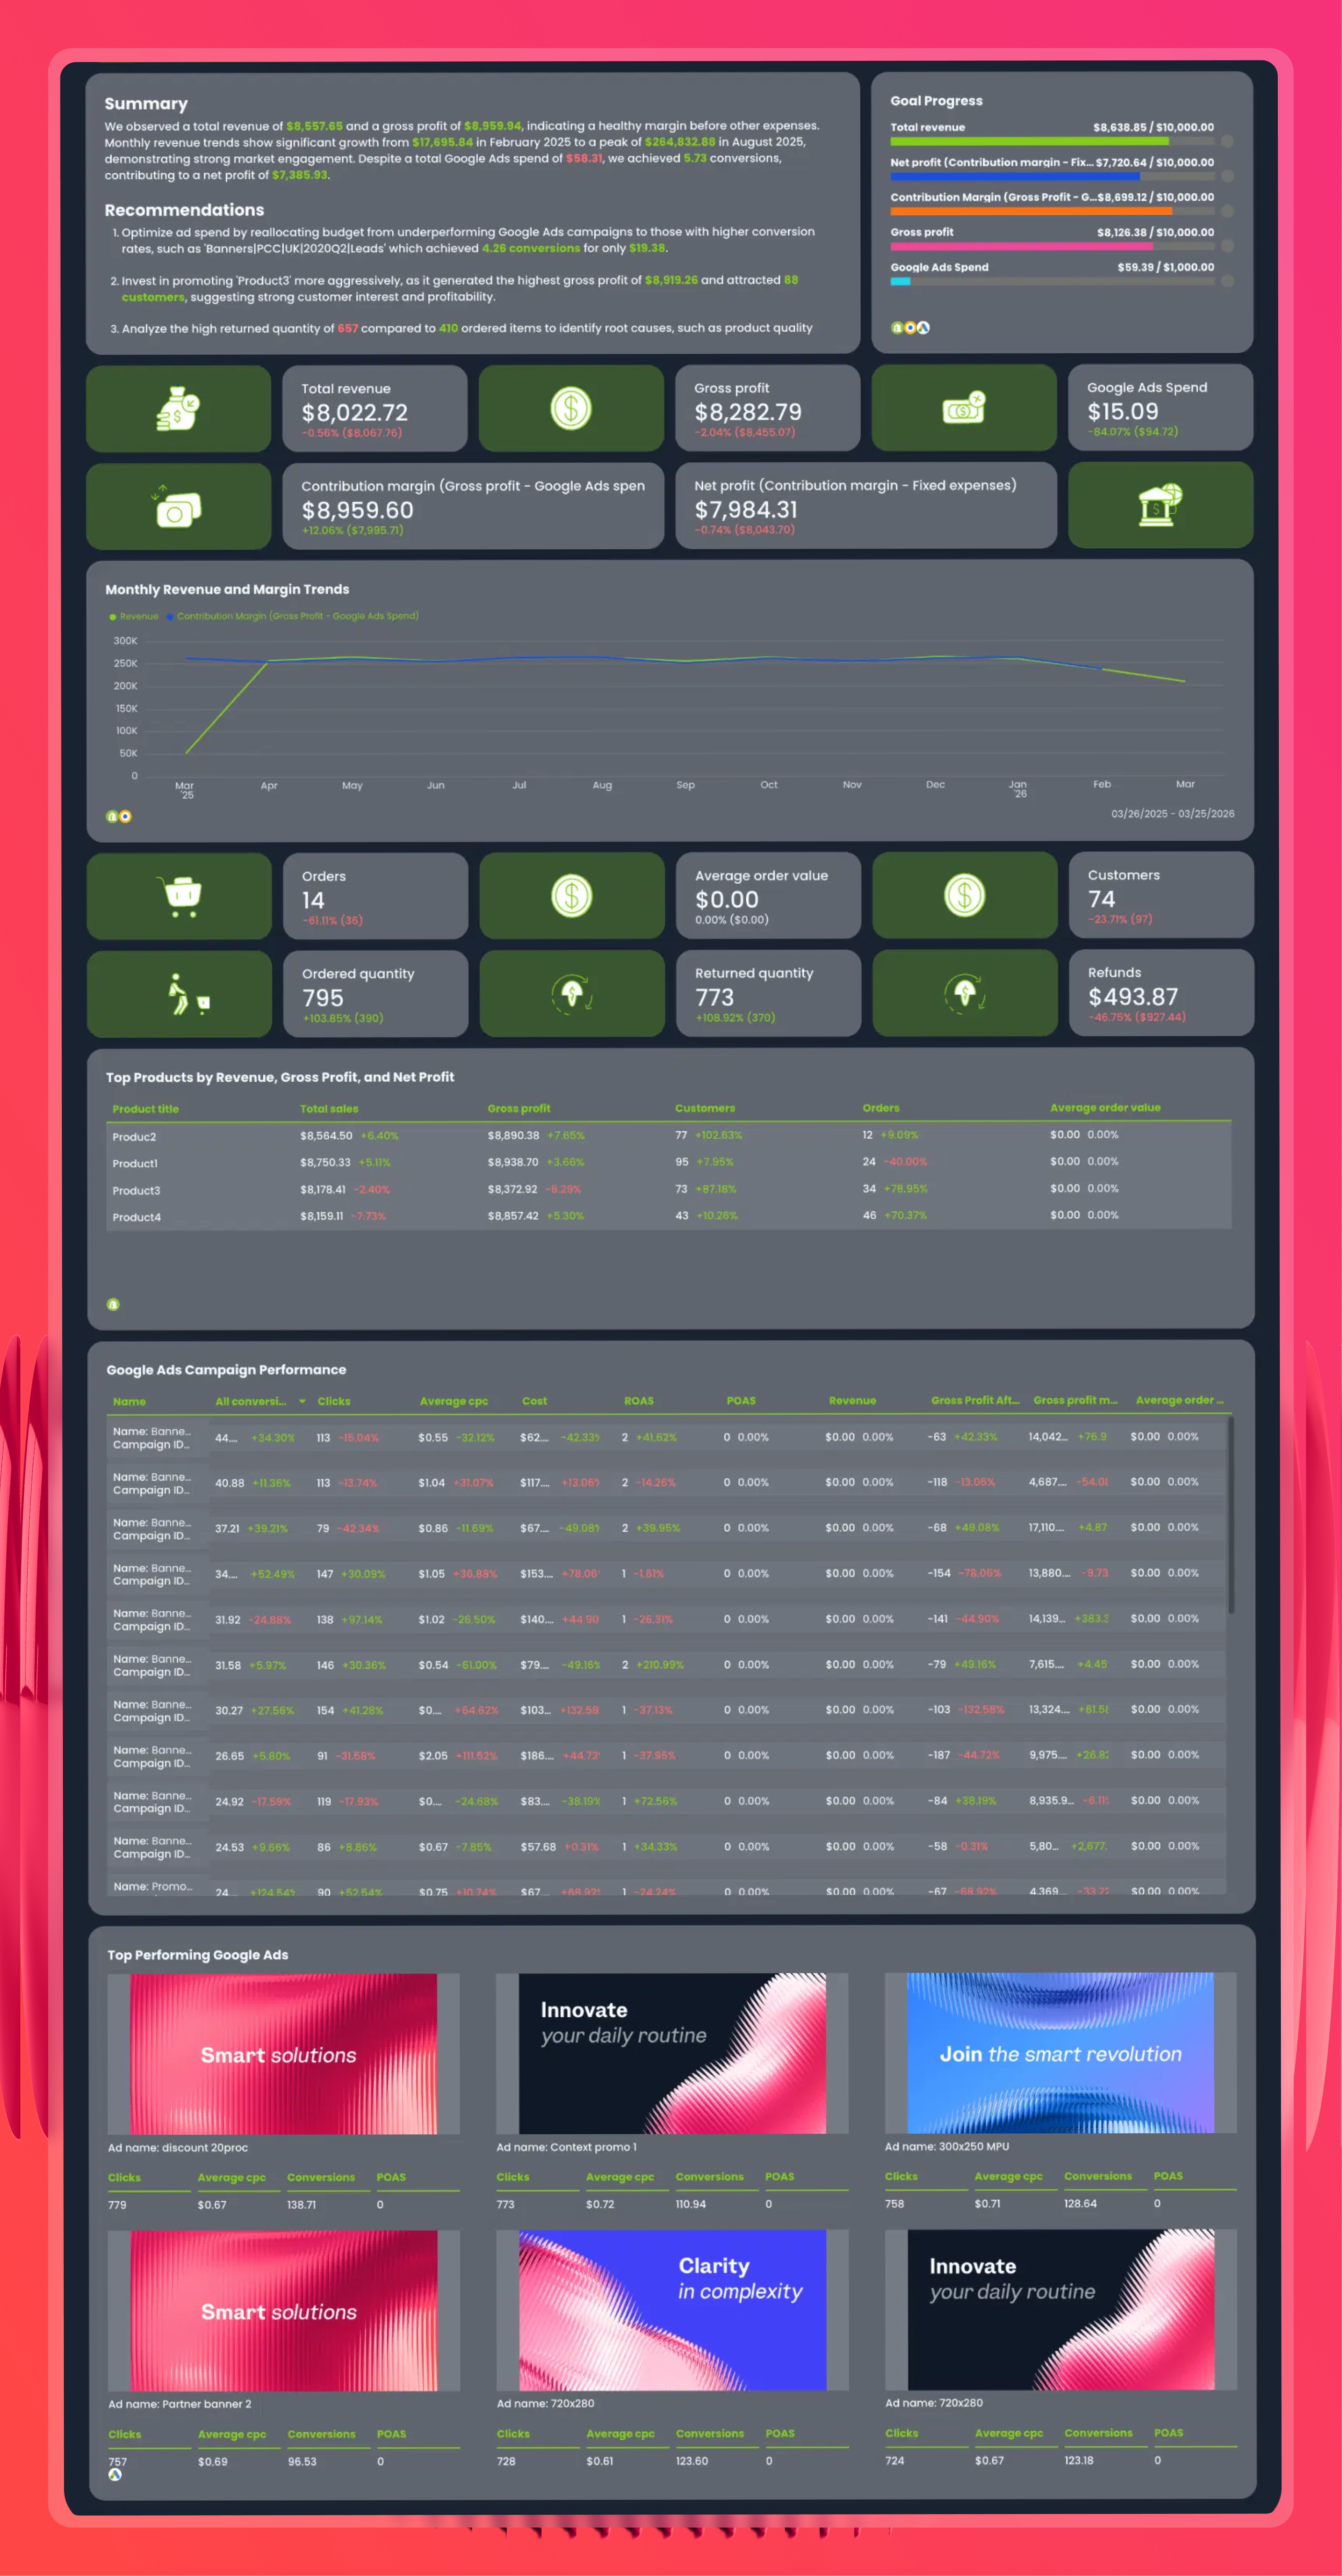
Co-created with Rasmus Madsen, Founder and Google Ads Specialist at RM Marketing, this Google Ads and Shopify report template is built around the metrics that ecommerce advertisers actually need to make decisions.
Primary KPIs:
- Profit on ad spend (POAS)
- Return on ad spend (ROAS)
- Google Ads cost
- Total revenue
- Gross profit
- Contribution margin (Gross profit - Google Ads cost)
- Net profit (Contribution margin - Fixed expenses)
Secondary KPIs:
- Orders
- Average order value (AOV)
- Customers
- Ordered quantity
- Returned quantity
- Refunds
- Clicks
- Average CPC
This pre-built report template also includes a monthly revenue and margin trends chart, top products by revenue and gross profit, and a full Google Ads campaign performance breakdown - all in one view.
Comprehensive ecommerce report template
This ecommerce report template covers the full ecommerce marketing stack - Facebook Ads, Google Ads, TikTok Ads, LinkedIn Ads, Pinterest Ads, and Shopify - with an all-channels overview tab that ties everything together.
KPIs by channel:
- Facebook Ads: Total spend, website purchase value, website purchases, cost per website purchase, conversions, ROAS
- Google Ads: Total spend, all conversions, cost per conversion, revenue, AOV, ROAS, cost of goods sold
- TikTok Ads: Total cost, conversions, CVR, unique purchases, total complete payment value, complete payment ROAS
- LinkedIn Ads: Total spend, revenue, post-click conversions, conversion rate, total engagements, ROAS
- Pinterest Ads: Spend, conversions, engagement order value, paid pin clicks, in-app ROAS, web ROAS
All-channels overview:
- Key metrics by channel (impressions, clicks, CTR, cost, conversions, ROAS)
- Conversions by channel and spend by channel trend charts
- ROAS by channel
- AI-generated summary and recommendations