How to Build a LinkedIn Analytics Report in 4 Steps (+Template)
LinkedIn is a great tool for digital marketers to reach a more professional audience and crush their business goals. Whether you’re using LinkedIn marketing to promote yourself or your business, there are plenty of ways (organic or paid) to put yourself out there and get not just impressions, but also conversions and new revenue.

Jan 21 2021


However, doing all that work without analyzing your performance makes very little sense. After all, what gets measured gets managed, and you want to stay on top of your marketing efforts.
One of the best ways to stay on top of your LinkedIn performance is to create a LinkedIn analytics report. Today, we’ll show you how to create this kind of report, as well as include a template that allows you to do this in minutes rather than hours.
What is a LinkedIn analytics report?
A LinkedIn analytics report is a document outlining your key LinkedIn company page KPIs and metrics. It’s a type of social media marketing report that focuses on LinkedIn metrics, showing you how well your page is doing in terms of engaging your key demographics.
Based on the key metrics and the LinkedIn data from this report, you can optimize your future organic and paid LinkedIn campaigns.
9 metrics to include in a LinkedIn analytics report
The metrics you include will depend on the campaigns you run. For example, if you run LinkedIn ads, you’ll have a wildly different set of metrics compared to an organic marketing strategy.
However, here are some of the most basic types of metrics you should include in this report.
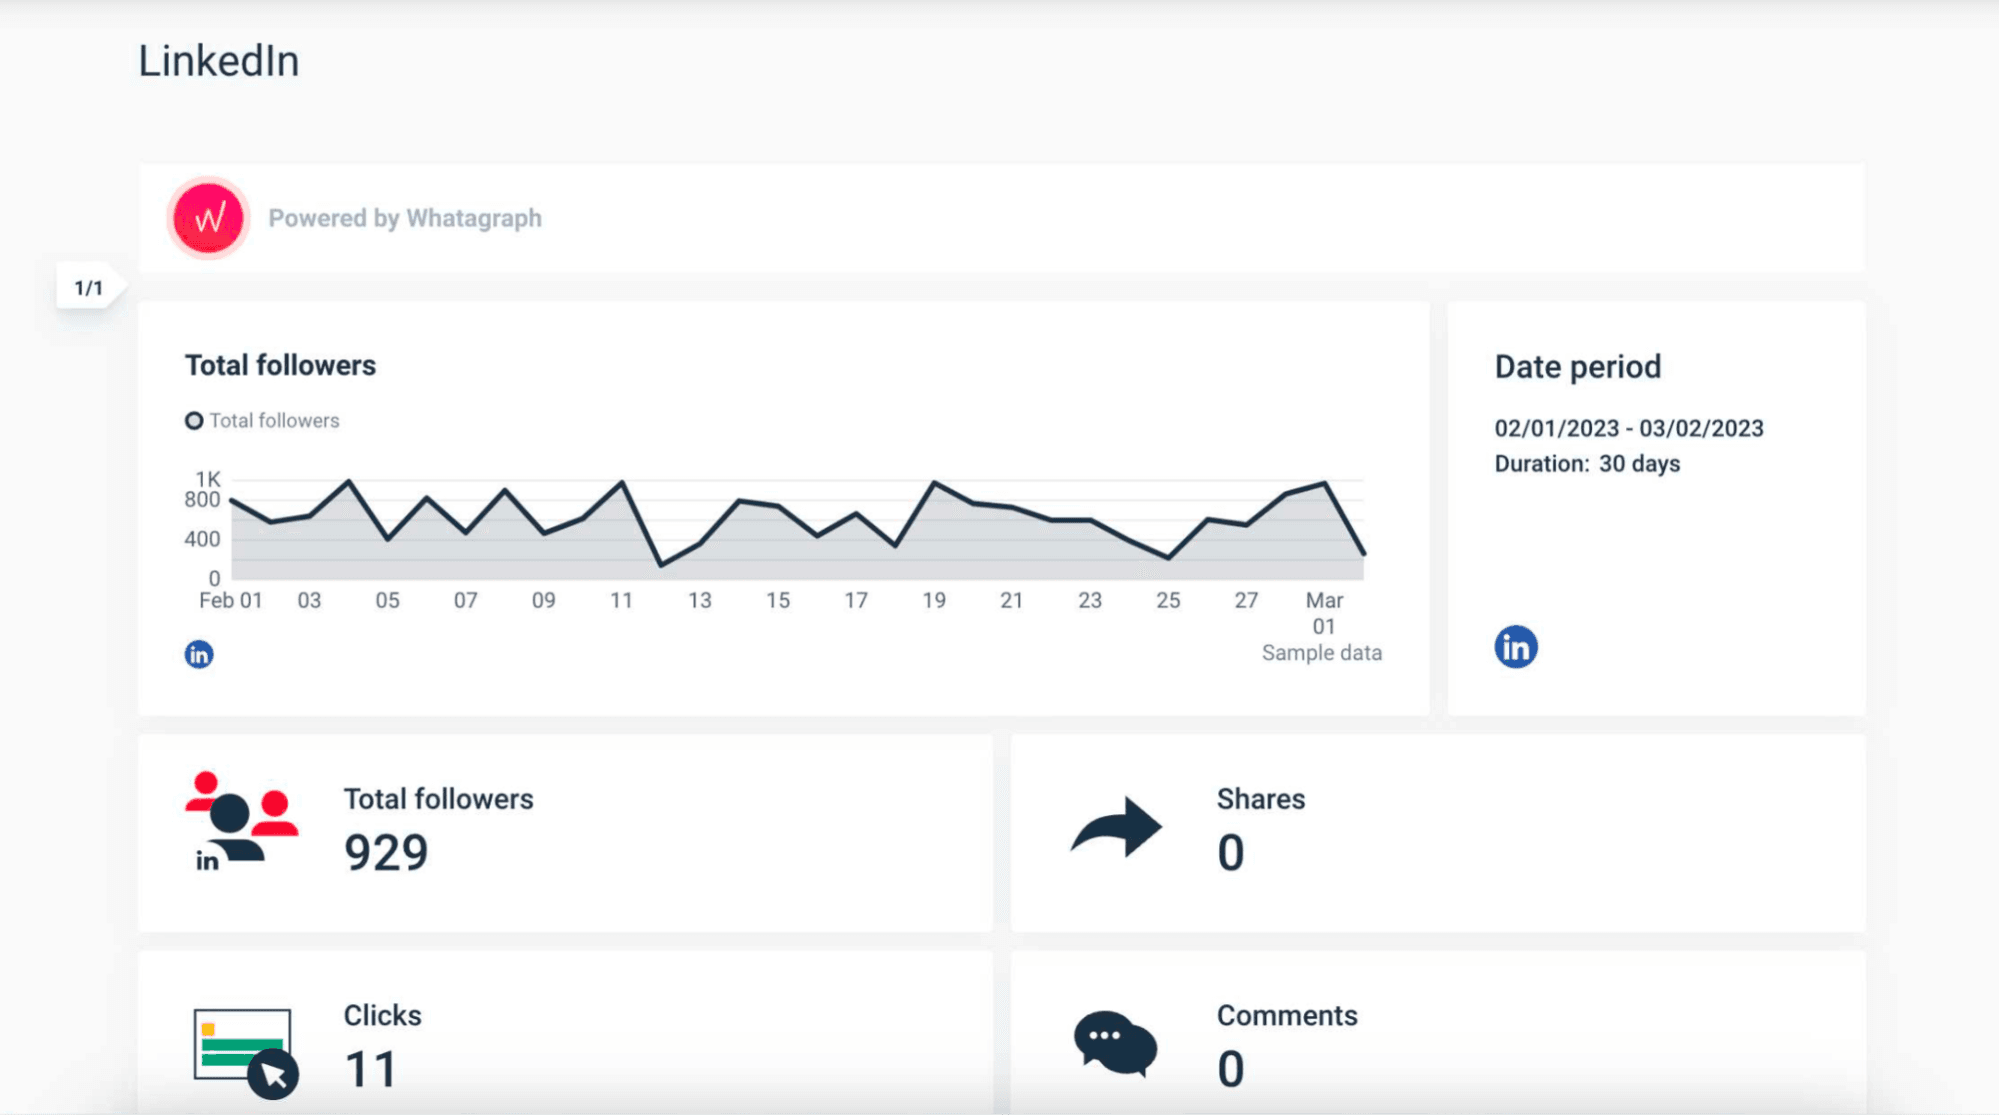
- Clicks - This is the number of times your content was clicked on.
- CTR (Click Through Rate) - This is the number of clicks divided by impressions.
- Likes - The number of likes on your content.
- Comments - The number of comments on the content you post in front of your target audience.
- Shares - The number of people who shared your content on LinkedIn.
- The number of followers - The number of people who click ‘follow’ on your business page.
- Engagement rate - A common metric on many social media platforms, calculated as follows: clicks + likes + comments + shares + follows / impressions
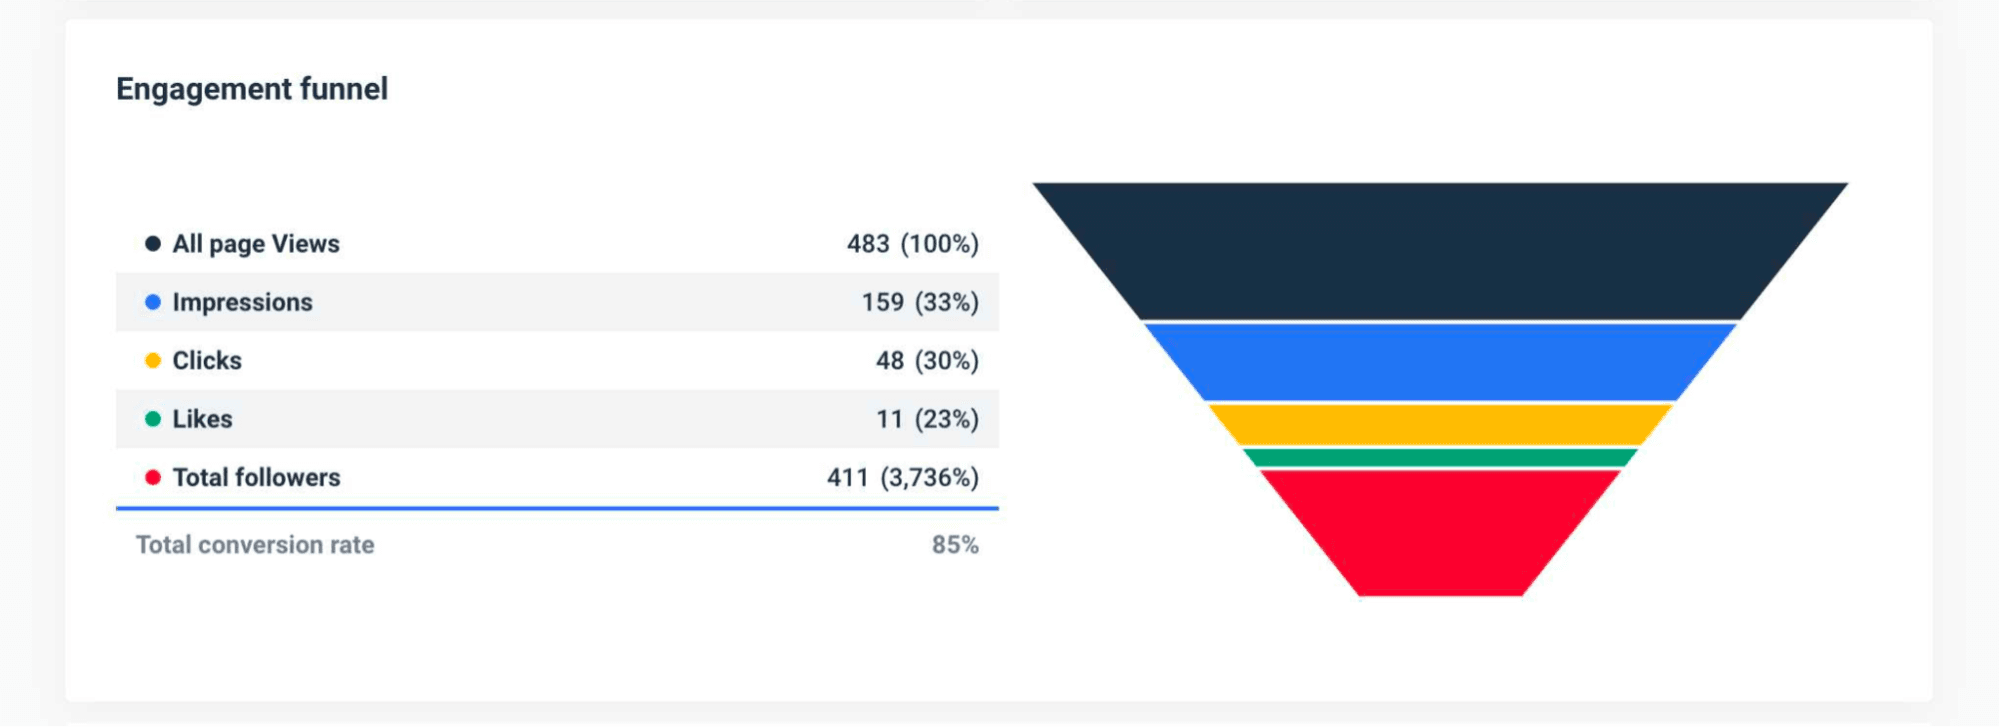
- Conversion funnel - how effectively your LinkedIn content converts readers and followers. Anything can be a conversion, from a person subscribing to your blog to someone booking a sales call from your page. Choose what a conversion is for your account and benchmark it for better tracking.
- Follower demographics data - who your audience is, broken down by job function, location, company name, and many more data points.
There are others you may consider like LinkedIn Ad AB testing metrics, but these are the top ones if you want to measure your LinkedIn performance.
How to create a LinkedIn analytics report in 4 easy steps
We’ll go through this step-by-step to simplify the report creation process, while not leaving anything important out. The goal is to ensure we have a comprehensive report that shows the performance of a LinkedIn page and answers any questions a client or your executive would have – even before they arise.
Step 1: Grab a good reporting tool
Creating reports manually from LinkedIn can be a chore. Instead, you can (and should) use a reporting tool such as Whatagraph.
You can connect your LinkedIn account to Whatagraph, grab a report template (we’ll get to this in a second), and create a report within minutes.
Whatagraph lets you create reports quickly and use beautiful visualizations to highlight your account performance. It’s intuitive and easy to use and with one click, you can share your report with a client in real-time.
Creating a report manually is not an option in 2023 as you can spend that time creating more content and providing more value to your client or manager.
Step 2: Use a report template
Once you’ve connected your LinkedIn account to Whatagraph, you can use a LinkedIn analytics report template. It’s just a few clicks and after that…
- You get a report instantly with the most important metrics and widgets
- You get all the visualizations to show your results (bar charts, graphs, pie charts, tables)
- Your report is 99% done and you can make tweaks to it before sending off to your manager or a client
The beauty of this report template is that even if you have no idea how to get started, you get all the right report elements with just a few clicks. And best of all, your client or manager never even has to log in to a LinkedIn dashboard.
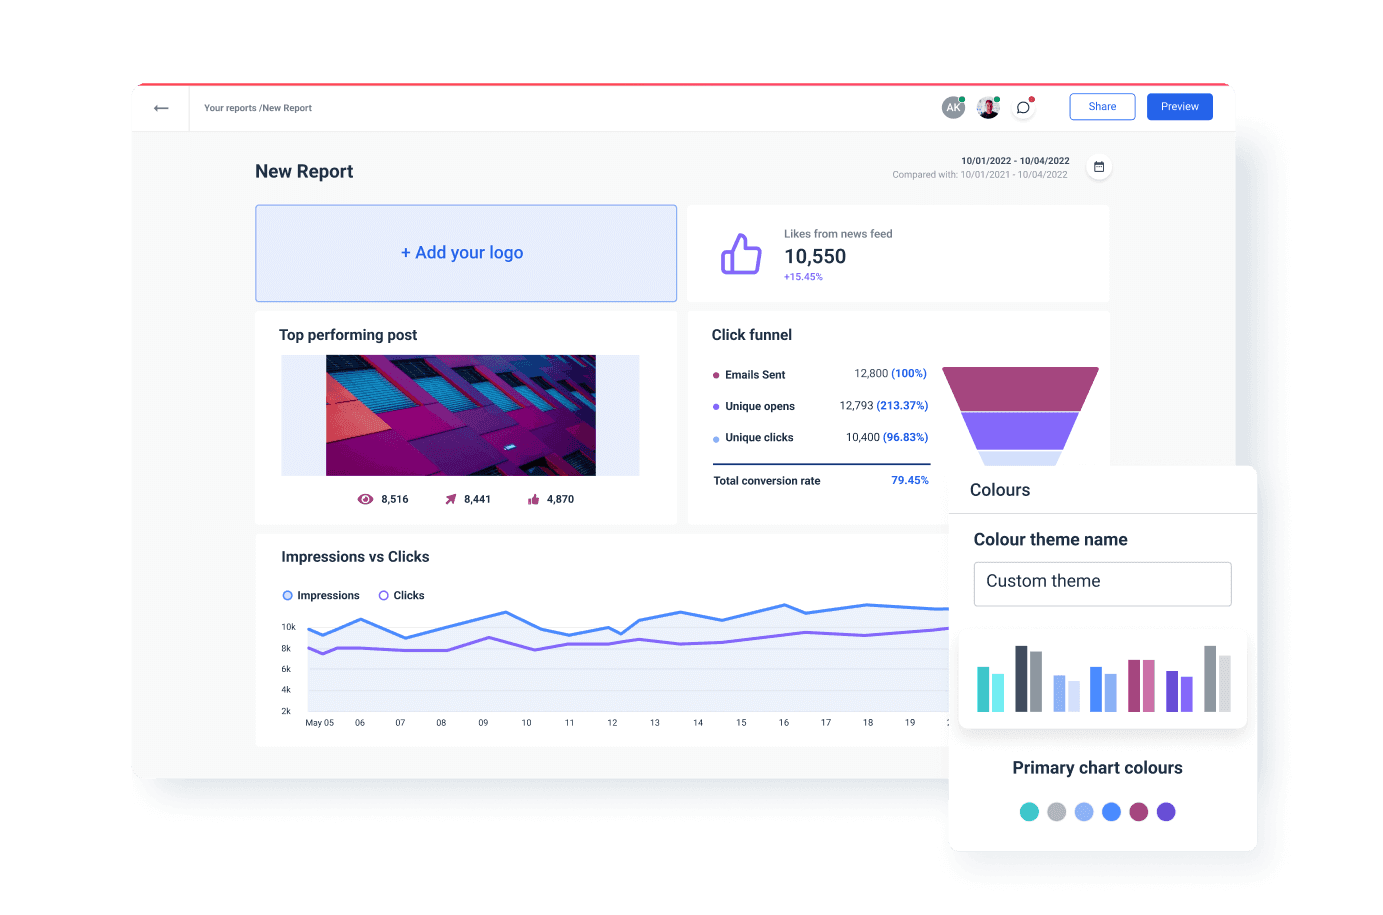
Step 3: Edit your report
If you’re not happy with your report, you can edit it to your liking. There are plenty of ways to:
- Change your widgets so they display different metrics
- Change the design and the colors in your report
- Use the white label feature (remove the Whatagraph branding from your report)
- Add another channel such as Facebook for cross-channel social media analytics (Whatagraph has 40+ integrations besides LinkedIn, including Google Analytics, Google Ads, Twitter, Instagram, and many others)
- Adding a summary on top, explaining the growth/decline in metrics to the reader
While the template is an excellent starting point for social media management and reporting on LinkedIn, you can still change different elements to personalize it for each manager or client.
Step 4: Send out and automate your report
One of the most tedious parts of social media reporting? It never stops. If you’re active on your LinkedIn account, you’ll have to send out new reports weekly or monthly.
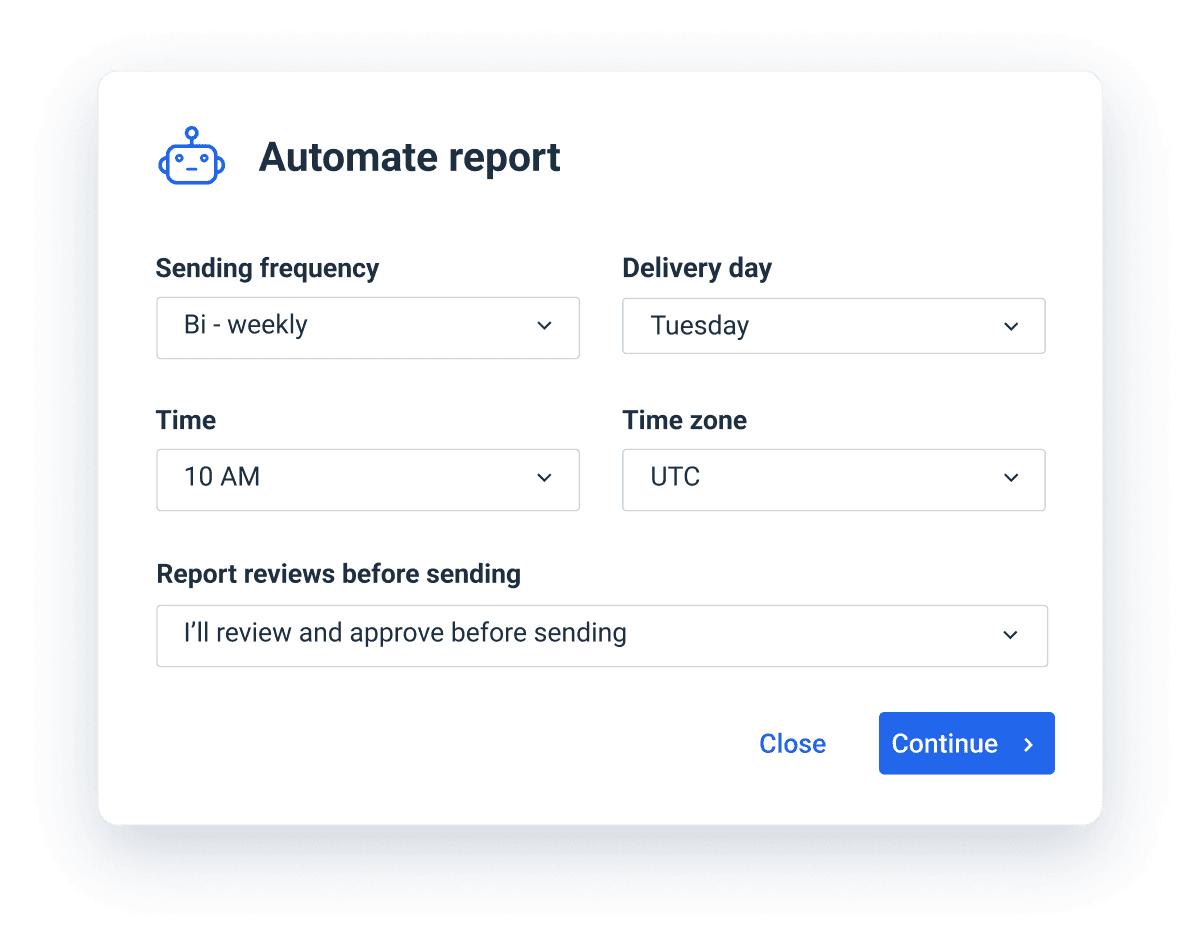
With Whatagraph as your LinkedIn analytics tool, there is no need to worry about that. Once your LinkedIn account is connected and you created your first report, you can schedule it with your ideal time frame in mind: once a week, once a month or quarter, or any other custom interval you prefer.
That way, your client or manager can get insights about page performance straight to their inbox. You don’t have to lift a finger and they can access your LinkedIn page analytics without getting in touch with you. And with Whatagraph, you can add other social networks too, for a cross-channel marketing report with multiple data sources.
Start sending amazing LinkedIn analytics reports today
The days of reporting on your LinkedIn profile performance with presentations and excel sheets are over. Once you set up your first LinkedIn report, you’ll be able to automate the entire process and focus on creating content and engaging your audience - and not reporting.
Sounds like a plan? Start your free trial of Whatagraph today and see how you too can create amazing LinkedIn reports without breaking a sweat. No credit card is required!
Published on Jan 21 2021
WRITTEN BY
Mile ZivkovicMile is the ex-Head of Content at Whatagraph. A marketing heavy with almost a decade of SaaS industry experience, Mile has managed multiple content marketing teams without losing an ounce of his writing passion.