How to Build an SEO Client Dashboard in 5 Minutes
The easiest (and fastest) way to build an SEO client dashboard is to use a dedicated SEO reporting tool. In this article, you’ll learn how to choose the right dashboard tool and use it to structure your SEO dashboard so it’s the most useful for clients.

Nov 05 2024●7 min read

You’re creating and executing SEO strategy for a dozen clients.
There’s an opportunity to scale up, but client reporting is already taking much of your time.
Even now, it takes hours every week to prepare all reports.
You need a single source of truth that would automatically pull data for each client and neatly present it in real time.
You need an SEO client dashboard.
But how do you pick the right dashboard tool? How do you structure an SEO dashboard? Which metrics to use?
We asked six digital marketers:
- Sophie Brannon, Director of SEO @ RushOrderTees
- Zach Pittman, Digital Marketing Consultant @ Forrest Property Group
- Henry Smith, Head of SEO @ Dark Horse
- Olivia Tapper, Head of Operations @ DTC SEO Agency
- Frank Salvatore, Owner @ FlexLeads
- James Taylor, SEO Consultant @ Embryo
…these questions and compiled their insights in this article.
What Makes the “Best” SEO Client Dashboard (According to SEO Experts)
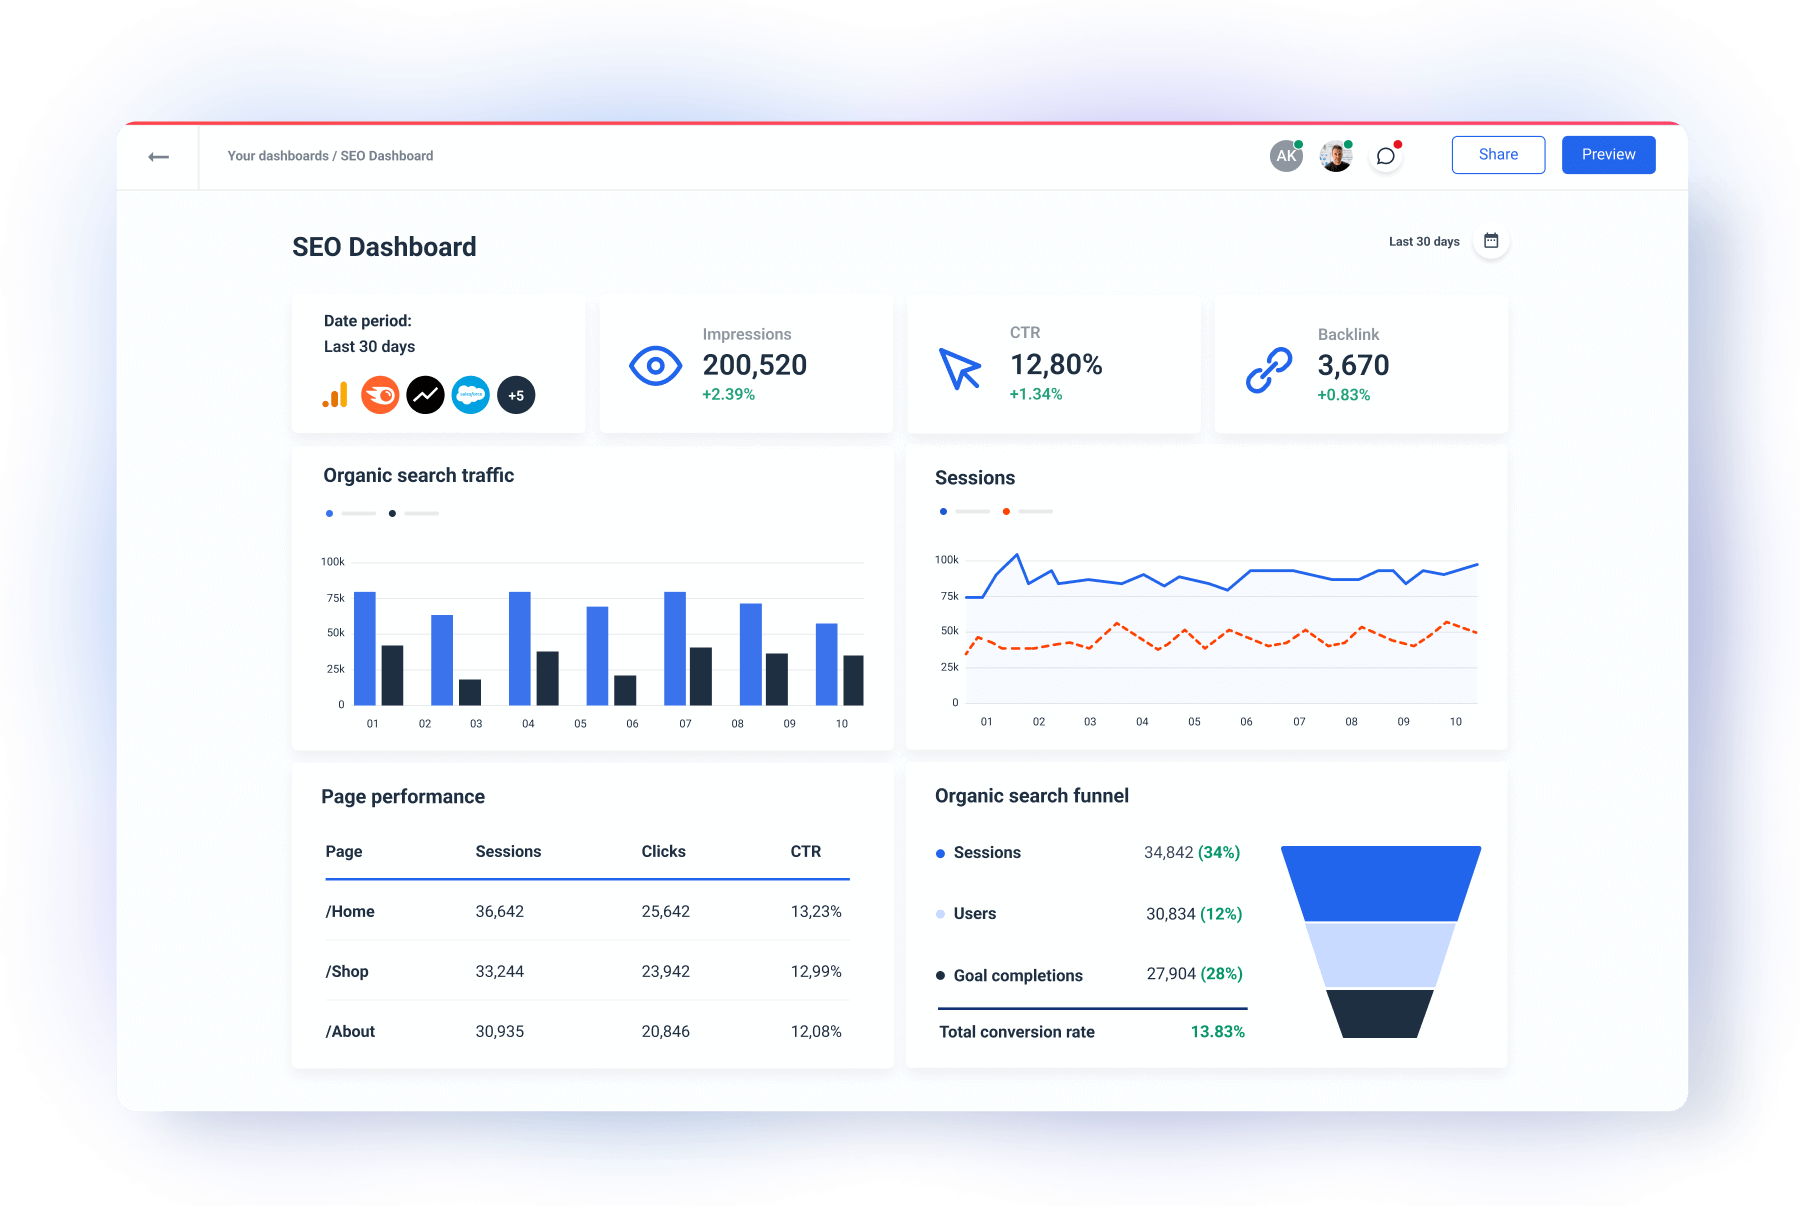
An SEO client dashboard is an online display outlining the most relevant SEO metrics and KPIs for a specific client. It shows SEO strategy and its progress and how SEO campaigns are performing in terms of new backlinks, keyword rankings, organic search performance, referral website traffic, and more.
Building an SEO client dashboard is easy and straightforward if you use the right tool.
SEO reporting tools can help you streamline the setup, automate updates, and visualize key SEO KPIs in a way your clients understand.
But there are (literally) hundreds of reporting tools out there—how do you pick the “best” one?
Well, “best” is subjective. For Sophie Brannon, Director of SEO at RushOrderTees, it’s:
- Speed
- Minimal lag on API connections from different sources
- Ease of use
- Ability to build and replicate templates easily
- Polished and consistent look all across
The less time spent on making the report "look pretty" or presentable the better.
Olivia Tapper of DTC SEO Agency also values a dashboard software that is easy to connect and use. She adds:
There also should be text elements you can place in the tool so you can add descriptions, your own titles etc. I'd also like to see some more ability to decorate, adjust size and colors, etc. I've studied UX, so I know how important the visual language is.
Frank Salvatore, Owner of FlexLeads says that his clients prefer different report formats:
Ideally a quality reporting tool should offer multiple formats (online, pdf, spreadsheet) to meet customer preferences.
Salvatore has a good point. Some clients prefer live dashboards with data that refreshes automatically. Others may ask you for monthly or weekly reports. If your clients prefer regular updates, here’s how to create detailed SEO reports.
Also, don't forget to check the pricing model.
Does the dashboard software charge by user, by connected source, a number of dashboards, or something else?
Just make sure you can fit the price of the dashboard tool into your overall SEO costs.
James Taylor, SEO Consultant of Embryo, values connectivity above the rest:
Ease of integration, particularly with GA4. I feel like this was never a concern with Universal Analytics, but it’s definitely something I’d be looking for when it comes to linking-up GA4.
To sum up, the “best” SEO client dashboard, according to these marketers, comes down to the following:
✅ Platform speed
✅ Stable plug-and-play data connections
✅ Ease of use
✅ Save anything as a template
✅ Professional look
✅ Visual customization
✅ Multiple reporting formats — live dashboard, sheets, PDF
We built Whatagraph to check all these boxes. In this next section, we’ll show you how to build an SEO client dashboard in 5 minutes using Whatagraph.
How to Create an SEO Dashboard for Clients: Step-by-Step Guide
Here's a simple guide to building an effective SEO client dashboard that shows the impact of your SEO efforts and keeps clients informed of their ROI from organic search.
Step 1: Connect your SEO data sources
To get a full picture of your SEO performance, start by connecting key data sources.
For Henry Smith of Dark Horse, the first-party data pulled using APIs is essential for the accuracy of reporting:
GA4, Google Search Console and dashboards within the CMS, such as Shopify and WooCommerce should be used primarily. You can then supplement the first-party data with data from third-party tools such as SEMrush, Ahrefs, SEO Monitor, Sistrix, and SE Ranking.
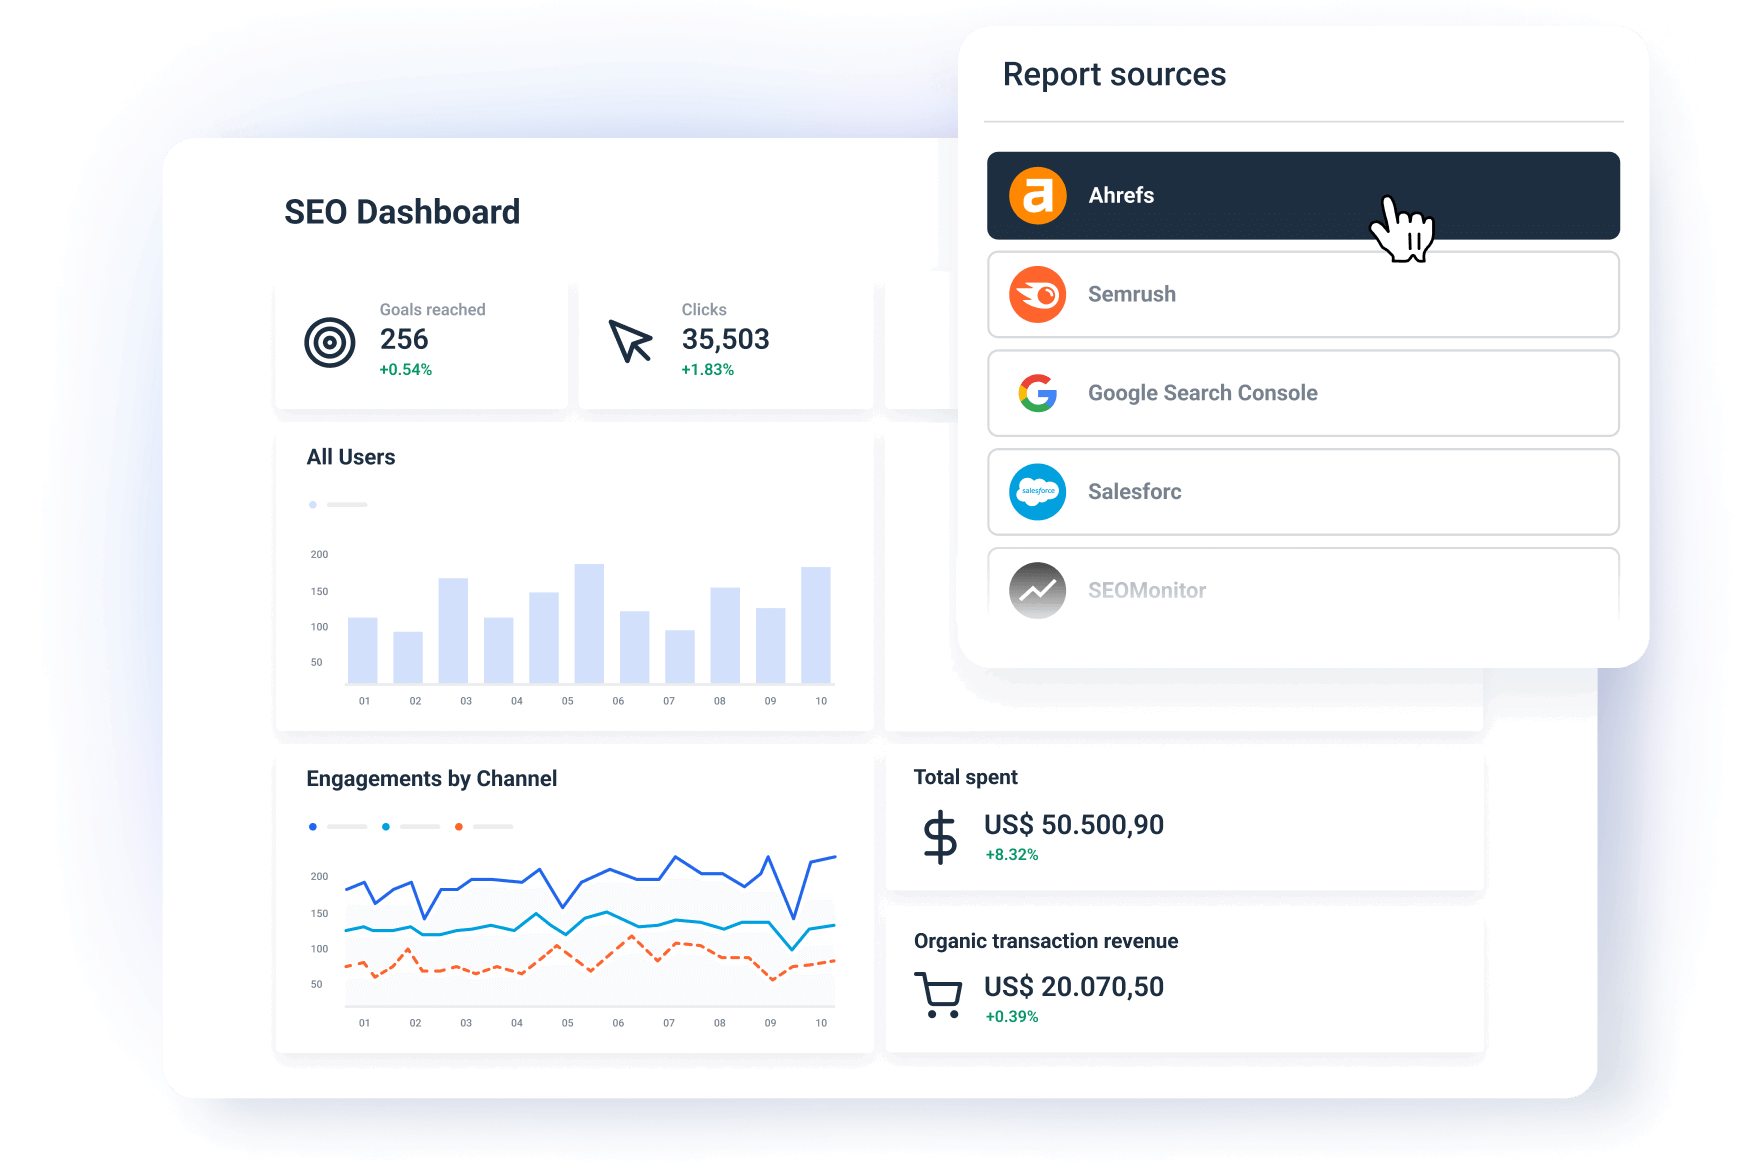
Whatagraph has fully managed integrations with popular SEO tools, such as:
- Google Analytics
- Google Search Console
- SEMrush
- SEO Monitor
- Ahrefs
- SE Ranking
- Google My Business
But also CMS tools like Shopify, HubSpot, and WooCommerce.
At this point, I must urge you to avoid dashboard tools that use third-party data connectors.
These connectors are much less reliable than native integrations and can even slow down your dashboard (I’m looking at you, Looker Studio) or lag in updates, so you have inaccurate data.
Zach Pittman of Forrest Property Group uses Looker Studio for client reporting but is aware of its shortcomings:
We've had issues with data not updating correctly or graphs suddenly showing incorrect information. When data is wrong in our reports, we find ourselves spending a lot of time problem-solving by looking at the original data in GA4 or Google ads, and in some cases, simply explaining to the client that the data is not showing correctly.
Whatagraph integrations, on the other hand, are all built in-house and maintained by our Engineering team, so once you hook up your sources, there’s nothing to reconnect or update.
How to do it:
- In your Whatagraph dashboard, go to Data Sources and select the SEO platforms you need.
- Follow the on-screen prompts to provide the necessary credentials and connect each platform.
- Once integrated, Whatagraph will automatically pull in the latest data, updating in real time.
Benefits:
- A centralized view of SEO metrics across multiple tools.
- Accurate and relevant data in your dashboard 24/7.
Step 2: Choose an SEO template or start from scratch
Whatagraph offers a pre-built SEO Dashboard Template that covers core metrics like organic traffic, bounce rate, and keyword performance. You can use these templates as a starting point and customize them to better suit your client’s goals (see Step 3).
How to do it:
- Go to the Templates section in Whatagraph and search for SEO-related templates.
- Choose a template that aligns with the KPIs you want to display (e.g., keyword rankings, traffic sources, conversions).
- Alternatively, select Create New Report to build a dashboard from scratch, choosing only the widgets and metrics that you need.
Benefits:
- Templates speed up dashboard-building process.
- You can tailor the dashboard to specific client needs, highlighting the most relevant data.
Step 3: Customize the SEO dashboard template for a specific client
In Whatagraph, you can quickly build a customizable SEO dashboard. Once you’ve found the template that is the closest match to your client’s needs, you can start tailoring it. Let’s just make sure you check all the boxes.
Start with the most important data for the person who is receiving the report, and make sure that they are customizable to allow for adding or removing different metrics. Ultimately you want to show the "what", "why", and "what's next".
✅ Connect the relevant data sources: While you can load a template even with one source connected, (for example, Google Analytics 4), now you need to add other sources that hold relevant SEO data.
✅ Customize metrics and widgets: Now you need to review the metrics already included in the template and decide if you need to add or remove some of them, so your dashboard shows only the important ones.
For example, if a client is focused on local SEO, add Google My Business metrics like calls, directions, and search views. For an e-commerce client, prioritize conversions from organic search.
If your client has unique KPIs, use Whatagraph’s Organize feature to create custom metrics (more in Step 4). For example, you can create metrics for Organic Revenue (total revenue from organic search) or Cost per Lead from Organic.
Brannon adds:
Over the years, I've found that the main things clients and stakeholders care about is transparency and more detail on "why" things are happening the way they are i.e. what has influenced specific metrics and how does this relate to the work that has been carried out.
✅ Choose the appropriate visuals: Whatagraph offers different chart options, such as line charts, bar graphs, and pie charts. If your client prefers a bar chart to a pie chart for a specific metric — nothing easier. Pick the bar chart widget and select the metrics and dimensions you want to see.
(Psst. You can also create custom charts and save them as template widgets.)
✅ Arrange the widgets for easy interpretation: You should always place the most critical KPIs (like organic traffic, conversions, and keyword rankings) at the top of the dashboard, right next to the Goals widget.
Brannon points out that you should structure your dashboard depending on who is going to read it, what tier SEO knowledge is, and what they care about:
For example, if you're presenting to the CEO of a business, they most likely to care about ROI and revenue / transaction figures. If you're presenting to another marketer, then they may care more about organic traffic, keyword visibility and other similar "SEO" metrics.
Also, group related metrics together, such as engagement metrics (bounce rate, avg. session duration, etc.) and on-page metrics (pageviews, time on site, etc.)
Hold on, what is that Goals widget you speak of?
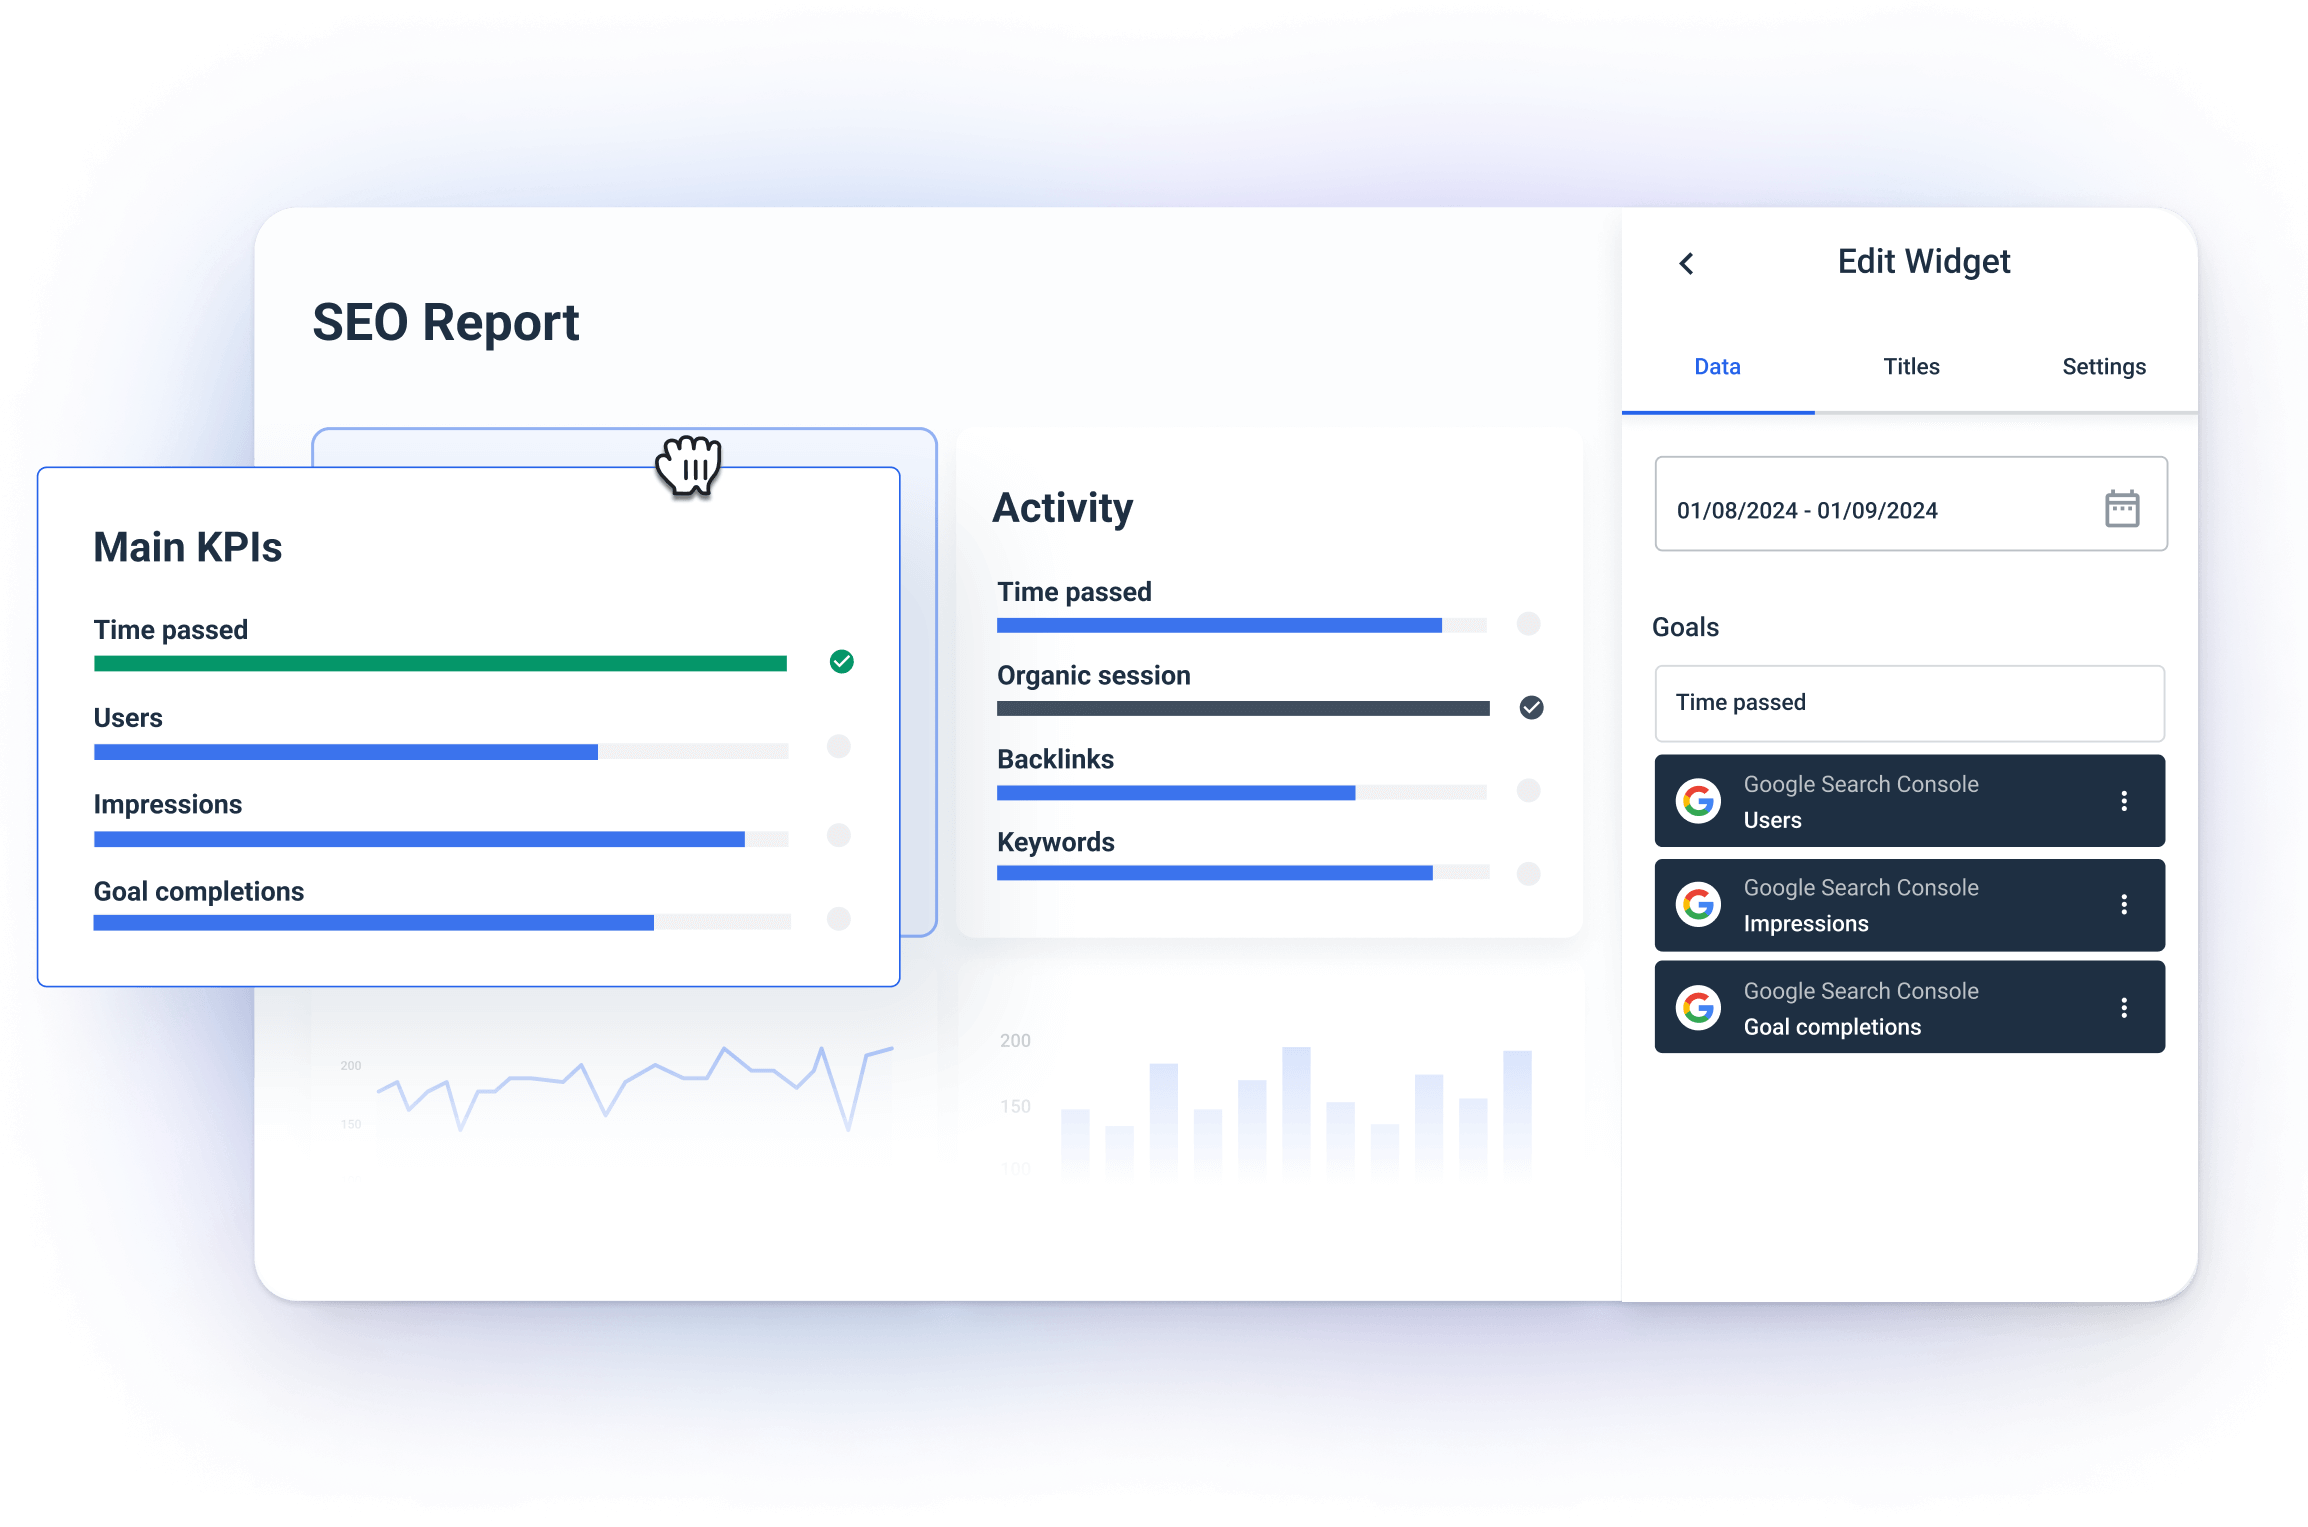
Whatagraph has developed a special Goals widget to track your campaign's progress toward its targets. For example, you can set up the goal to reach 1,000 conversions and track how far you are from achieving that.
The widget has a visual progress bar highlighting how your digital marketing efforts come up against set objectives.
You can create goals on any metrics to break up the monthly SEO performance targets into day-to-day action items.
Step 4. Organize SEO data for actionable insights
Ok. You connected all the sources. You tweaked the dashboard template just as your clients wanted it. However the actionable data is still scattered across the sources.
By actionable, we mean insights that can truly pinpoint any issues with your SEO strategy or brilliant examples you can try to replicate.
So, how can you bring those actionable insights together?
You need to organize your data.
Wait, that sounds familiar. Where have I heard that word?
Yes, in Whatagraph you can organize your scattered data so you can get insights in seconds.
How? In several ways.
- Custom metrics: Unify and change names of different metrics permanently in your dashboard or create a new metric using a simple formula.
- Custom dimensions: Unify names of different cross-channel dimensions and group data points from different sources.
- Data blending: Great for combining different sources together into one unified data source for getting quicker insights and keeping your dashboard neat.
The best part is that you can organize your data inside your dashboard. No need to go back and forth from one workspace to another.
Thanks to recently launched Performance Monitoring, you can get actionable insights from your data even faster.
You can:
- Group 100s of scattered data sources into unified Source Groups in seconds
- Add custom tags to your data and filter it by client, business type, location, Account Manager, etc.
- Visualize your key metrics in one view and easily spot performance trends
Step 5: White-label the dashboard with client branding
In Whatagraph, you have the option to personalize your SEO dashboard with your client’s brand colors, logo, and custom headings.
Alternatively, you can apply your agency’s branding so every dashboard you send looks like a part of your agency’s website.
This means your clients will immediately recognize your dashboard as a part of your brand. You can create a global theme for your agency or create multiple themes on the dashboard and even at the widget level.
You can also share your white label SEO dashboard on a custom domain and cut all ties to Whatagraph as the software provider. The client will be no smarter than to believe you custom-built the whole thing yourself.
Step 6. Provide a shareable link for client access
Most dashboard tools let you share live dashboards via links. This is a great feature for several reasons:
- Live access: Your clients can check for real-time updates without waiting for scheduled updates.
- Control permissions: With Whatagraph, you can set a password to make sure only the clients can view the dashboard.
- Mobile view: When the dashboard is mobile-friendly, the clients can open the link and check the status on the go.
With links to live dashboards, the whole process becomes transparent, while the clients get the flexibility to check their SEO performance at any time.
We create a dashboard that pulls data from all the data sources we use for our reports and do a video walkthrough the first time we present it. We always send the client a weekly update including the link to the dashboard and occasionally highlight items in the report in a video update.
Ready to build a sleek and fast SEO client dashboard?
Let’s talk and see how Whatagraph can help.
How to Structure Your SEO Agency Dashboard to Be Impactful
An organized dashboard should give you a clear view of the key metrics and goals so that both you and your clients can understand how the SEO stands.
Smith makes a good point here:
The structure of an SEO report should be tailored to the client depending on the KPIs, but as standard should always include an executive summary of performance, with subsequent sections that go into the key metrics.
We can’t agree more with him.
Here is a breakdown of must-have sections you should include in every SEO agency dashboard.
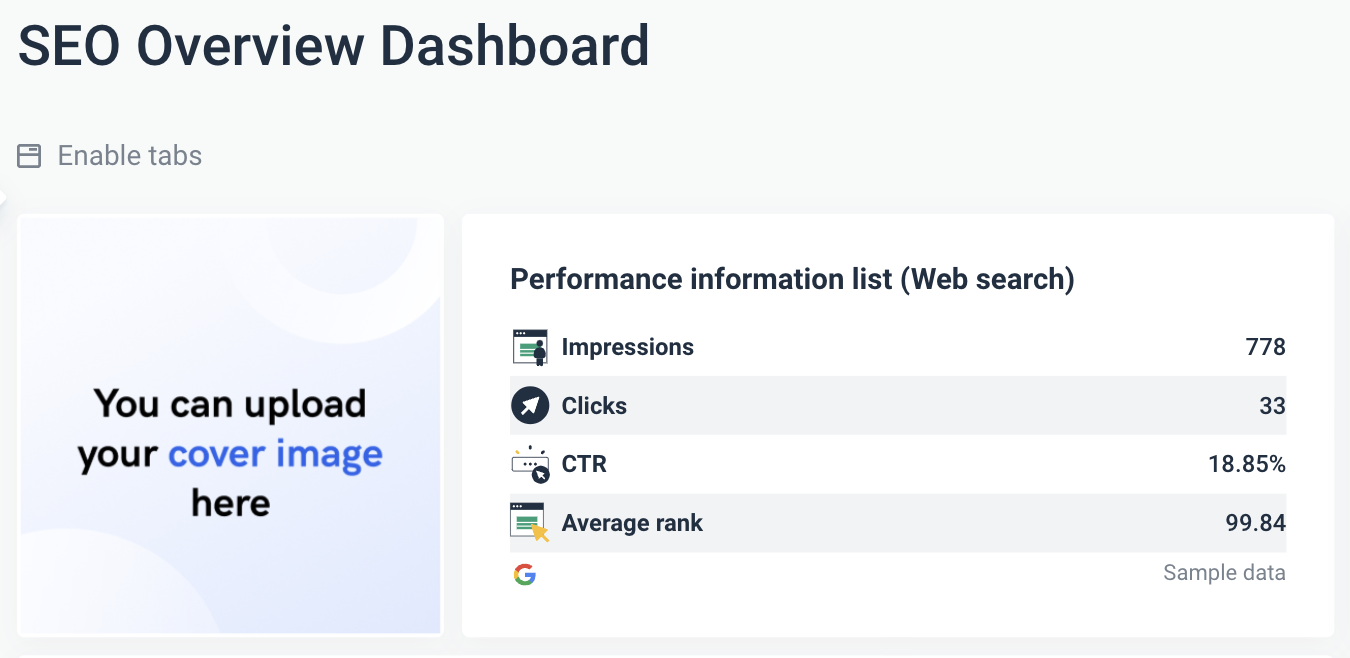
1. Cover image + search performance summary
A branded cover image doesn’t say much about your SEO performance but sets the tone for the entire dashboard. It makes it look sleek and professional.
Use your logo to strengthen your brand or your client’s branding to make them feel valued.
The performance summary widget takes a live snapshot of your key web search metrics, such as impressions, clicks, click-through rate (CTR), and average rank. It gives you quick information on how well the site is performing in search results.
2. Organic traffic
This section shows the organic traffic trend over a period. The chart makes it easy to monitor the ups and downs of organic visits.
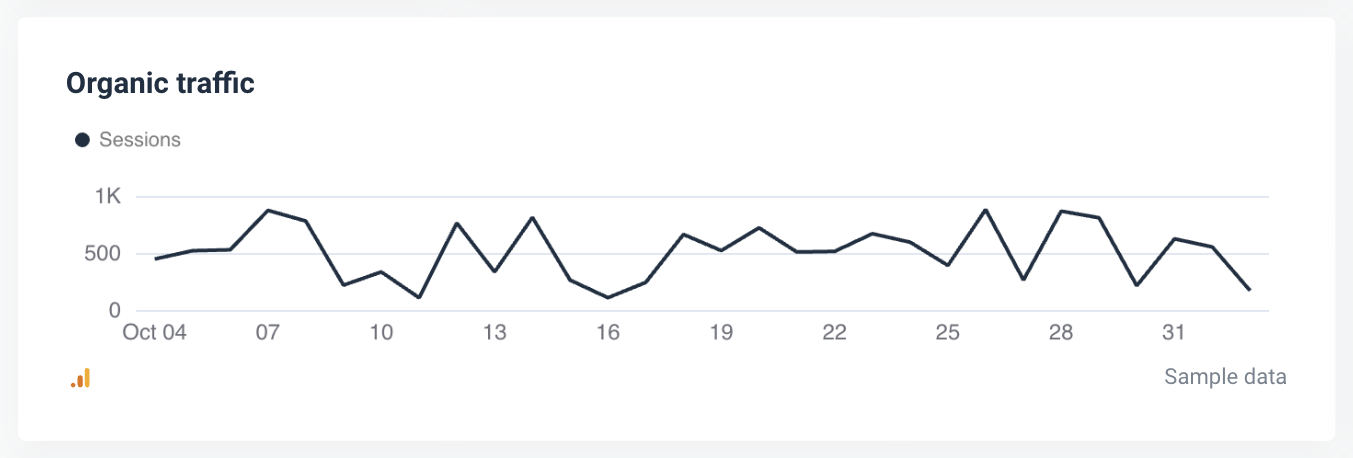
Use it to quickly identify patterns or changes in organic traffic, which you can link to specific events or campaigns.
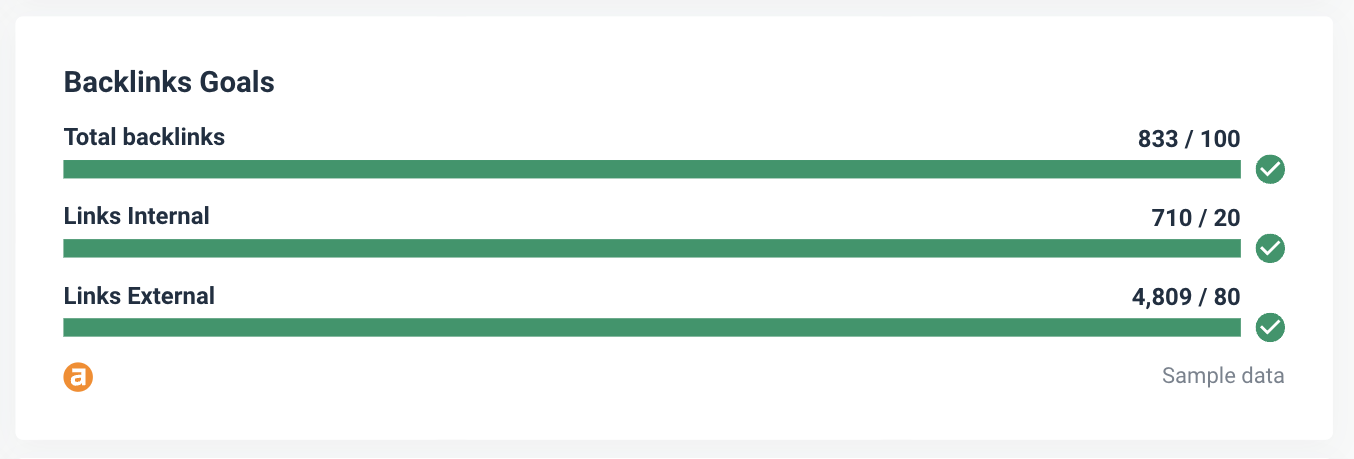
3. Backlinks
This section monitors backlink acquisition and shows how close you are to monthly or quarterly backlink goals. It’s especially useful for monitoring link-building strategies.
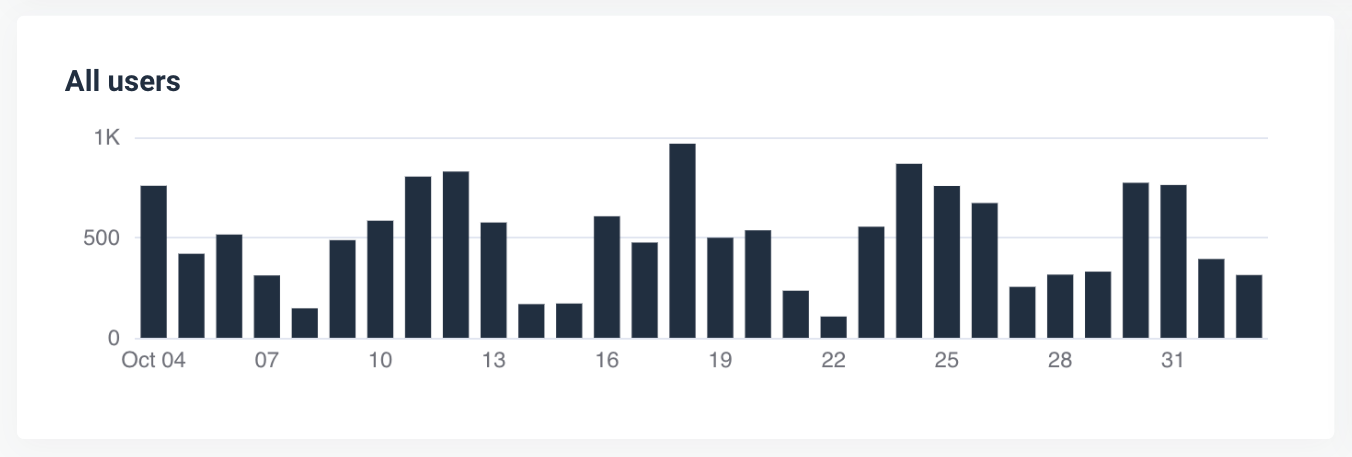
4. All users
The bar chart with all users distributed over the month lets you track the fluctuation of all visitors to your client’s site day by day. This GA4 metric includes both the visitors who bounced and those who engaged with the site.
5. Keyword performance
This table gives you detailed data on keyword performance, through impressions, clicks, CTR, and average rank for each target keyword.
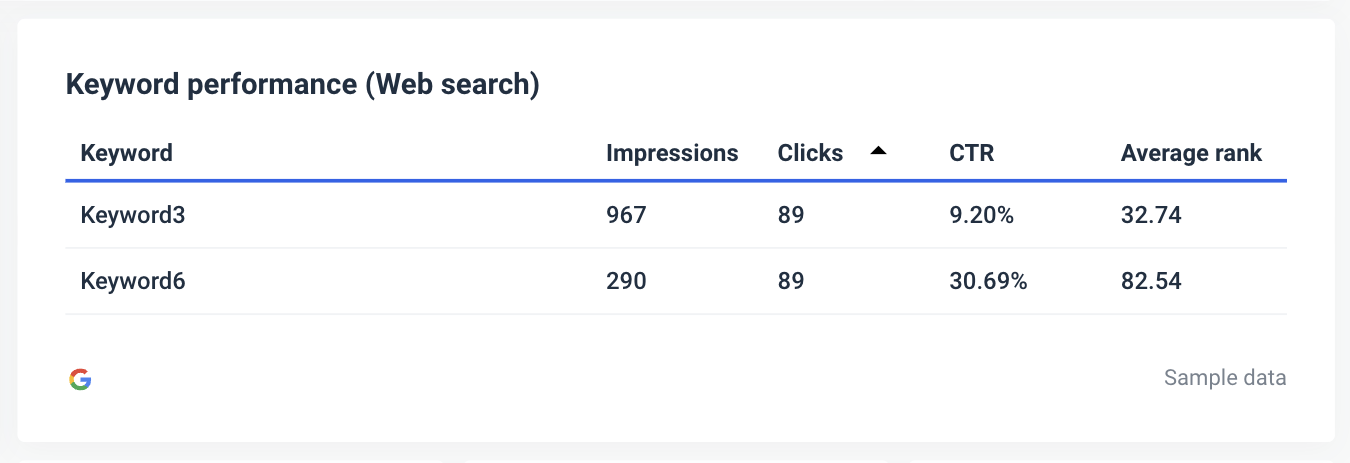
Use it to pinpoint high- and low-performing keywords, which helps you guide content and optimization efforts.
Your clients, on the other hand, can clearly see how effective your keyword strategy is.
Brannon gives an example of how tracking keyword performance impacts organic traffic in her business:
With RushOrderTees, "custom t shirts" is one of our most important, traffic driving head terms. Reporting on changes in performance here is most impactful in our reporting as it tends to have a direct impact on organic traffic and revenue when we rank highly on page 1 for this term.
6. Organic vs. new sessions
With this chart, you can easily compare organic sessions with the percentage of new sessions and get insight into audience growth and retention.

Measuring the effectiveness of your SEO in attracting new visitors is important for reaching new audiences. The balance between new and returning visitors shows how effective you are in retaining users and if your content is engaging enough.
7. Performance by page
This table lists key metrics such as sessions, users, bounce rate, and average session duration for individual pages. Your clients can see how each page contributes to overall performance.
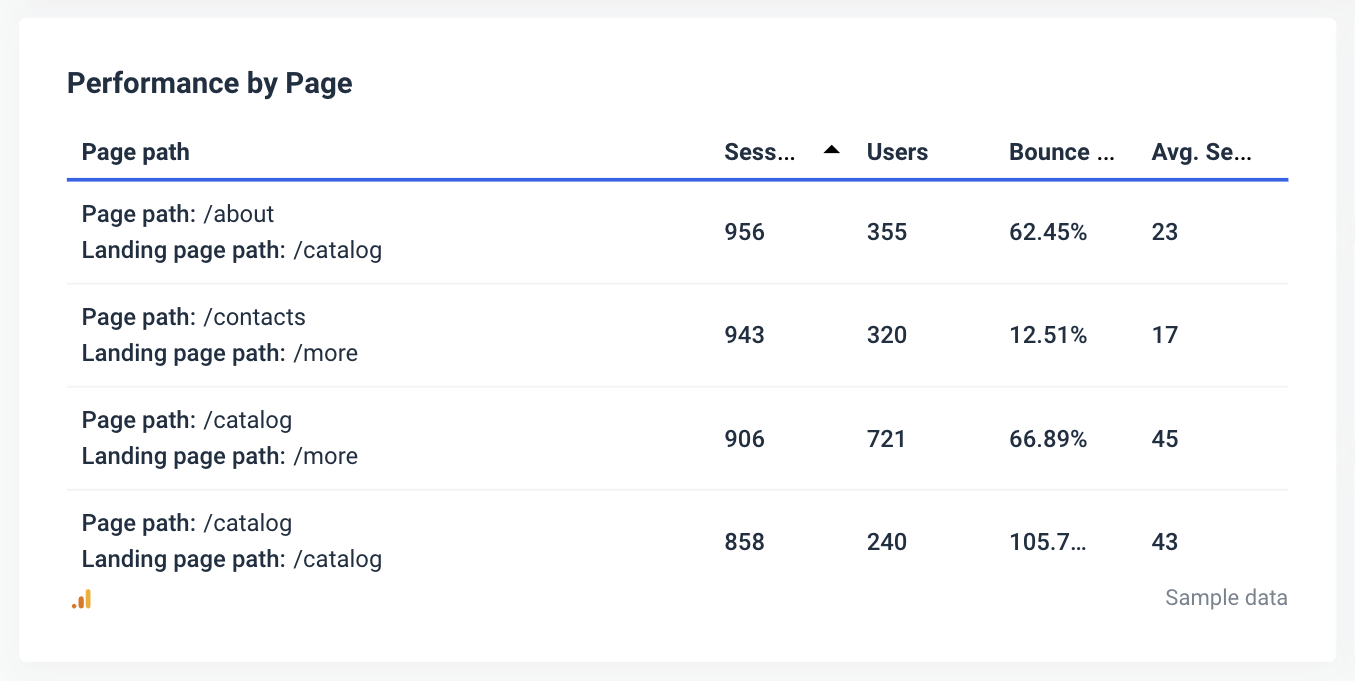
Apart from identifying high- and low-performing pages, it gives you a glimpse into user behavior on specific pages.
Using this insight, you can adjust the content strategy and improve the user experience.
You should take a closer look at all pages with high bounce rates or low session duration.
8. Single value widgets
Single value widgets come in handy for presenting SEO KPIs in an easily digestible format. In Whatagraph’s dashboards, you can move them around and group them in any way you want to display important metrics like goal completions, conversion rate, sessions, etc. 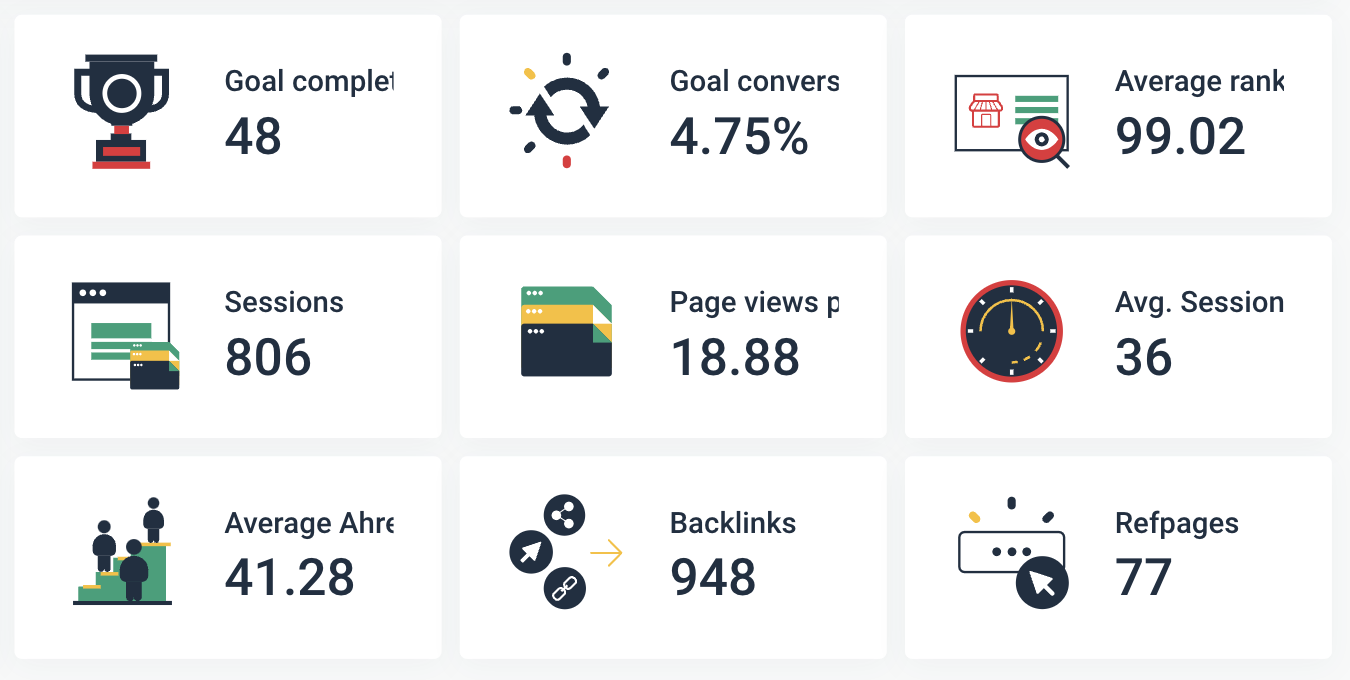
Which Metrics to Include in Your SEO Client Dashboard?
The metrics you include in your SEO client dashboard should help clients easily understand the impact of your efforts and the health of their site.
Most clients won't care about vanity metrics, such as impressions or an average position increase, but rather how the work that has been completed is driving more traffic and revenue for the business.The key metrics to include should always be traffic, rankings, conversions and revenue (where possible).
Below is a list of essential SEO metrics you should keep an eye on:
- Impressions: The number of times a page appears in search results. Use it to measure visibility in search engine results pages (SERPs). Although not all impressions result in clicks, a higher number of impressions may show growing brand visibility.
- Clicks: The total number of clicks a site gets from search engine results. The metric shows how often users pick your content over other results.
- Click-Through Rate (CTR): The percentage of impressions that result in a click. A high CTR shows that your client’s content is relevant and interesting to searchers. Improving CTR is as important as improving ranking.
- Average Rank: This metric shows the average ranking position of a client’s pages in SERPs. Knowing the average rank helps determine which keywords may need optimization for better visibility.
Brannon adds:
Top level metrics that I report on typically include organic traffic, organic transactions / revenue for eCommerce or conversions for lead gen, organic keyword visibility trends and positions of any main head terms.
- Organic Traffic: The number of visitors coming to a site from organic search results. The metric is a direct measure of how well SEO efforts are driving relevant, unpaid traffic to the client’s website.
- Keyword Rankings: The positions of specific keywords in search results. Monitoring keyword rankings helps clients see the effect of targeted optimizations and whether their site is gaining ground for critical search terms.
- Backlinks: The total number of external links pointing to the client’s site. As a key ranking factor, backlinks serve as a “vote of confidence” from other sites.
- Referring Domains: The unique domains that link to the client’s site. A high number of referring domains is usually a sign of a healthier link profile.
- Bounce Rate: The percentage of visitors who leave a site after viewing only one page. A high bounce rate may indicate that content isn’t meeting user expectations. For a complete guide on digital marketing metrics and KPIs, check out our article.
- Average Session Duration: The average amount of time visitors spend on the site. A higher session duration often means that your content is engaging and your website is easy to navigate.
- Pages per Session: The average number of pages a user views per session. This metric helps measure user engagement and relevance of your content.
- Ahrefs Rank (or similar authority metric): This is a domain authority metric that is calculated by tools like Ahrefs based on backlinks and domain strength.
- Organic Sessions vs. % New Sessions: This metric compares organic sessions with the percentage of sessions from new visitors. It shows the effectiveness of your SEO in bringing in fresh traffic.
- Top Landing Pages: The pages where users first enter the site. Knowing the top entry points helps identify the pages that drive the most traffic and engagement.
To sum it all up, Brannon shares three rules she always sticks to in her agency:
1. Know what's important to the client and only include what's necessary. 2. Avoid meaningless metrics and refine your SEO dashboard to show only the most important areas that tie back to defined KPIs. 3. Avoid Confusing layouts. Your SEO report should tell a story.
Are you ready to tell the story of your SEO results in a way your clients can understand?
Talk to us and let’s find together how you can make the most out of your marketing data.
Not sure we’re the right choice for you? Compare Whatagraph with competitors and make your decision with more confidence.

WRITTEN BY
Nikola GemesNikola is a content marketer at Whatagraph with extensive writing experience in SaaS and tech niches. With a background in content management apps and composable architectures, it's his job to educate readers about the latest developments in the world of marketing data, data warehousing, headless architectures, and federated content platforms.