12 Best Social Media Analytics Tools to Save Time in 2026
The best social media analytics tools do two things well - they save you time on the reporting and scheduling work you're doing manually right now, and they help you actually understand what your numbers mean.
This guide compares 12 platforms so you can find the right one for your brands, channels, and budget without sitting through sales demos.

May 03 2026●12 min read


- What to look for in the best social media analytics tool
- 12 Best Social Media Analytics Tools in 2026
- 1. Whatagraph
- 2. Metrics Watch
- 3. Keyhole
- 4. Google Analytics 4
- 5. Sprout Social
- 6. Buffer
- 7. Hootsuite
- 8. Brandwatch
- 9. Rival IQ
- 10. Zoho Social
- 11. Mentionlytics
- 12. BuzzSumo
- How to choose a social media analytics tool
According to Sprout Social's 2024 Index, 73% of marketers say social media analytics directly influence their overall strategy - yet most teams still stitch together reporting manually across disconnected platforms.
That's exactly the problem social media analytics tools solve.
The core job of a social media analytics tool is to pull data from all your disconnected platforms into one place - accurately and reliably. Only then you’ll be able to analyze your social media data and make data-driven decisions you are confident in.
That being said, not all tools are equal though.
What to look for in the best social media analytics tool
We looked at what marketers actually ask when choosing a tool.
The pattern is consistent: people want two things. They want to spend less time on the admin side of social media management and they want to actually understand what the numbers mean for their strategy - not just see them.
Like this Reddit user in r/SocialMediaManagers:
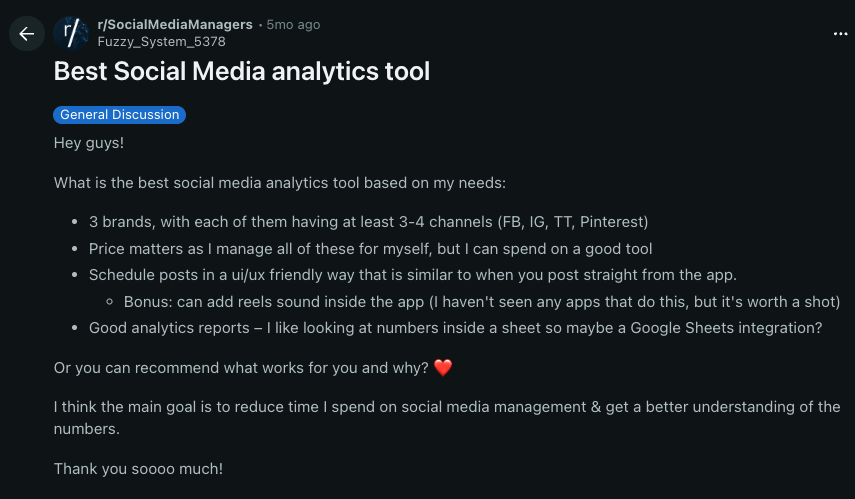
Here's how those needs translate into practical criteria:
What you need | The question to ask |
| Multi-brand, multi-channel coverage | Can I manage 3+ brands, each with FB, IG, TikTok, and Pinterest, without switching between platforms? |
| Data accuracy and reliability | Are the numbers consistent with what I see in native platform analytics, and can I confidently make decisions based on the data? |
| Time savings through scheduling and automation | Can I schedule posts with a UI that feels like posting natively, and automate report delivery? |
| Numbers that make sense | Does the tool turn raw data into something I can actually act on - not just a data dump? |
| Flexible data export and automation | Can I get my data into Google Sheets or export it in a format my team already uses? Can I automate reports to stakeholders? |
| Pricing transparency | Am I paying for features I'll actually use, at a price that makes sense for my account count? |
12 Best Social Media Analytics Tools in 2026
We meticulously selected tools that fit these criteria, and here's a summary of them:
- Whatagraph
- Metrics Watch
- Keyhole
- Google Analytics 4 (GA4)
- Sprout Social
- Buffer
- Hootsuite
- Brandwatch
- Rival IQ
- Zoho Social
- Mentionlytics
- BuzzSumo
2026 comparison table: social media analytics and reporting tools at a glance
Tool | Best for | Starting price (monthly) | Free plan | Cross-channel analytics | AI features |
| Whatagraph | Marketing agencies managing multiple clients and channels | $229/mo (billed annually) | Yes (5 sources) | Yes | Yes (Whatagraph IQ) |
| Metrics Watch | Email-first reporting | $49/mo (Reports) | No (14-day trial) | Yes | No |
| Keyhole | Influencer and hashtag tracking | Custom (via Muck Rack) | No (trial on request) | Limited | Yes |
| Google Analytics 4 | Website traffic from social | Free | Yes | No | Yes (predictive) |
| Sprout Social | Mid-size to enterprise teams | $199/mo per seat | No (30-day trial) | Yes | Yes (Trellis AI) |
| Buffer | Content scheduling with basic analytics | Free / $6/mo per channel | Yes | Limited | Yes (captions) |
| Hootsuite | Multi-network publishing and monitoring | $99/mo per user | No (30-day trial) | Yes | Yes (Yeti AI) |
| Brandwatch | Social listening and consumer intelligence | Custom | No | Yes | Yes (Iris AI) |
| Rival IQ | Competitive benchmarking | $169/mo | No (14-day trial) | Yes | Yes |
| Zoho Social | SMBs and growing brands | Free / $15/mo | Yes | Limited | Yes (Zia AI) |
| Mentionlytics | Brand monitoring across languages | $69/mo (billed annually) | No (free trial available) | Yes | Yes (emotion analysis) |
| BuzzSumo | Content research and influencer discovery | $199/mo (billed annually) | No (30-day trial) | Limited | Yes |
Let's dig into each one.
1. Whatagraph
Whatagraph is the marketing intelligence and social media analytics platform built specifically for agencies and marketing teams (not data scientists).
If the two things you want are to spend less time on reporting and to actually understand what your social data means - not just download a CSV of numbers - Whatagraph is built for exactly that.
In fact, agencies like Maatwerk Online are already saving 100 hours a month on reporting thanks to Whatagraph. Lars Maat, Co-Founder of the agency says:
Whatagraph saves time and energy for our marketing specialists. And the hours we’re saving is just pure profit. We now have the time to focus on more strategic things that help both our agency and our clients grow.
Read the full case study here.
Here’s how Whatagraph stacks up across the must-have features:
Can I manage multiple brands across FB, IG, TikTok, and Pinterest in one place?
Yes.
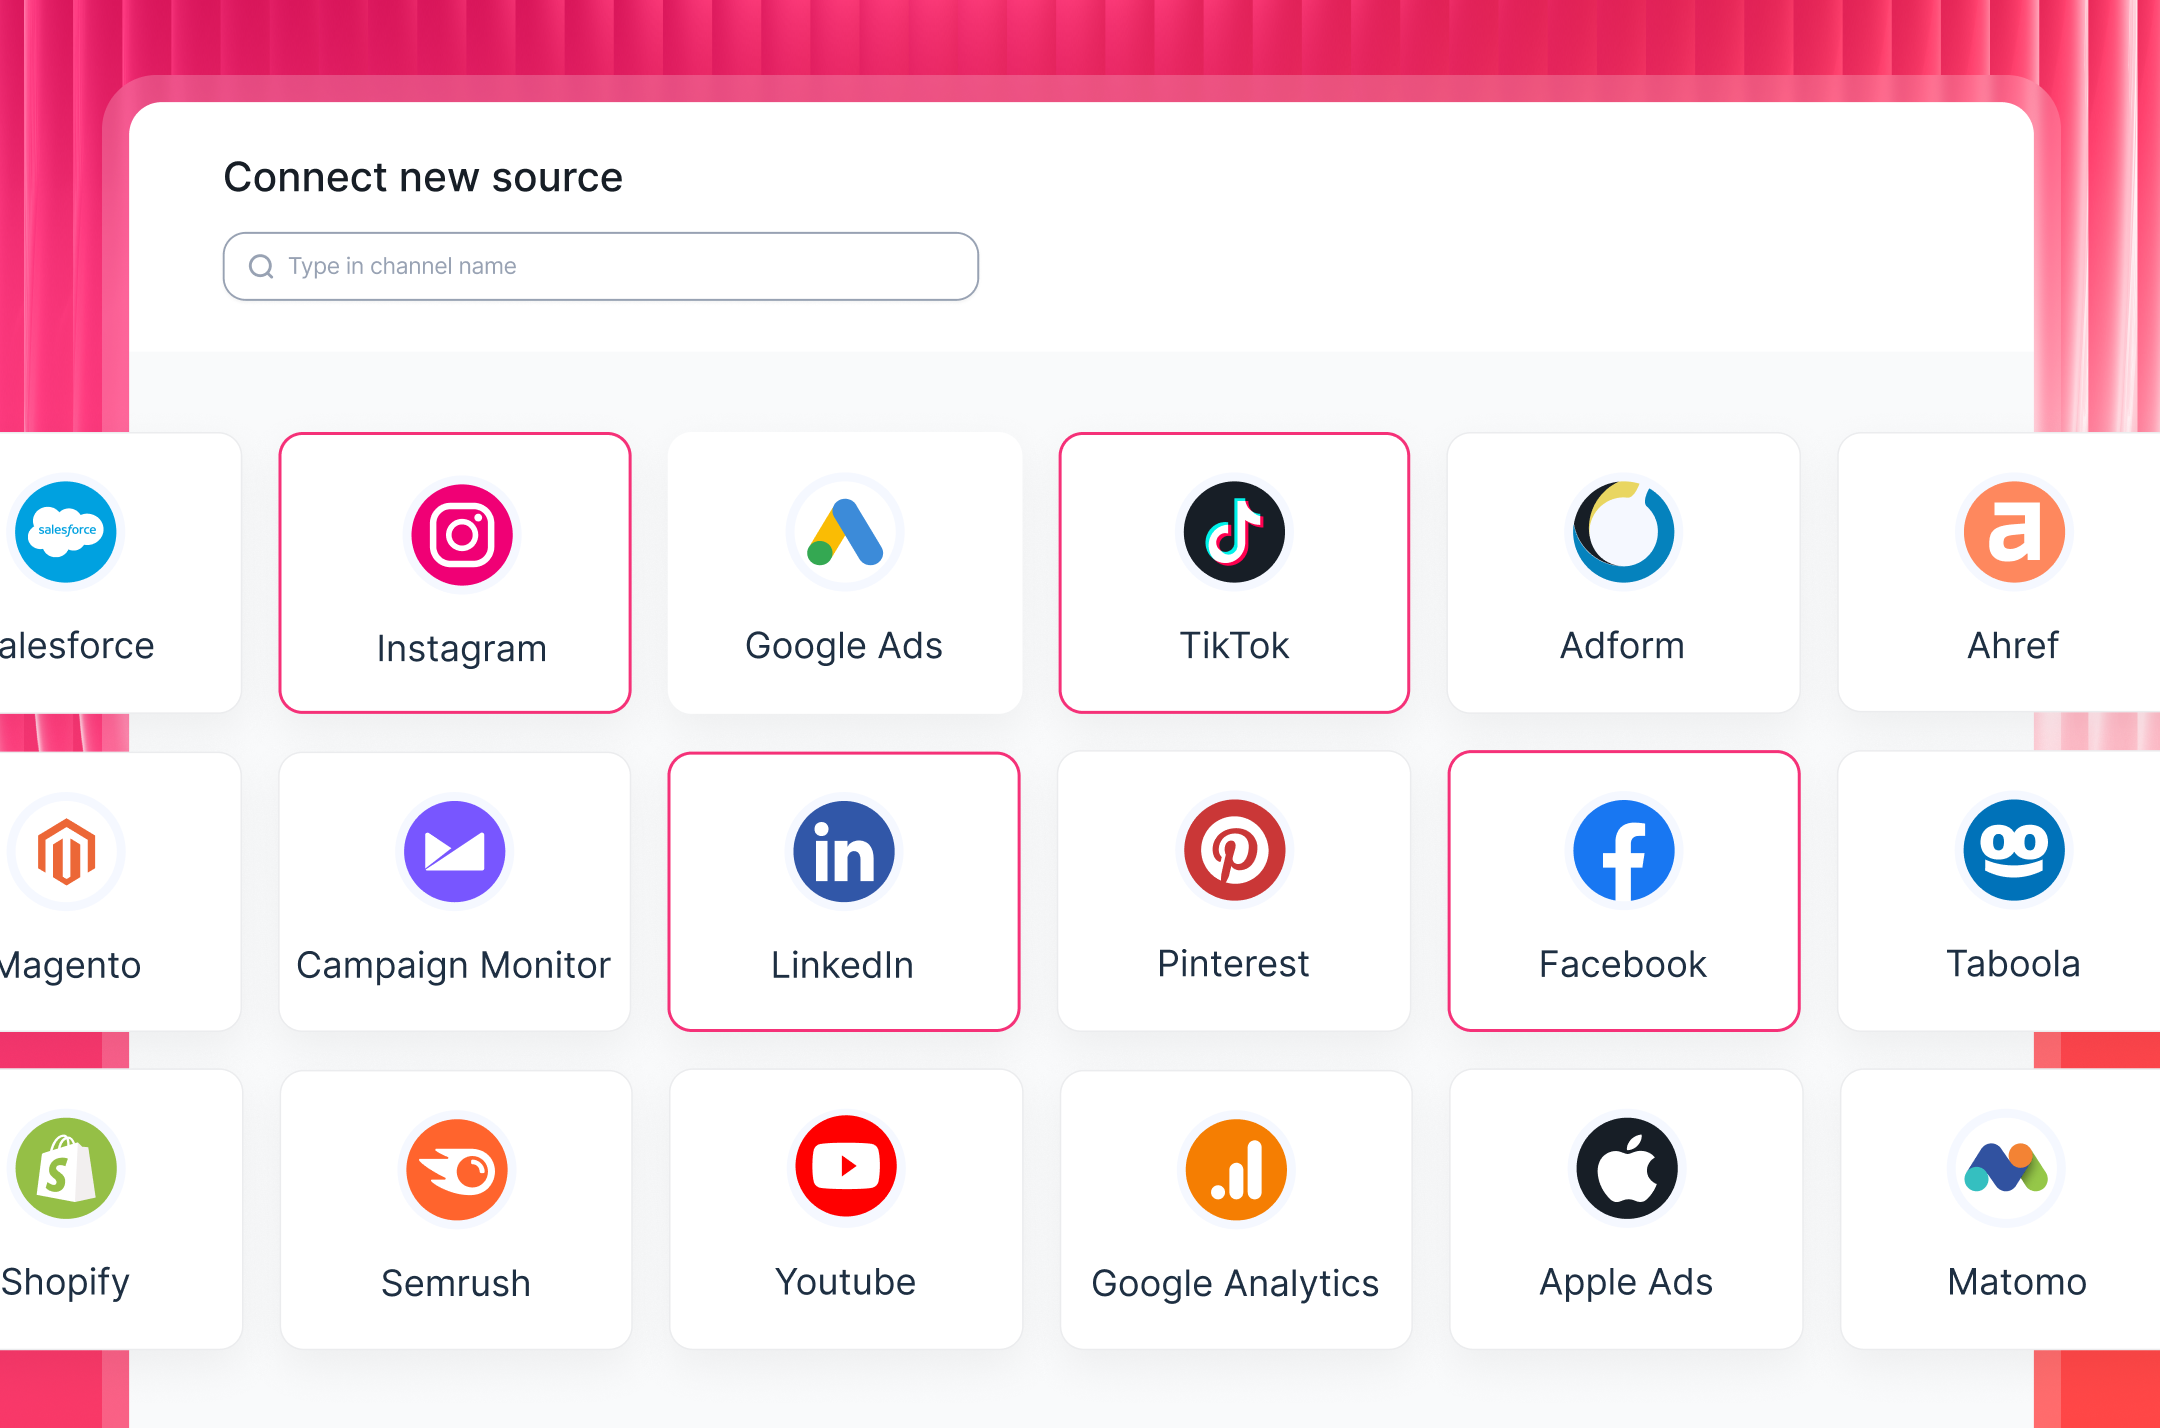
You connect organic and paid social media accounts through native integrations that Whatagraph's product engineers maintain in-house - so you're not babysitting broken connections. Facebook Pages, Instagram Business, TikTok, LinkedIn Pages, YouTube, and Pinterest all connect natively, as do Meta Ads, TikTok Ads, and LinkedIn Ads.
If you're managing 3 brands each with 4+ channels, Spaces gives every brand its own environment with its own dashboards, permissions, and data sources.
No more digging through a single cluttered workspace to find one client's Instagram data. Each Space is self-contained, and you can switch between them in a click.
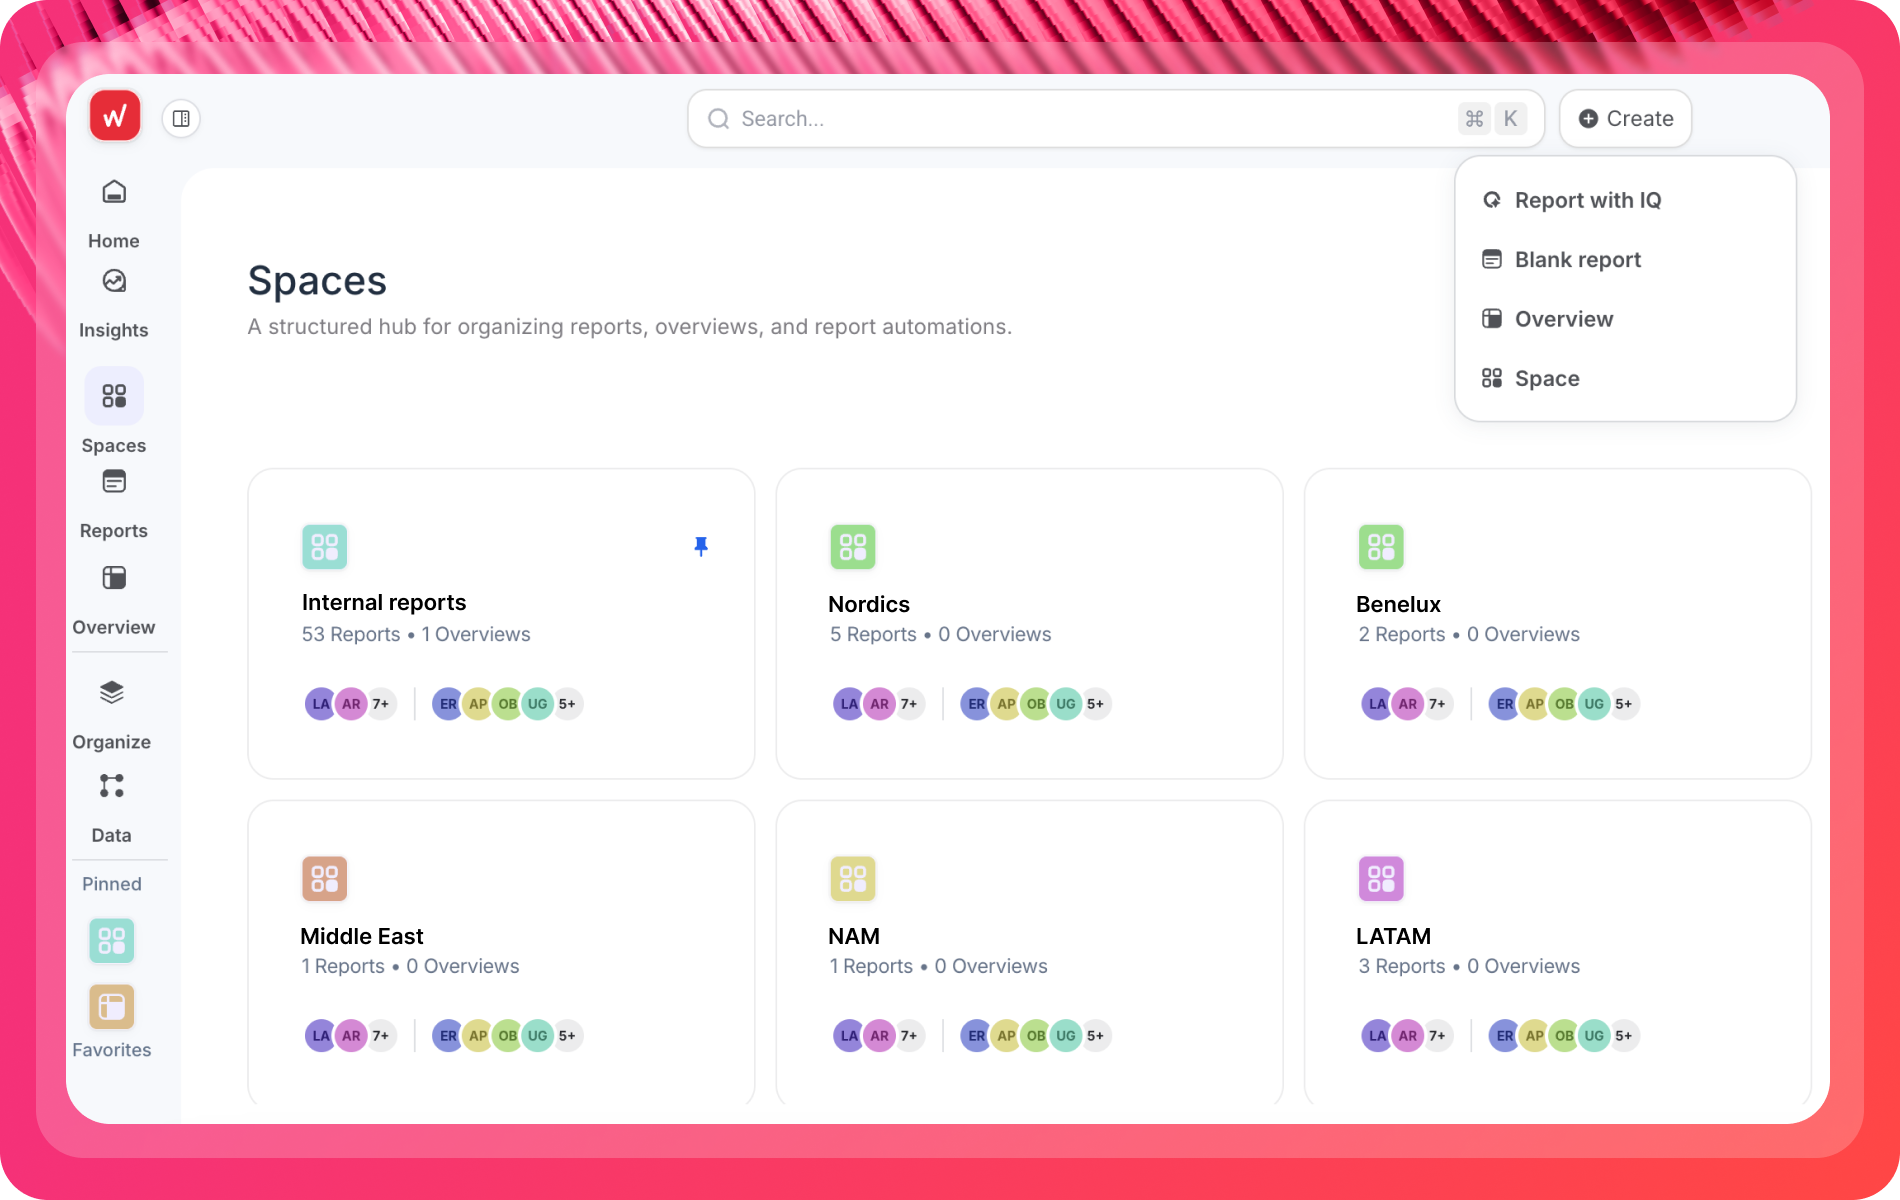
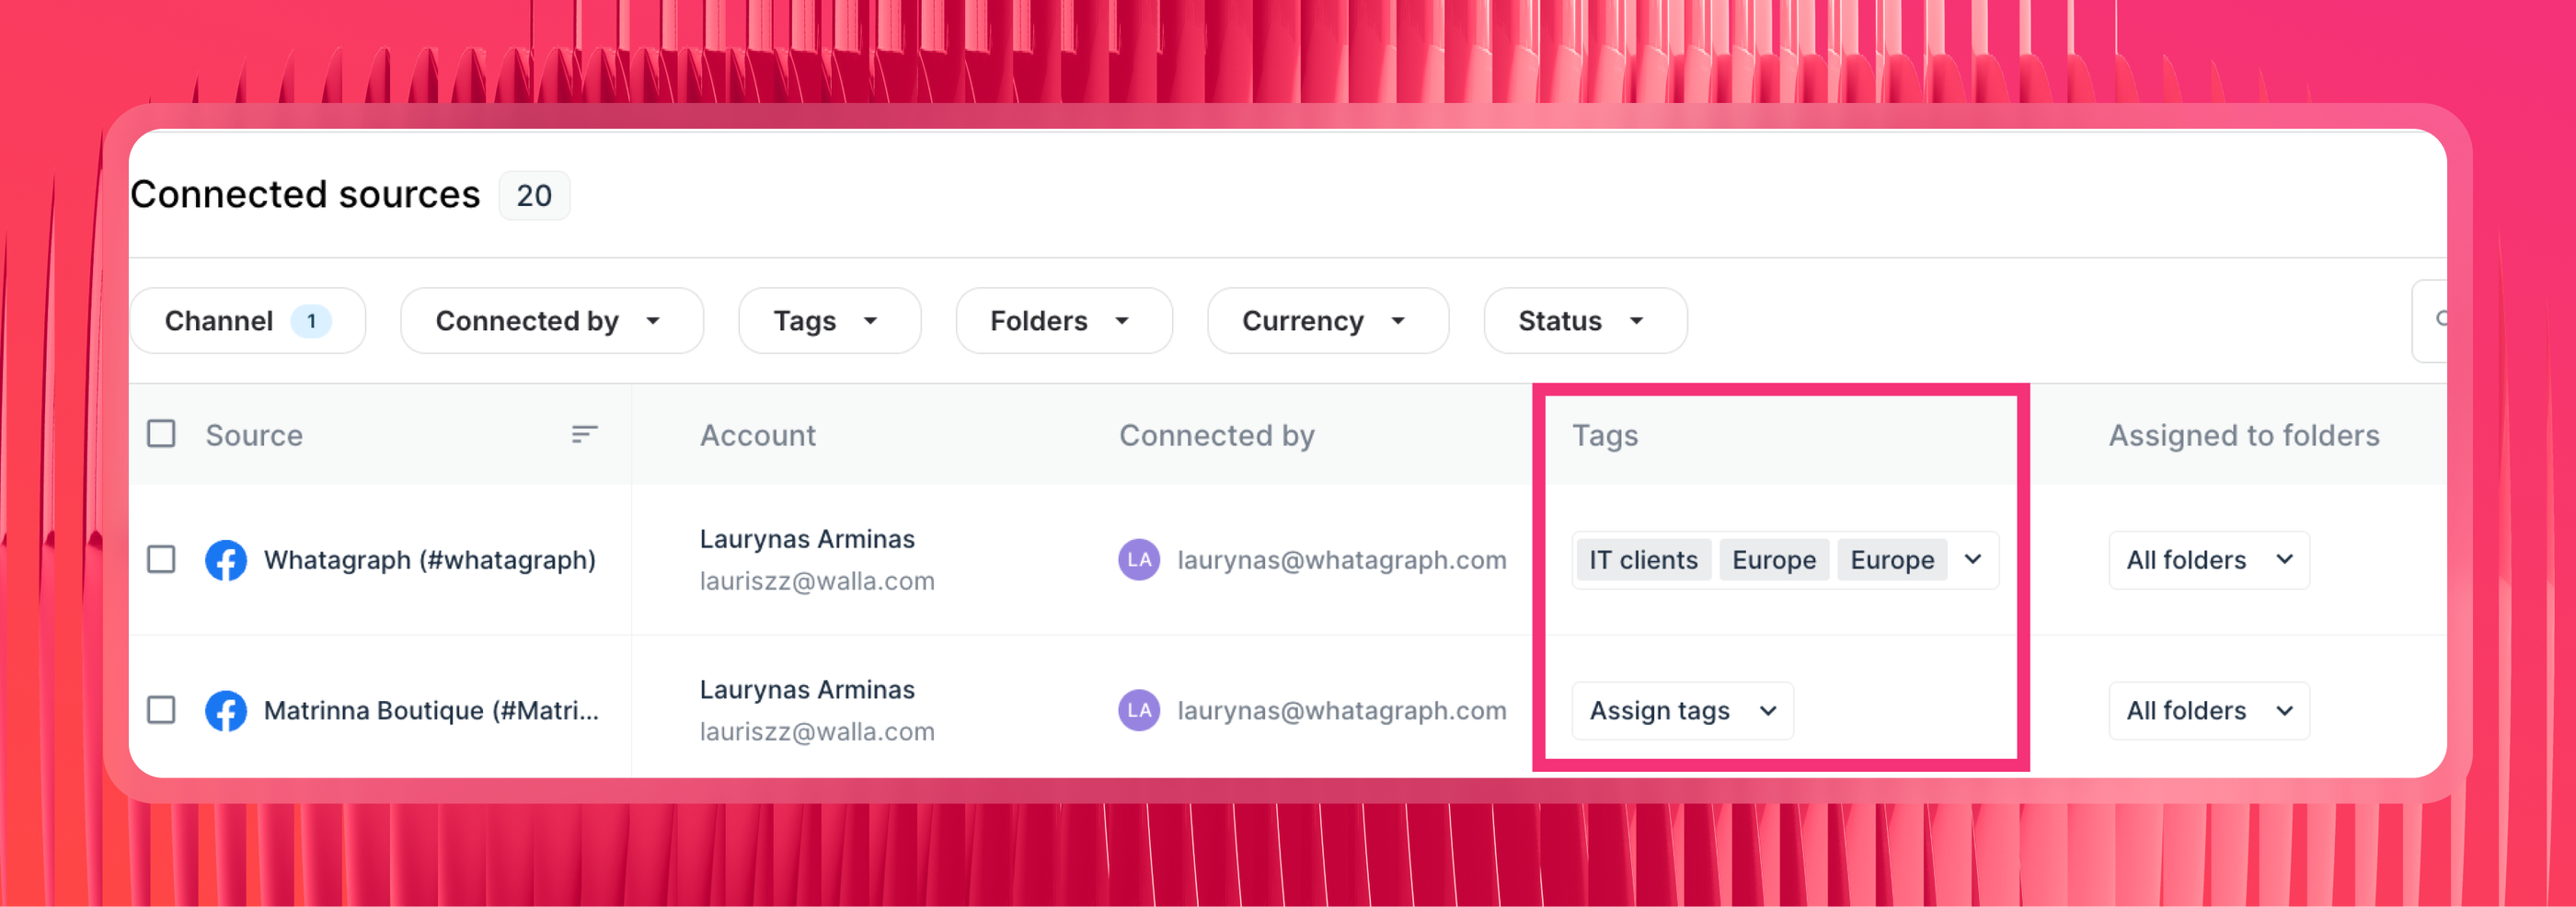
Within Spaces, you can add custom tags to each data source - for example, client, campaign, or location, so you can easily analyze performance by specific condition.
Want to see the total numbers for all your social media channels?
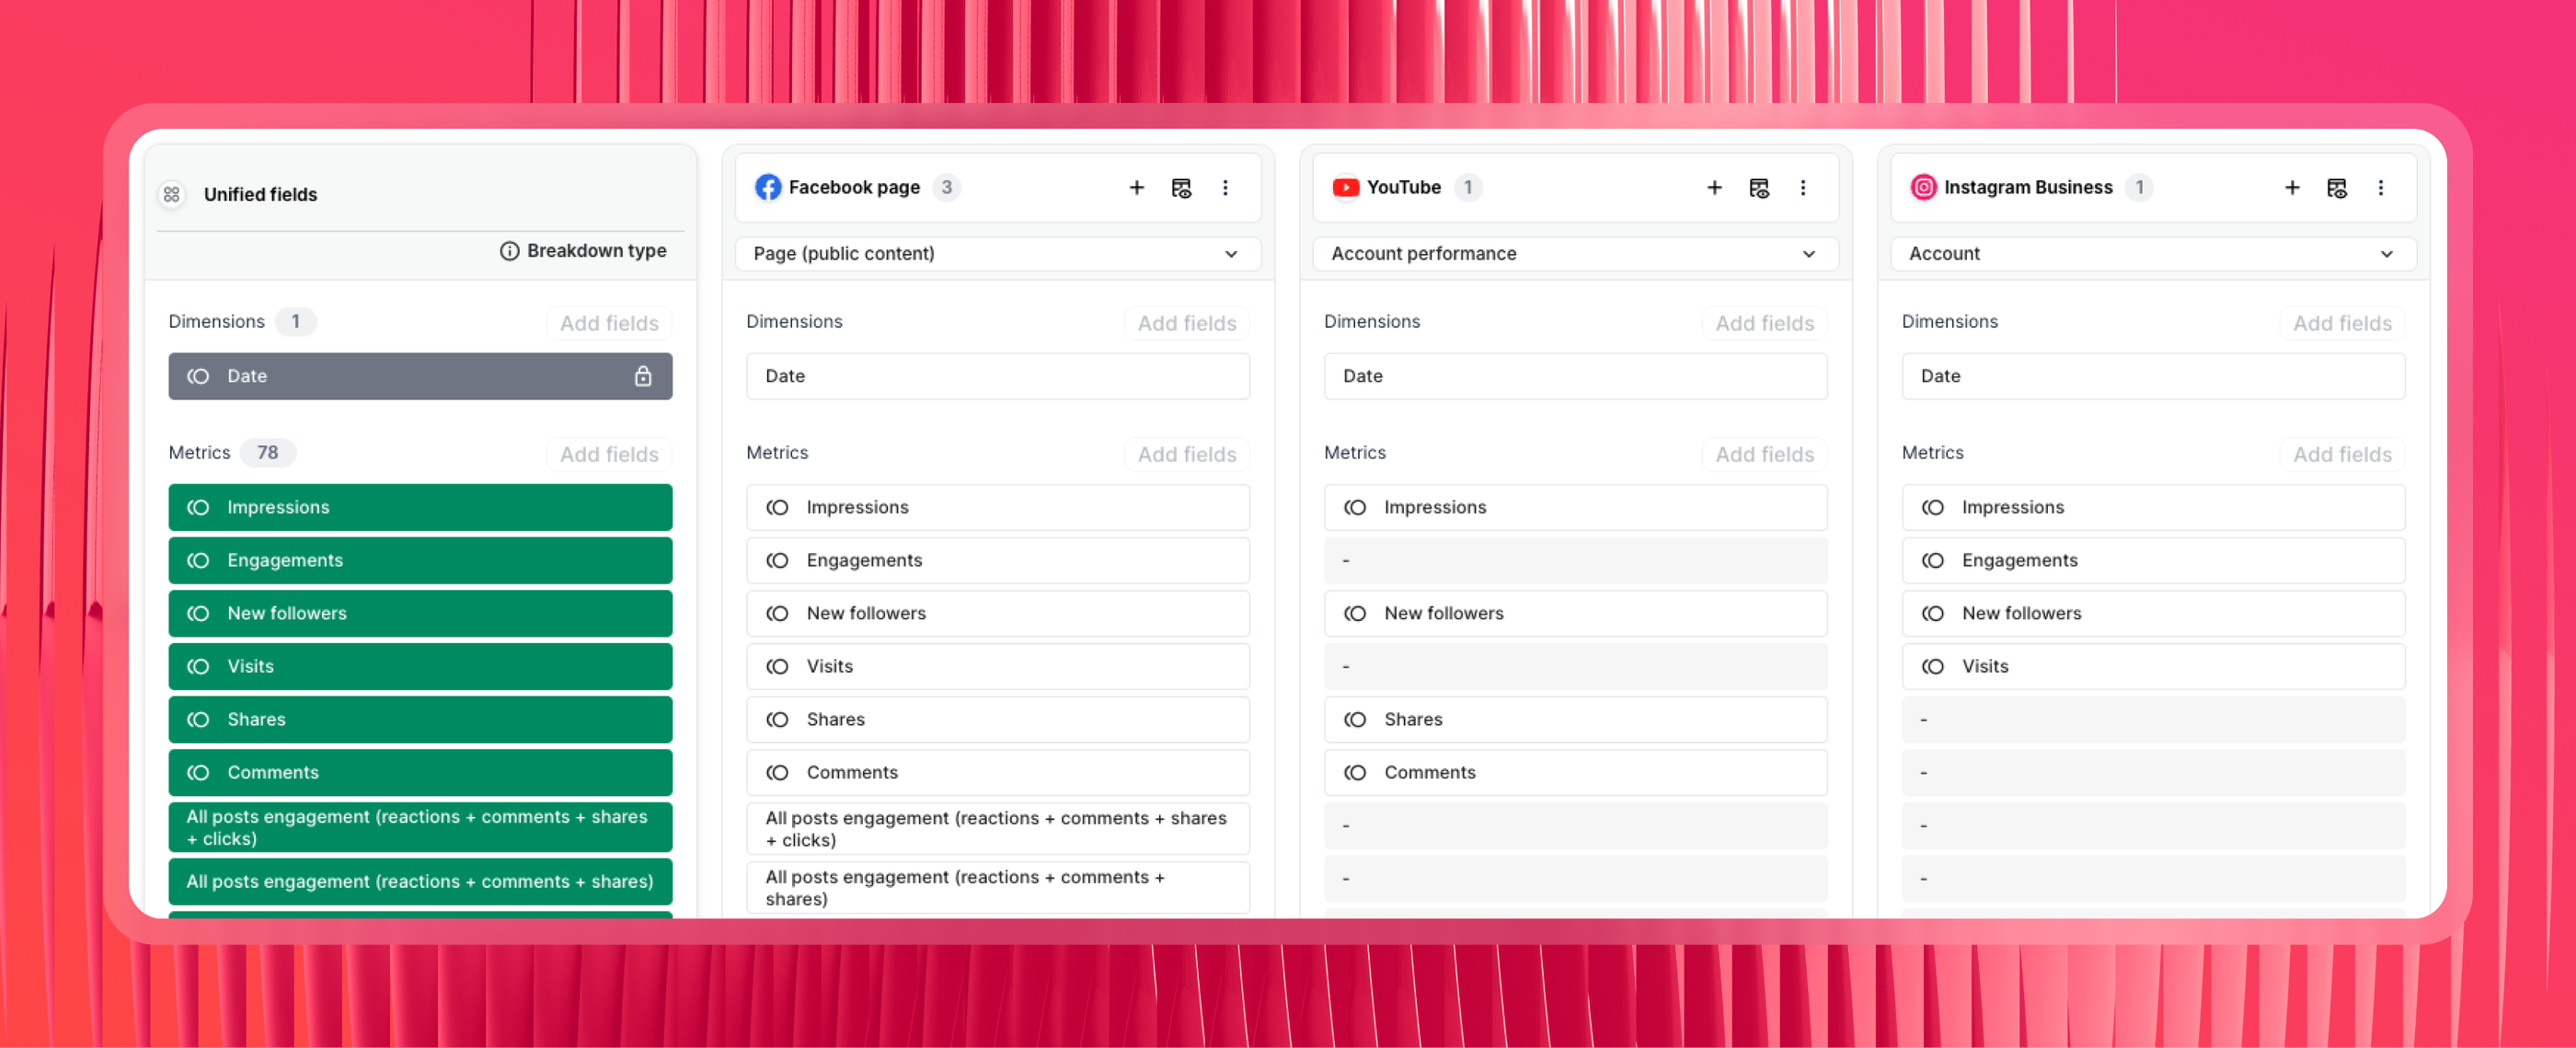
You can create “Source Groups” which basically blends data across all your channels (e.g. Facebook + Instagram + TikTok) into unified social media metrics (e.g. Total Impressions). You don’t need to write any codes and it takes seconds to set up.
In fact, this unified dashboard approach is what led Tanja Keglić, Performance Marketing Manager at Achtzehn Grad, to become a Whatagraph-convert:
The biggest reason we chose Whatagraph was because of its holistic approach to reporting. We can blend data from different channels and see in one view what's the performance and what needs to be changed.
Read the full case study here.
Quick tips:
- Don’t blend organic and paid into one dataset. Keep them separate and compare at the summary level.
- Save the custom metrics, dimensions, and blends as “Team Template” so everyone on your team can reuse them easily the next time.
Is the data actually accurate and consistent with what I see in native platforms?
This is the question social media managers ask most often - and it's the right one. Without data accuracy as a baseline, the analysis you do will be incorrect and you won’t be able to trust the decisions you make as a result of the analysis.
Before switching to Whatagraph, Kim Strickland, Digital Marketing Specialist at Peak Seven, dealt with exactly this problem.
Her agency used Looker Studio and Funnel, and reporting was a constant struggle - broken connections, double-counted conversions, and inaccurate metrics that required manual cross-checking against the source platforms every time.
This changed when she switched to Whatagraph.
“With Whatagraph, it's so much easier. The data always matches what we're seeing on the platforms,” Kim explained.
That's possible because Whatagraph's integrations are fully-managed and native - meaning the product engineering team maintains and monitors them in-house, rather than routing through a third-party connector layer.
When a platform changes its API, Whatagraph handles the update. You don't log in on Monday to find a broken connection and a gap in your client's data.
The biggest win Kim saw with Whatagraph was client trust: the dashboards became accurate enough that Peak Seven now uses them in new client pitches as proof of their reporting standard. Kim shared:
Whatagraph is now our Bible - both for clients and internal teams. With Whatagraph, you'll find accuracy, transparency, and ease of use. It's built for agencies like us - to save time and report to clients the way we want to.
Can I save time on building social media marketing reports?
The short answer: yes.
The long answer: with Whatagraph IQ, you can literally just type in a prompt (e.g., "Create an Instagram report showing engagement rate and follower growth for the last 30 days") and we'll build a complete report for you, with the exact widgets, charts, and tables you need.
No manual work or complex technical setups needed.
Just connect your data sources and give specific prompts. We handle the rest. And this entire process, from start to finish, only takes minutes.
Try it out for yourself here:
If you’d rather have full control over the design and layout, start from a blank canvas and drag-and-drop pre-made widgets onto it.
Or if you’d like to get started with a pre-defined structure and KPIs that you can simply swap out your data with, check out these FREE report templates:
- Holistic social media report template (includes Instagram, Facebook, and YouTube)
- Facebook report template
- Instagram analytics report template
- Youtube report template
- LinkedIn analytics report template
Now comes my favorite part. To style your social media report, simply upload a screenshot of the color scheme you want to use, or type in a custom prompt.
Whatagraph automatically detects the colors and fonts in the image and applies it to your report instantly.
Fine-tune the colors and fonts as needed and once you’re satisfied, save it as a “Global theme” to reuse it the next time.
It’s literally so easy, it’s mindblowing.
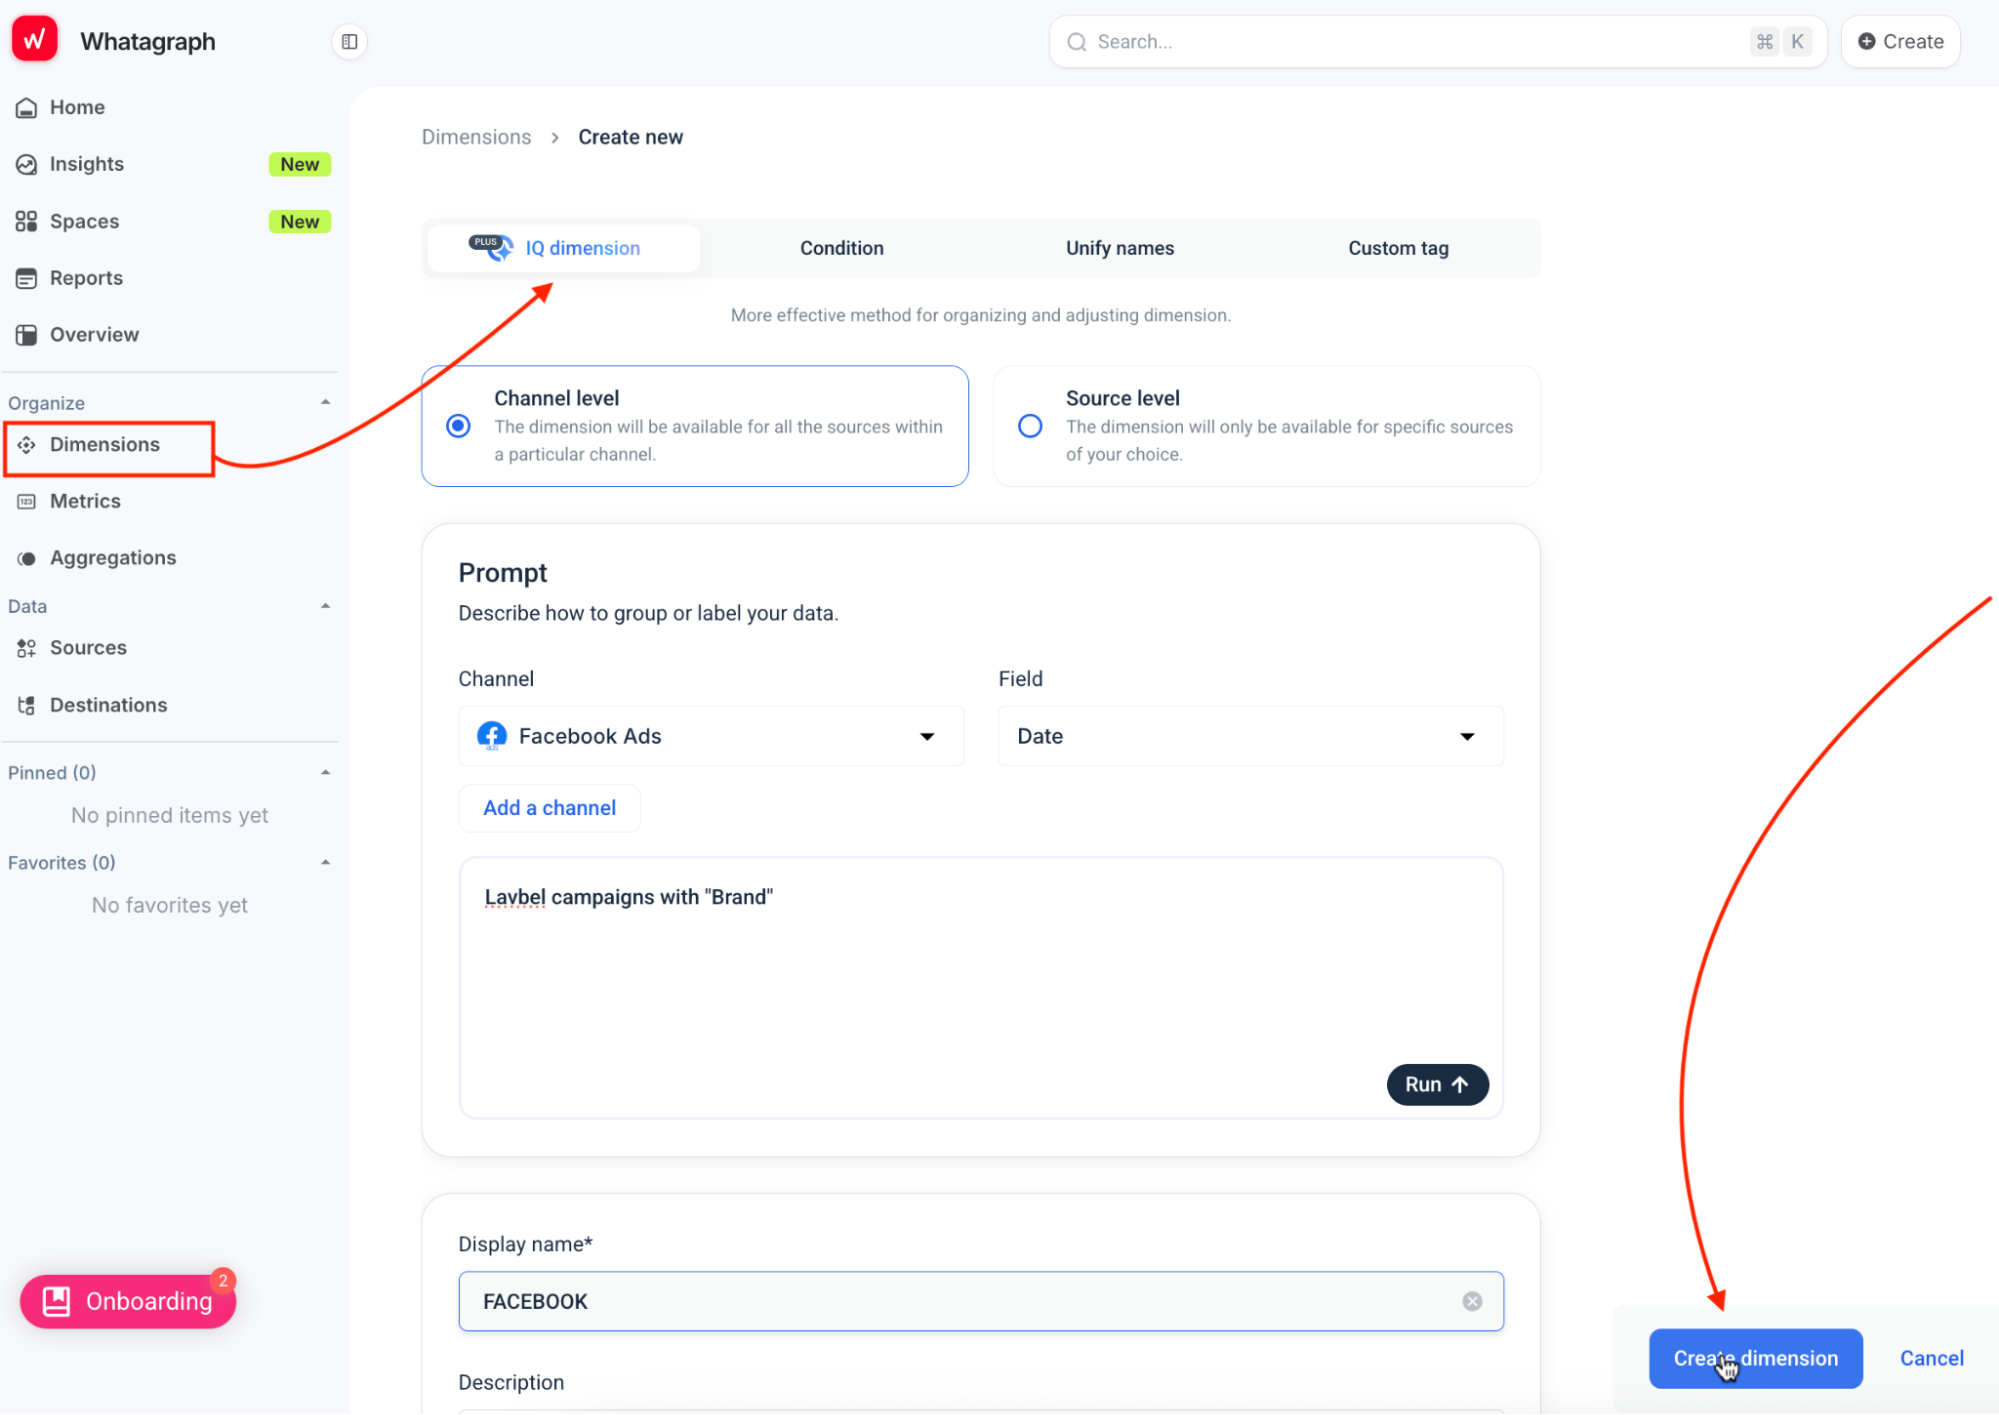
Managing naming conventions across platforms is usually a coding task. Not with IQ Dimensions.
Normalize and categorize messy data fields using natural language prompts, instantly making your data clean and consistent for analysis without any manual effort or code.
For example, if your Meta campaigns include inconsistent naming (‘Brand Awareness | IG’ vs. ‘IG_Brand_Awareness’), IQ Dimensions instantly groups them under one clean label.
All of these means you can:
✅ Easily create complete social media reports without needing any technical expertise
✅ Save hours on report creation
✅ Have more time and energy to focus on more important tasks
Bonus: Here are some micro-prompts you can use (copy/paste):
- Create report with IQ: “Build a monthly social media report for Brand A, compare to last month. Show organic vs paid performance, top content, and recommended next steps.”
- IQ Theme: “Create a clean light theme with charcoal text and a bold accent pulled from the uploaded logo.”
- IQ Dimensions (post type): “Group post types as Video, Carousel, Static, Story, Reel across Meta, Instagram, TikTok, LinkedIn, YouTube.”
Do the numbers actually make sense, or is it just data?
The point of analytics isn't data - it's understanding. With Whatagraph, you’ll get three main ways of understanding your numbers - for yourself, your team, and your clients.
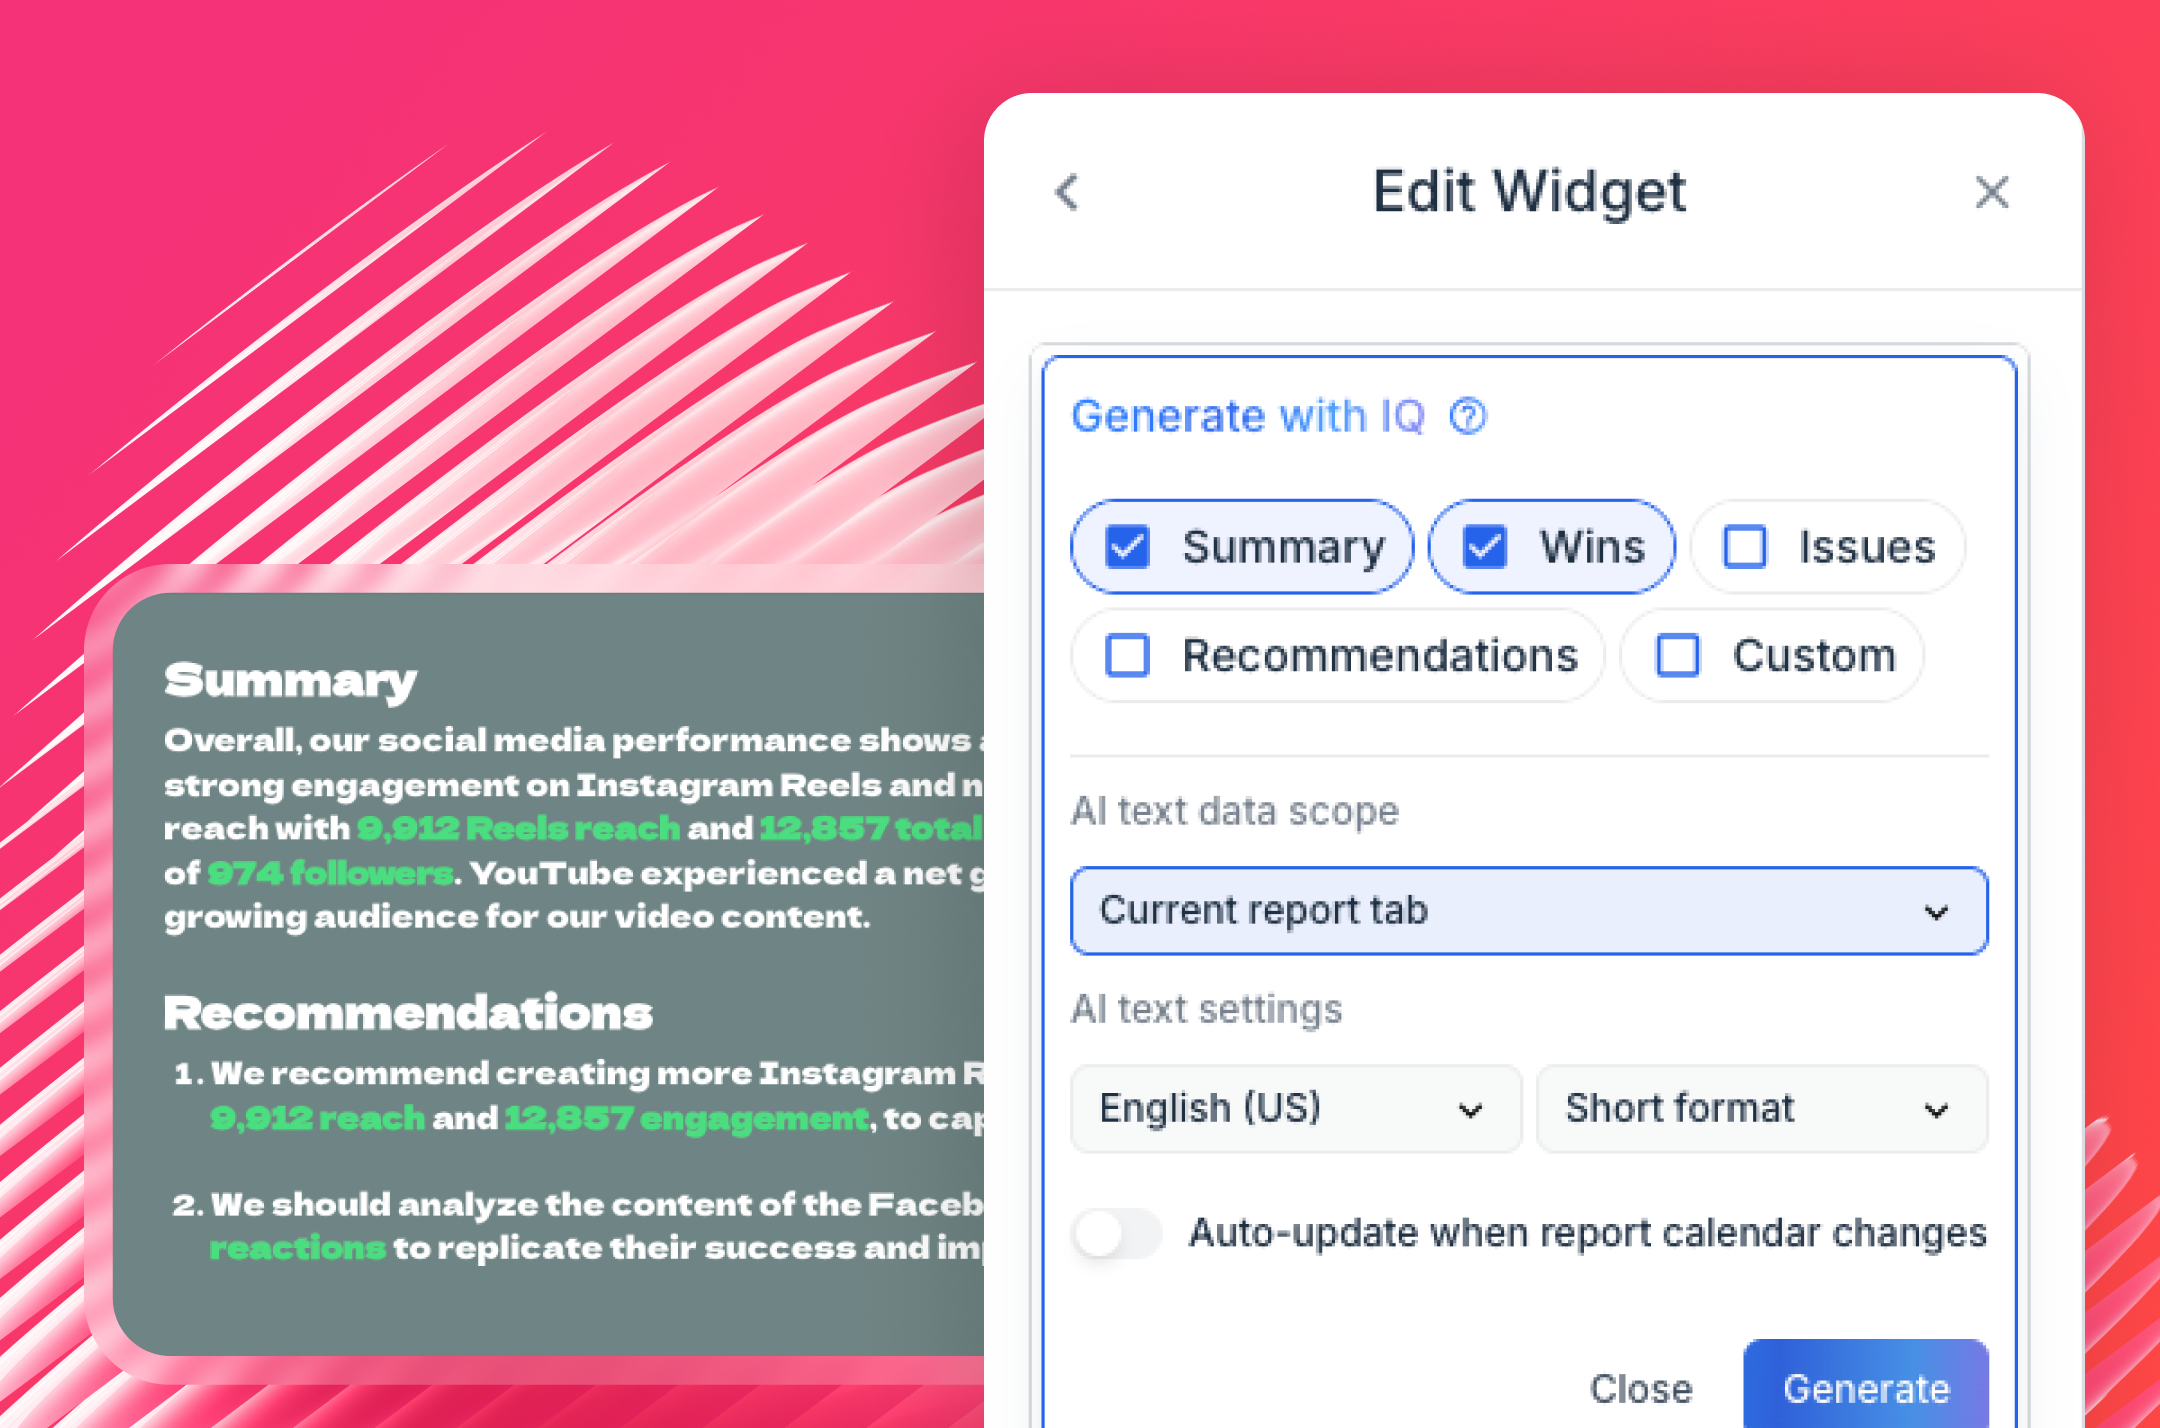
- Whatagraph IQ Summaries writes the interpretation for you: it reads the data on your report and generates Wins and Issues summaries you can drop straight onto the canvas. Clients see what changed, why it matters, and what to do next - not just a table of metrics.
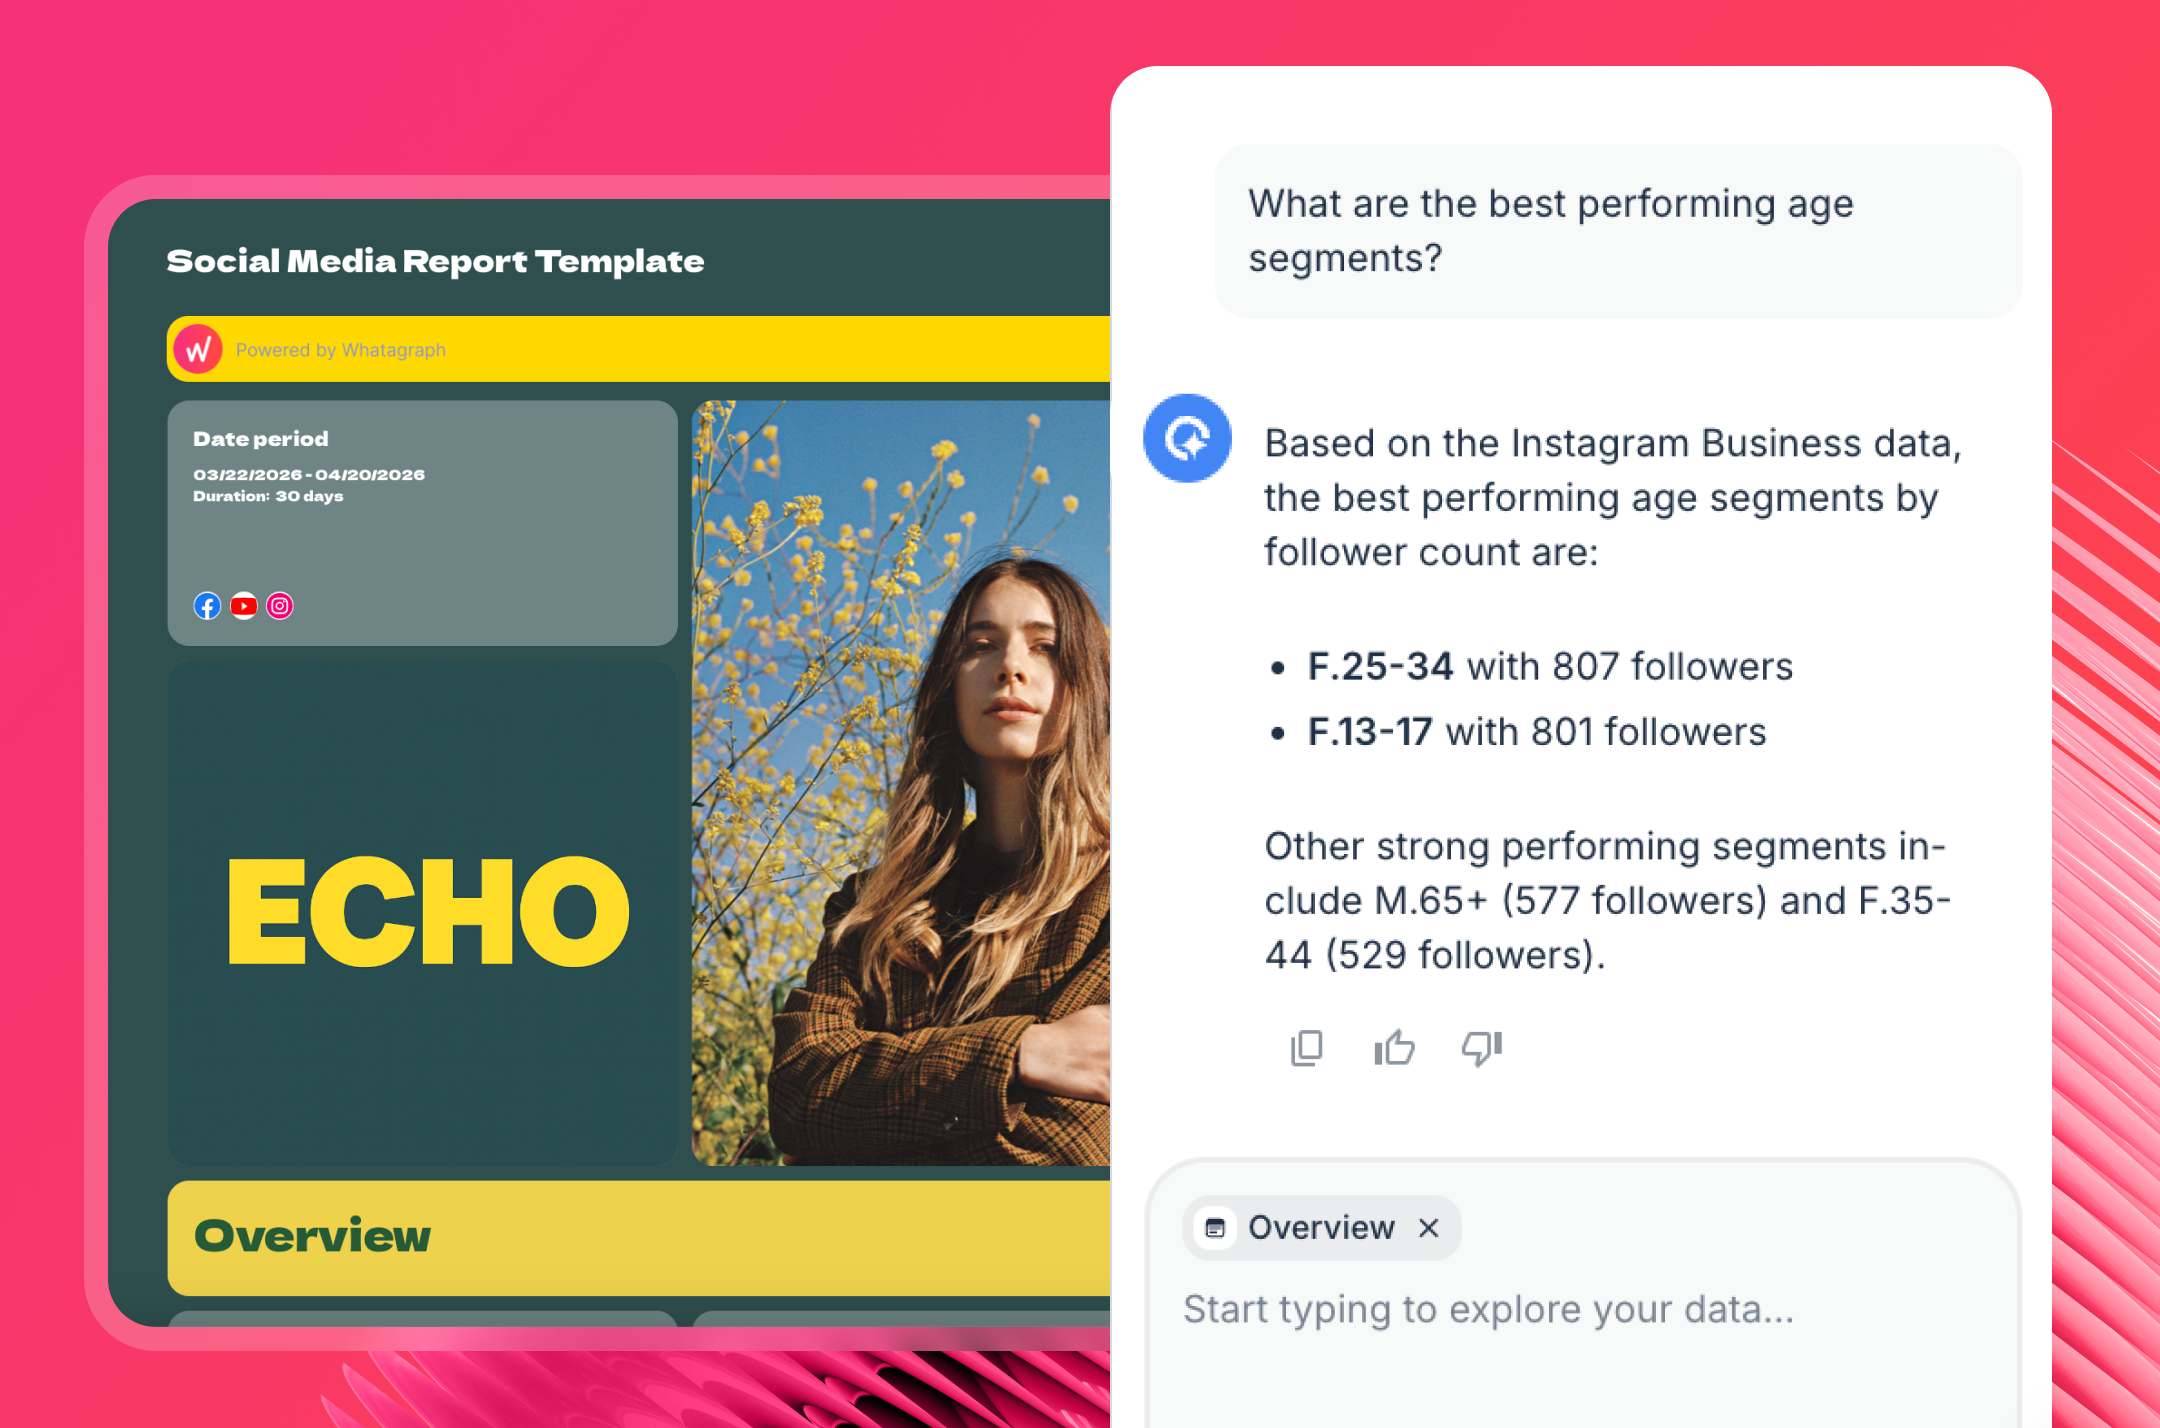
- IQ Chat goes further: you can type natural language questions directly inside the live report ("why did engagement drop last week?") and get an instant answer. You can also enable this for clients and they’ll be able to do the same. That cuts the back-and-forth emails that eat agency time.
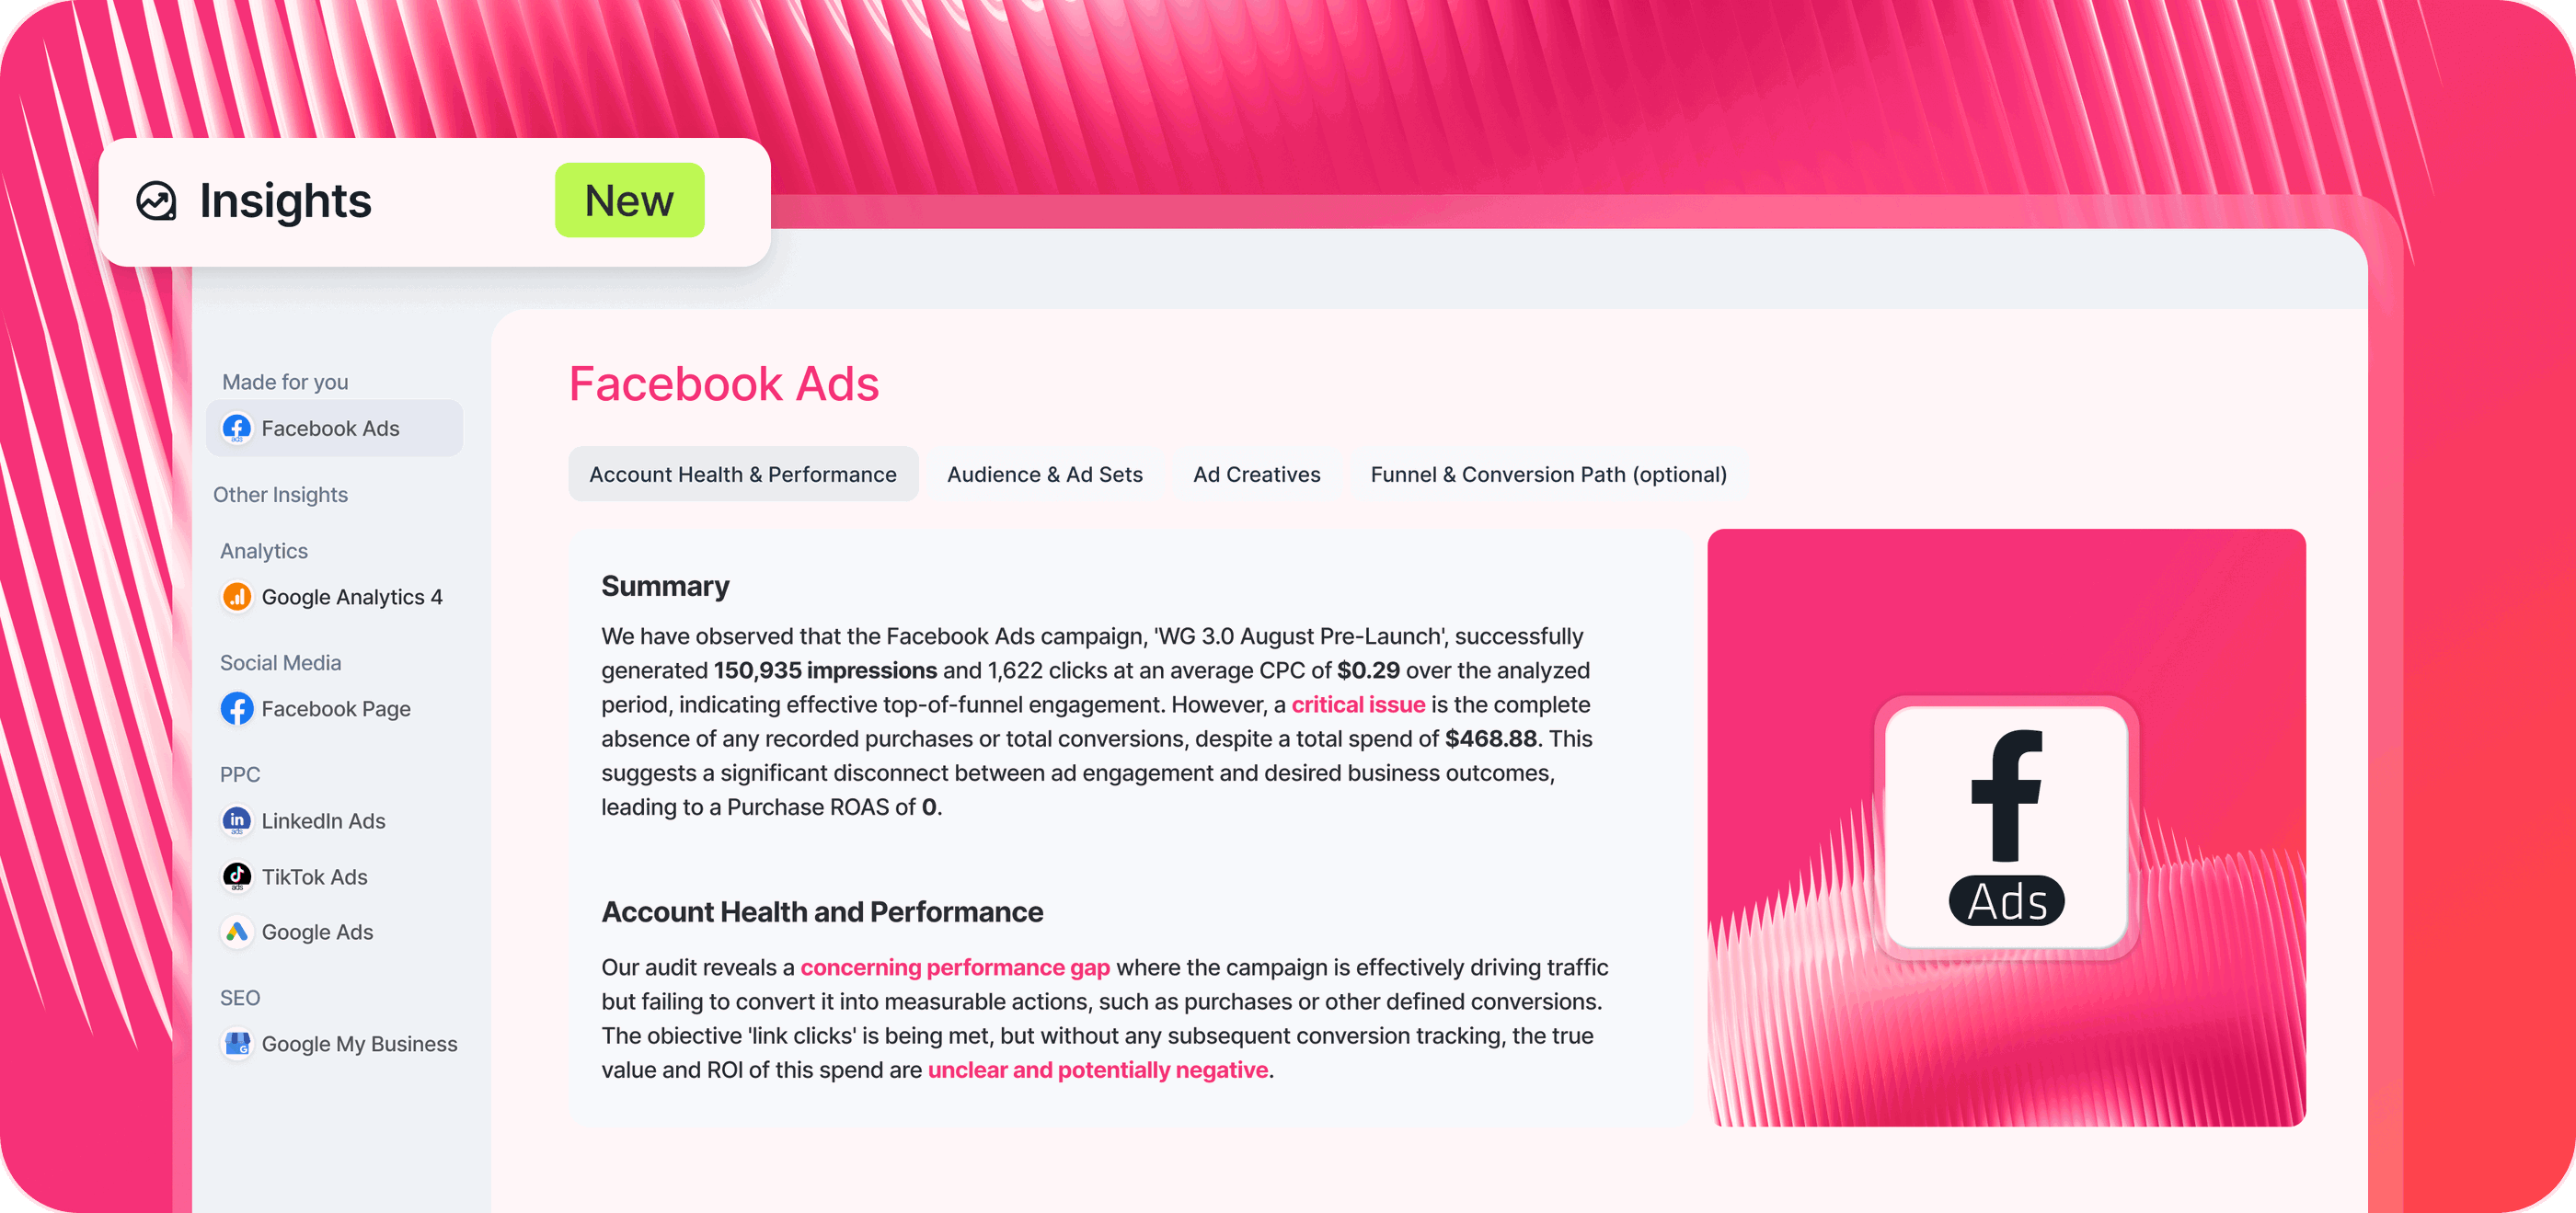
- In Insights, powered by Whatagraph IQ, Whatagraph automatically surfaces performance highlights, anomalies, and actionable recommendations across all your Spaces. You don’t need to hunt through metrics: the platform tells you what changed, why it matters, and what to do next.
Can I export data to Google Sheets or other formats? And can I automate delivery so stakeholders get fresh data without lifting a finger?
Yes. Whatagraph exports to PDF, CSV, XLSX, and PPT. You can also push data directly to BigQuery with a no-code connection - useful if your team works in Looker Studio or runs any downstream analysis. For teams that prefer working in spreadsheets, the CSV and XLSX exports are clean and structured, not raw API dumps.
When it comes to automation, you can schedule reports to be automatically delivered to any recipient's email or Slack on a daily, weekly, or monthly schedule.
The sender address comes from your branded domain, not a generic reports@ address. Custom report URLs can use your agency's domain (e.g., reports.agencyname.com/shared/) instead of live.whatagraph.com.
Key features:
- 60+ stable native integrations
- No-code custom data connection
- Organize data without coding (IQ Dimensions)
- True cross-channel data blending
- No-code data push to BigQuery
- AI report builder (IQ Report)
- AI-generated insights (IQ Summaries)
- Chat with data (IQ Chat)
- Library of pre-made templates
- AI-powered custom branding (IQ Theme)
- Full white-label and custom domain
- Intuitive drag-and-drop builder
- Centralized performance overview
- Bulk report editing
- Automated report scheduling
- Flexible export options (PDF, PPT, CSV)
- Client-facing IQ Chat
Pros:
- Built for marketers, not data scientists
- Reliable, human-led live chat support
- Real-time, automated dashboards
- All-in-one marketing analytics platform
- Lightning-fast insights with AI
Cons:
- Report load speed depends on data volume
- Learning curve for data blending
Pricing
Whatagraph uses tiered pricing based on the number of Source Credits (each connected account counts as one credit).
- Forever-free – lets you get started at no cost, with 5 source credits, Whatagraph IQ basics, templates, and live chat support.
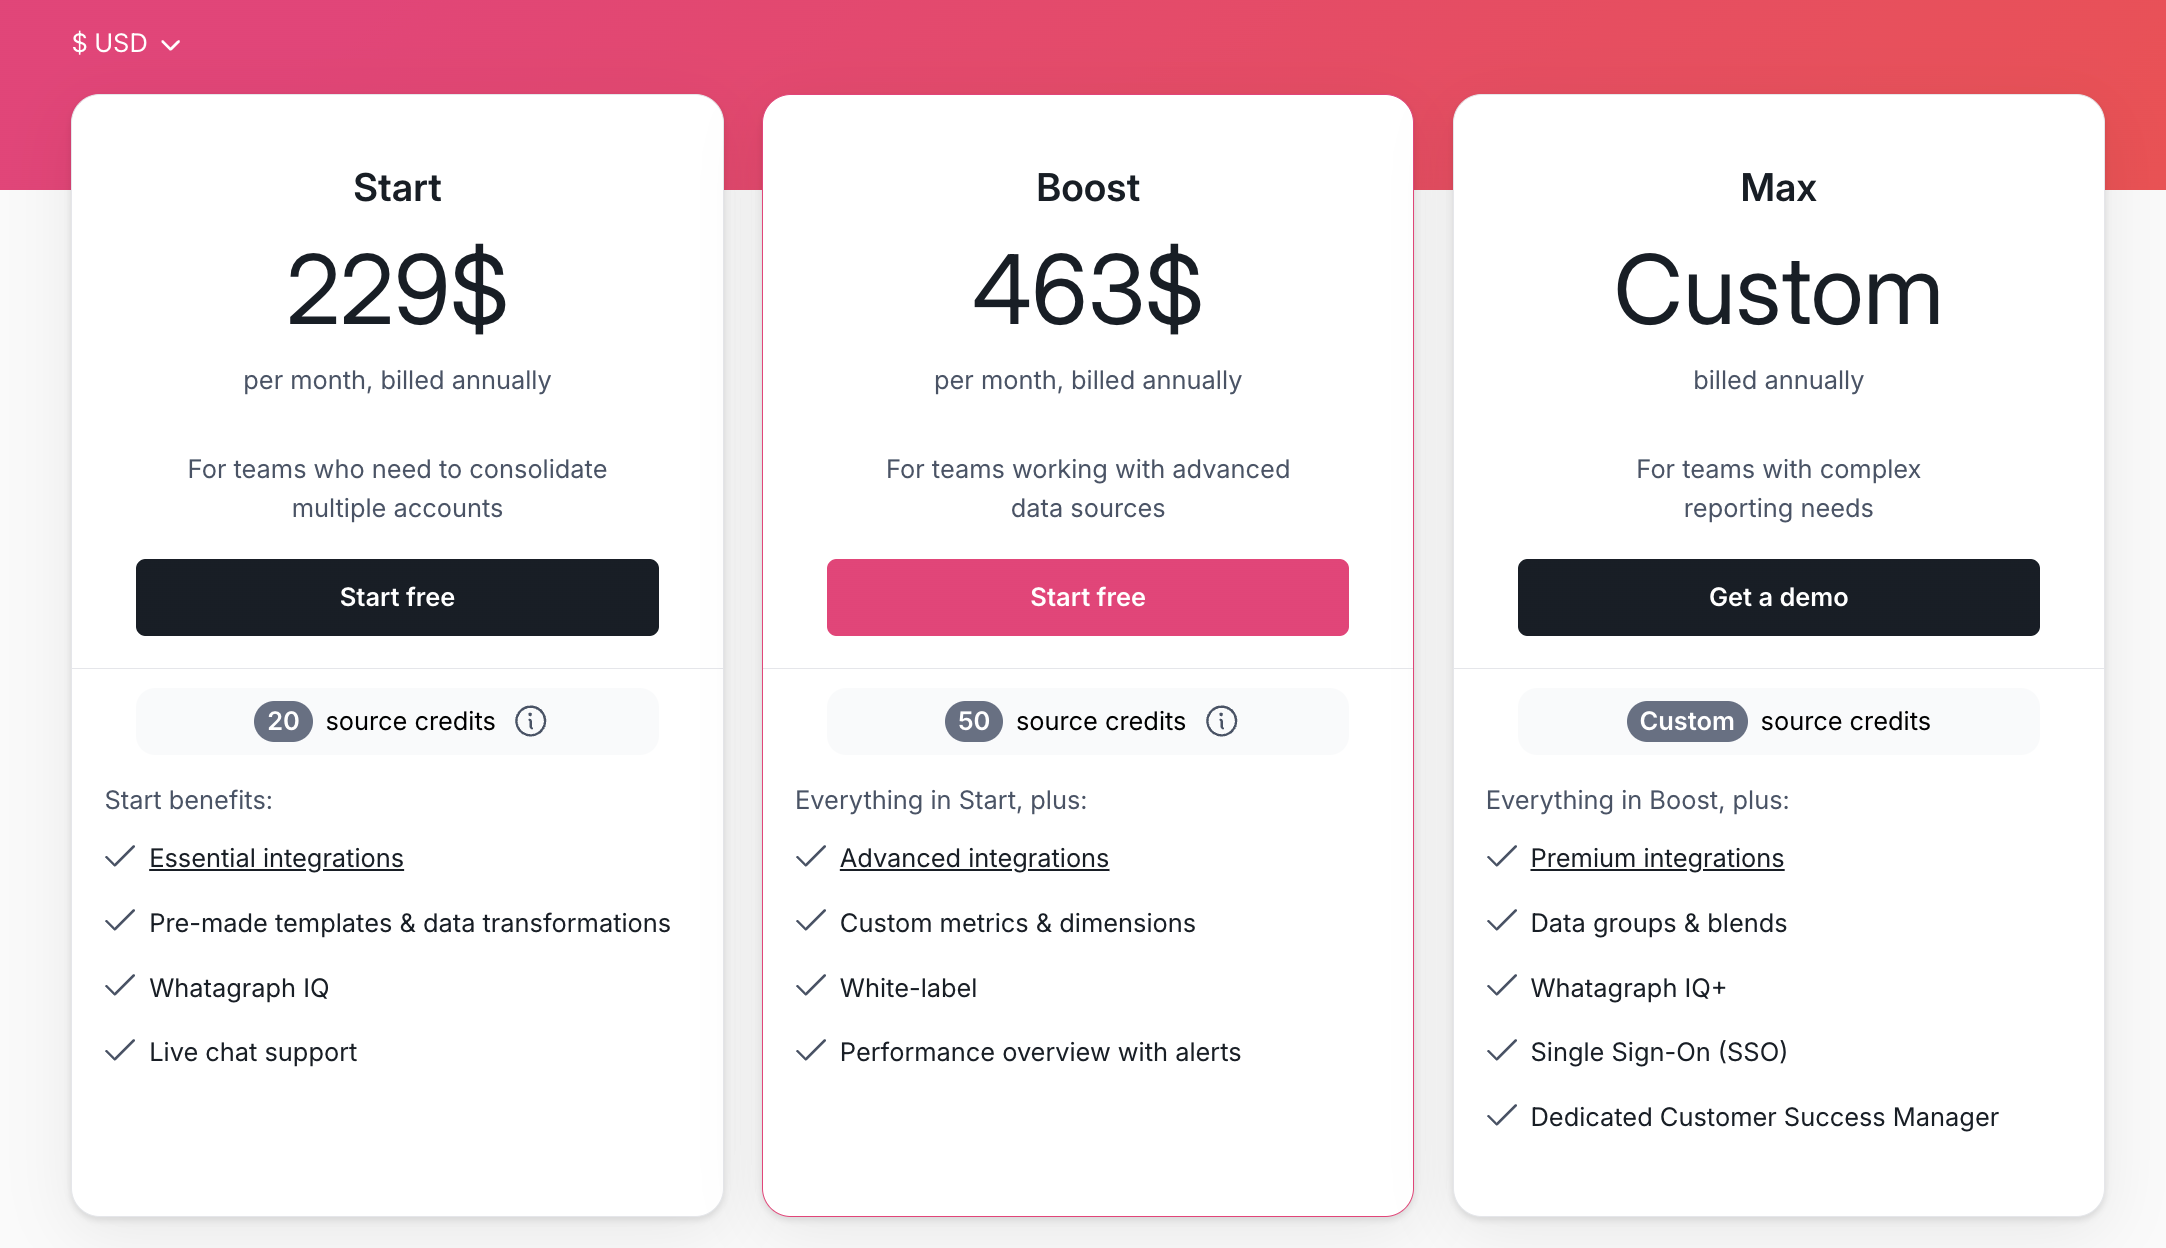
- Start ($229/mo billed annually) – includes 20 source credits and essential integrations
- Boost ($463/mo billed annually) – jumps up to 50 source credits, adds advanced integrations, custom metrics & dimensions, white-labeling, and performance overview with alerts
- Max (custom pricing) – for enterprise/complex teams, with custom source credits, premium integrations, data groups and blends, Whatagraph IQ+, SSO, and dedicated Customer Success Manager
Analyze your social media data for free today.
2. Metrics Watch
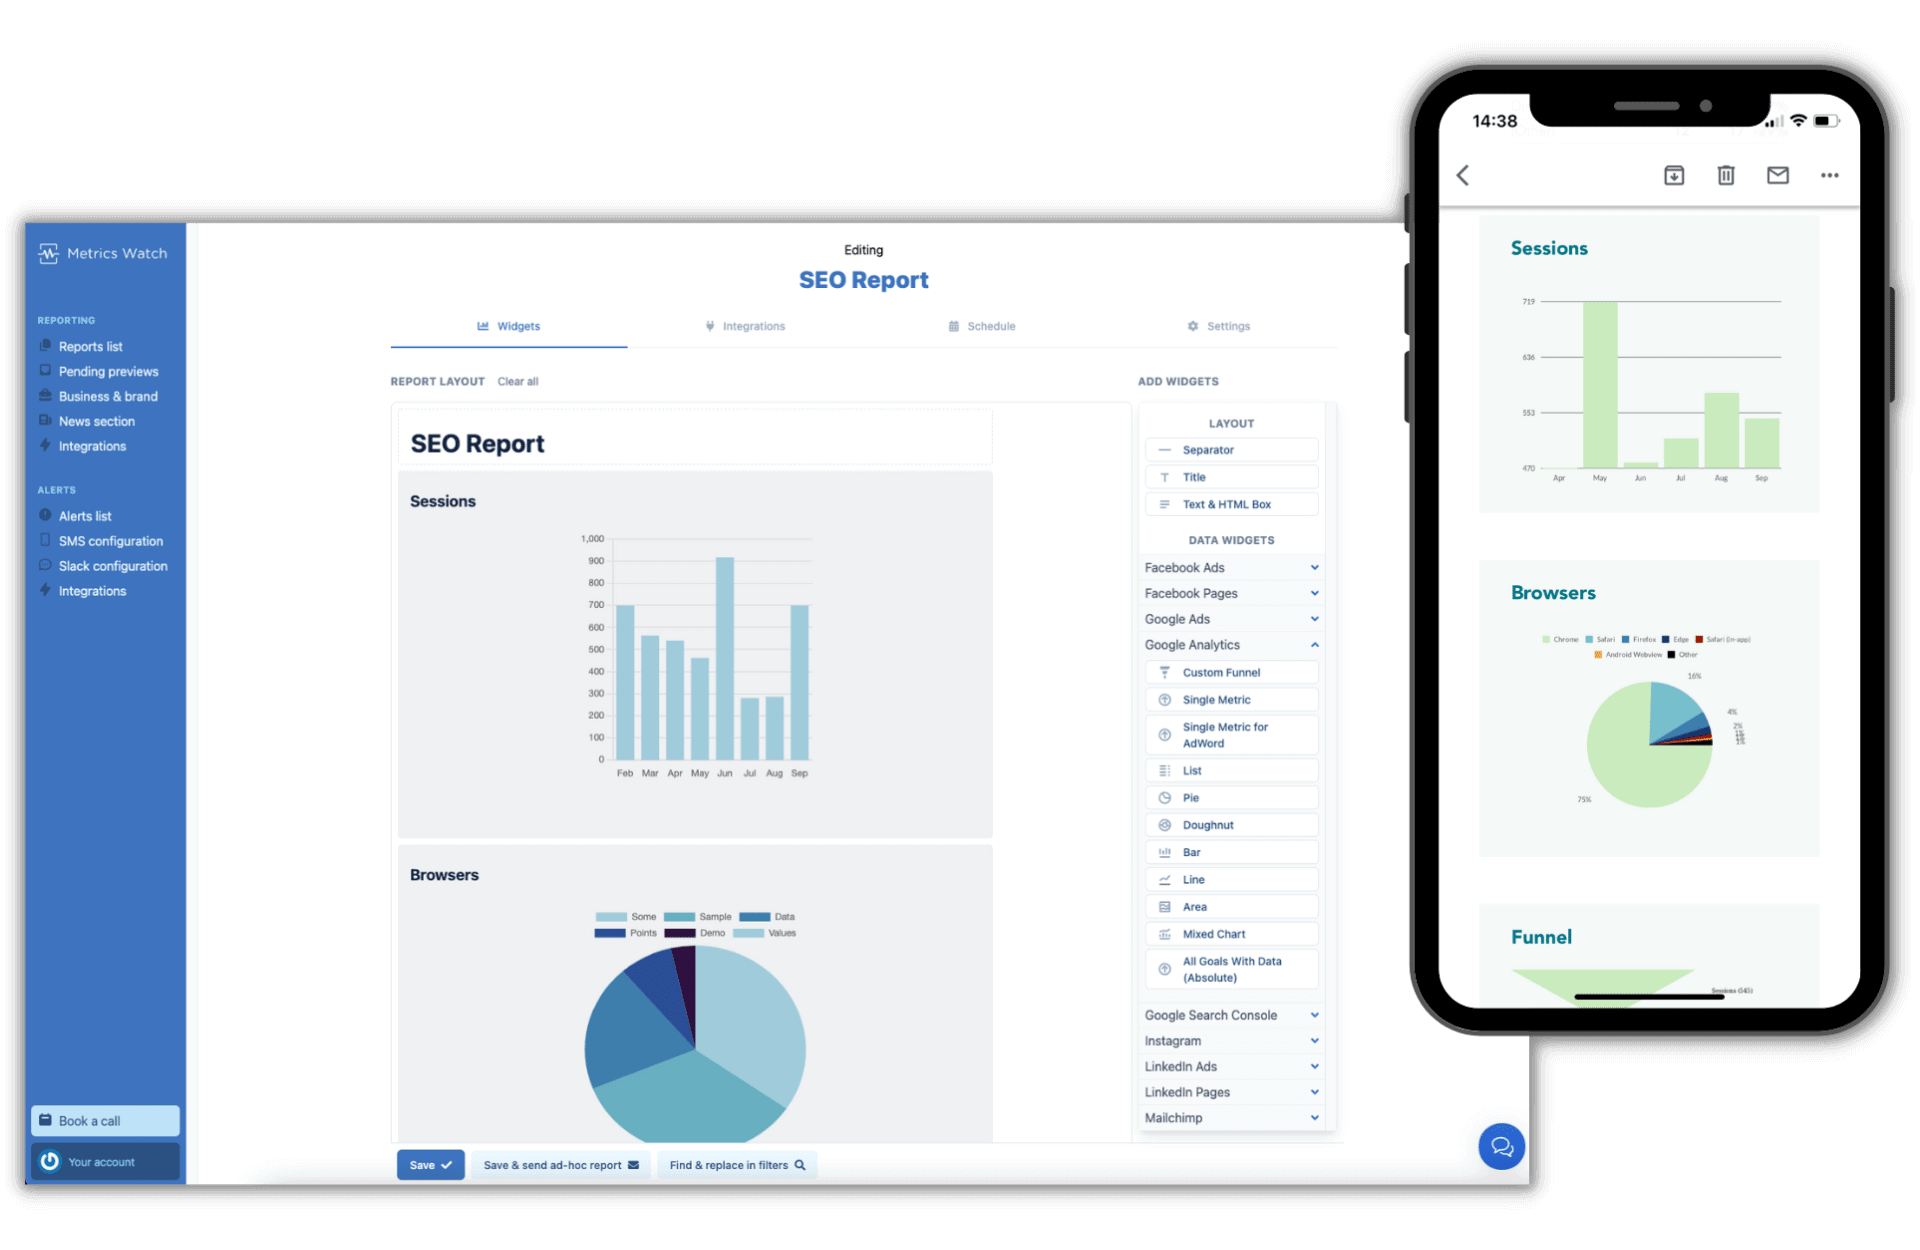
Metrics Watch takes a fundamentally different approach to reporting: instead of building dashboards your clients need to log into, it delivers the entire report inside the email body - no PDF attachments, no external links, no login required. The client opens their inbox and the data is right there.
The platform supports data from social media, Google Analytics, paid ads accounts, and SEO sources, letting you combine cross-channel performance in a single branded email.
The drag-and-drop builder and pre-made templates make setup fast; most users are sending reports within an hour of connecting their sources.
The core constraint is worth knowing upfront: custom metrics require help from their support team (takes a few days), blended cross-channel metrics like blended ROAS are not available, and there are no real-time dashboards.
For teams whose workflow is built around email delivery to stakeholders, none of that matters. For teams that need data exploration or live dashboards, it will.
Key features:
- Email-body report delivery (no PDF, no dashboard link)
- Drag-and-drop report builder
- Pre-made templates for social, Google Analytics, and paid ads
- White-label reports with custom branding and logo
- Automated delivery on daily, weekly, or monthly schedules
- Real-time alerts for metric changes
- Data connectors for social platforms, Google Analytics, paid ads, and SEO sources
- Reports sent in CSV format for multi-client batch delivery
- English and French language support
Pros: Very fast setup, frictionless client experience (data in inbox), automated delivery, strong customer support, affordable entry price
Cons: Custom metrics require support team involvement, no blended metrics, no real-time dashboards, limited design customization, no API
Pricing (as of May 2026):
Metrics Watch now sells Reports and Alerts as two separate products. You can subscribe to one or both.
Plan | Monthly price | Annual price | Reports limit |
| Startup | $49/month | $41/month ($490/year) | Up to 2 |
| Pro (Popular) | $149/month | $124/month ($1,490/year) | Up to 25 |
| Agency | $399/month | $333/month ($3,990/year) | Up to 100 |
All reports plans include unlimited data sources and email delivery. Pro and Agency include priority support.
Alerts (real-time GA4 monitoring):
Plan | Monthly price | Annual price | Custom alerts | Detection speed |
| Basic | $79/month | $66/month | 3 | 15 minutes |
| Starter (Best value) | $99/month | $83/month | 10 | 10 minutes |
| Professional (Most popular) | $299/month | $249/month | 30 | 5 minutes |
| Enterprise | Custom | Custom | Unlimited | 5 minutes |
3. Keyhole
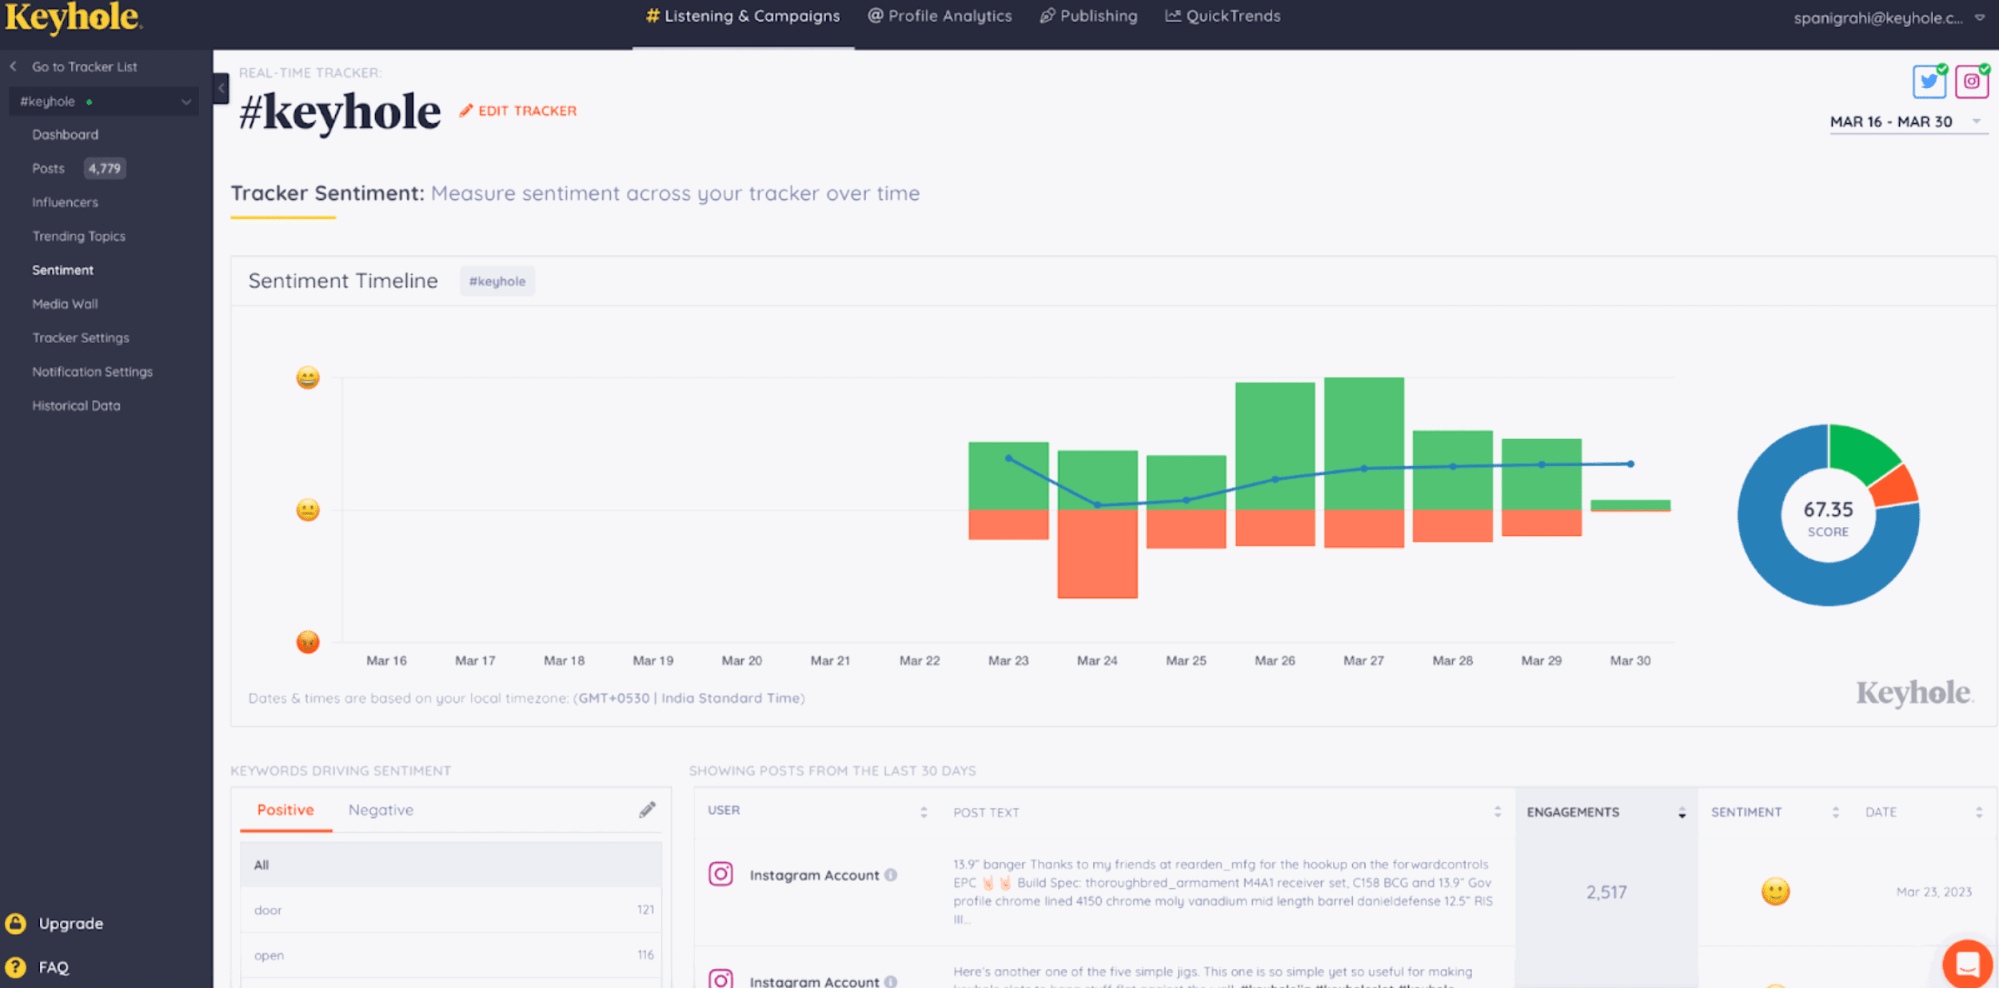
Keyhole is a social media analytics platform focused on hashtag tracking, campaign analytics, and influencer intelligence. It was acquired by Muck Rack in 2024, which integrated it into a broader PR and communications platform - though Keyhole continues to operate as a standalone product.
Its strongest differentiator is historical data depth. While most tools cap you at 12-24 months, Keyhole can surface conversations going back up to a decade on certain plans.
That's genuinely useful for understanding how conversations around a topic have evolved over time, spotting long-term trends, or building research-backed content strategies.
The machine learning-powered trend detection identifies emerging patterns before they go mainstream.
For influencer work, the profiling is detailed: you can filter by geo-location, keywords in bios, reach, and engagement levels, and check for red flags like fake followers or negative sentiment before committing to a partnership. Note that Pinterest and LinkedIn are not supported natively, which creates gaps for brands active on those platforms.
One important context: Keyhole is analytics-only. There is no scheduling or publishing functionality, so you'll need a separate tool for that side of your workflow.
Key features:
- Real-time hashtag and keyword tracking across social platforms
- Historical data access (up to a decade on higher plans)
- Campaign and event monitoring
- Influencer identification, profiling, and performance analytics
- Competitor benchmarking and share of voice analysis
- Sentiment analysis and demographic data
- Brand mention monitoring across 75 million sources
- Automated reports exportable as PDF or XLS
- Media wall and moderation (Enterprise)
- Geo-location and language filtering (Enterprise)
- AI-powered trend detection via machine learning
- Shareable live dashboards
Pros: Best-in-class real-time hashtag analytics, intuitive interface, strong influencer profiling, excellent for campaign and event tracking
Cons: No Pinterest or LinkedIn native tracking, analytics-only (no scheduling), entry pricing steep for small businesses, limited report customization
Pricing (as of May 2026):
Following Muck Rack's 2024 acquisition, Keyhole no longer lists public pricing. All plans are custom-quoted. Contact Muck Rack/Keyhole directly or request a demo for pricing.
4. Google Analytics 4
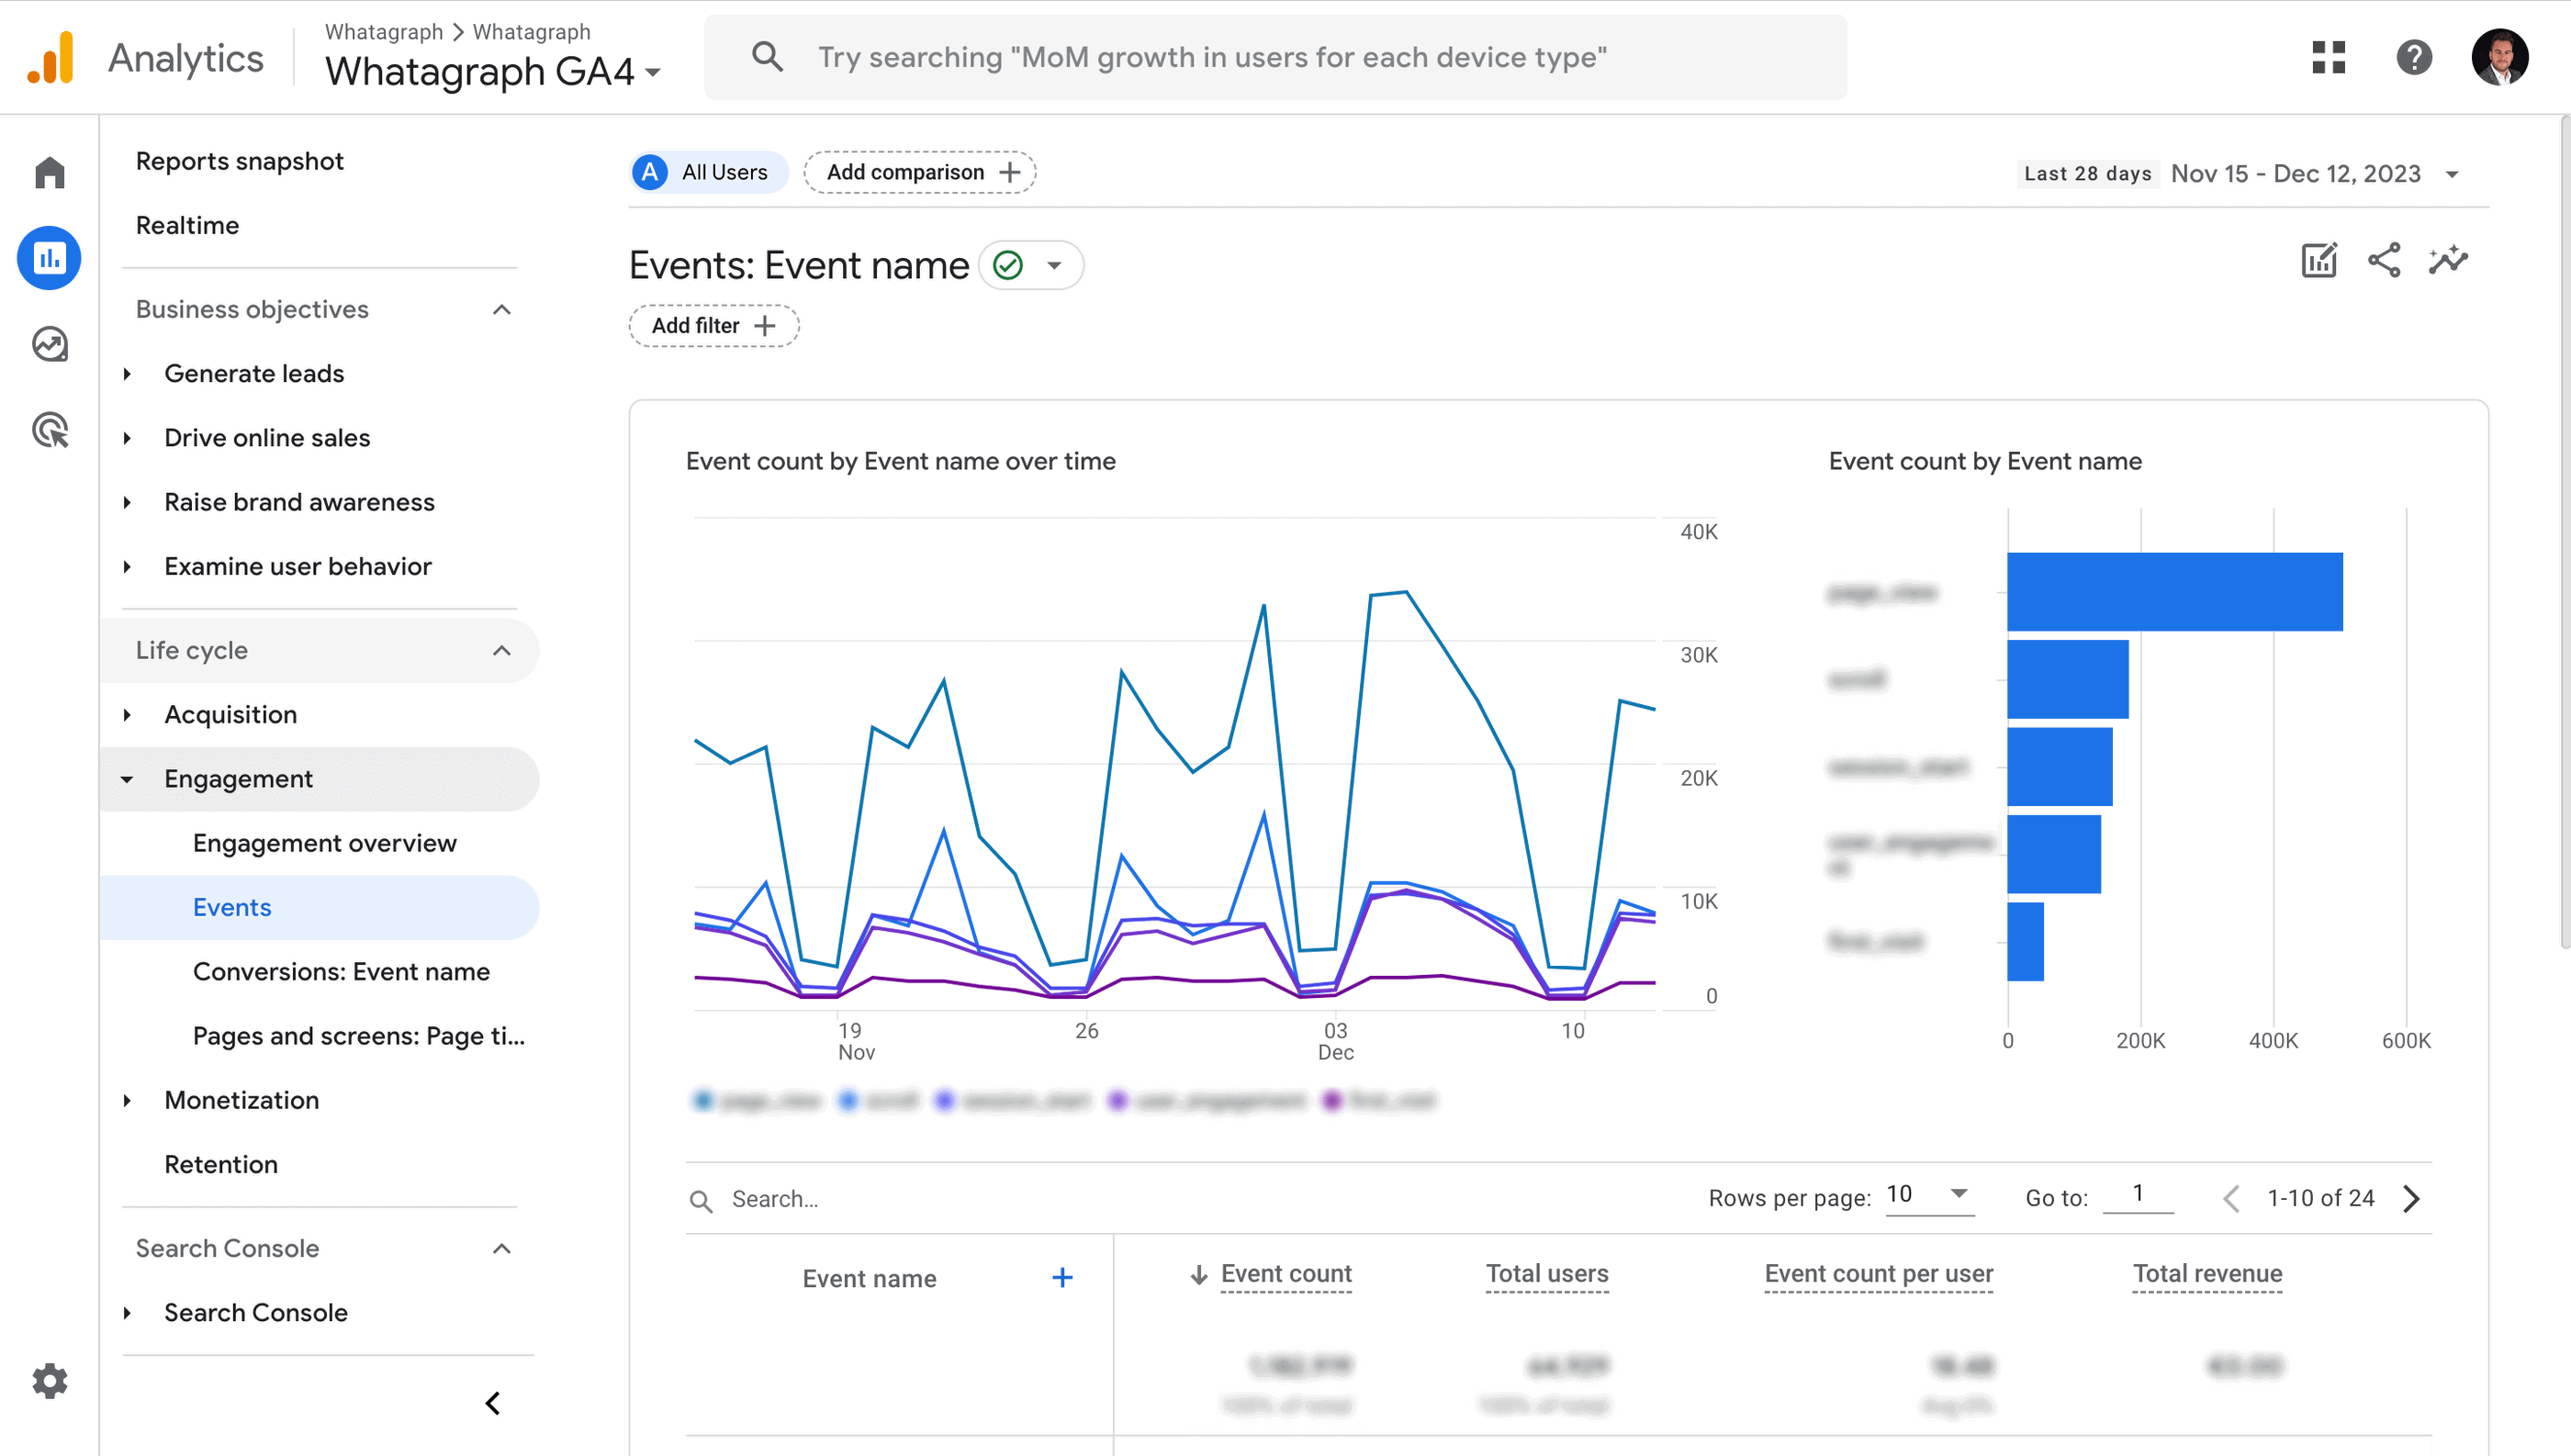
Google Analytics 4 isn't a social media analytics tool in the traditional sense - but it's the most reliable way to track what social media is actually doing for your website. If your goal is to understand which platforms drive the most traffic, what content generates the most leads, or who your social audience is once they land on your site, GA4 delivers.
You can create reports specifically for social data by tracking traffic by network, or use UTM parameters to measure specific social campaigns. The event-driven data model is more flexible than Universal Analytics ever was, and the predictive metrics are worth exploring if you're managing performance campaigns.
The limitation is that GA4 won't show you what's happening inside the social platforms themselves - follower growth, engagement rates, post performance. For that, you need a dedicated tool. But as a complement to social-specific platforms, it's free and genuinely powerful.
Key features:
- Event-driven data model
- User-centric insights
- Cross-platform tracking
- Advanced funnel analysis
- Exploration reports
- Real-time insights
- Predictive metrics
- Built-in privacy controls
Pros: Free, extremely powerful for website attribution, massive community and documentation
Cons: Steep learning curve, limited built-in social reports, requires manual setup for social tracking, some UA features still not replicated
Pricing: Free. Google Analytics 360 (enterprise) includes advanced attribution and data integration at a custom price.
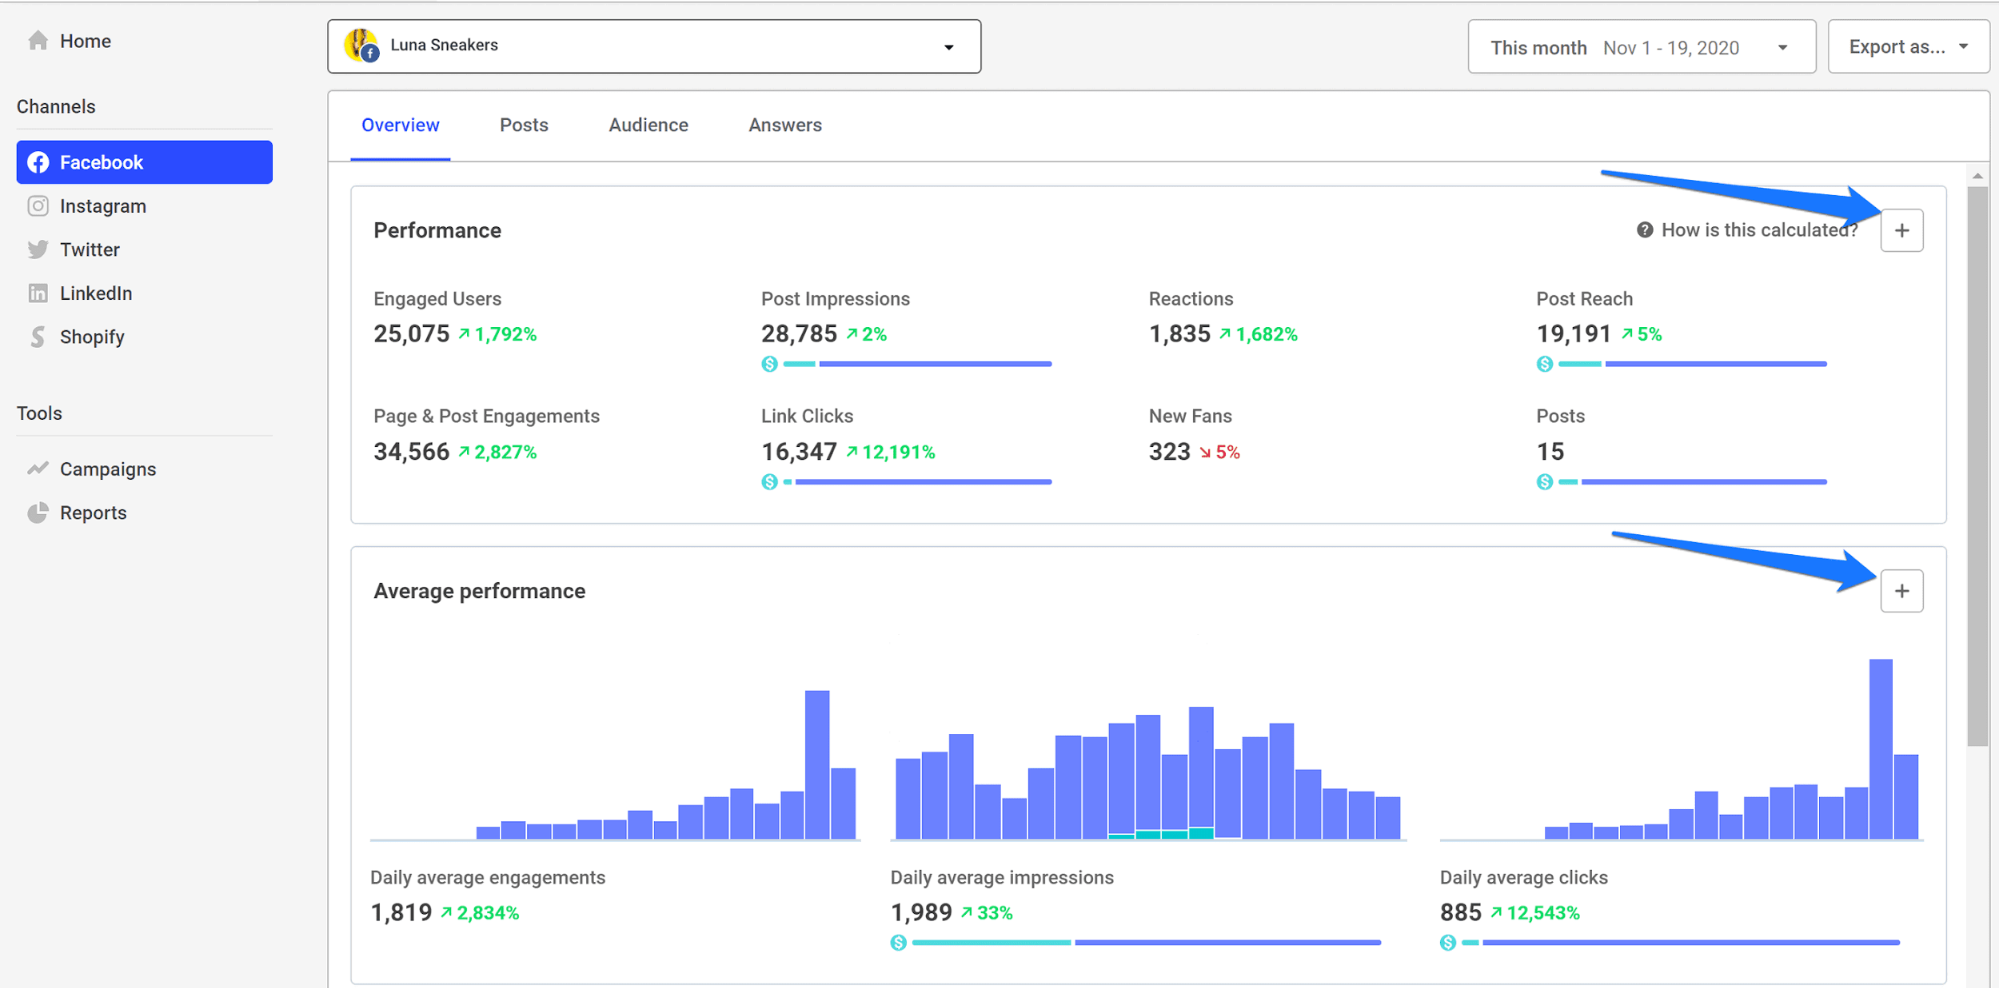
5. Sprout Social
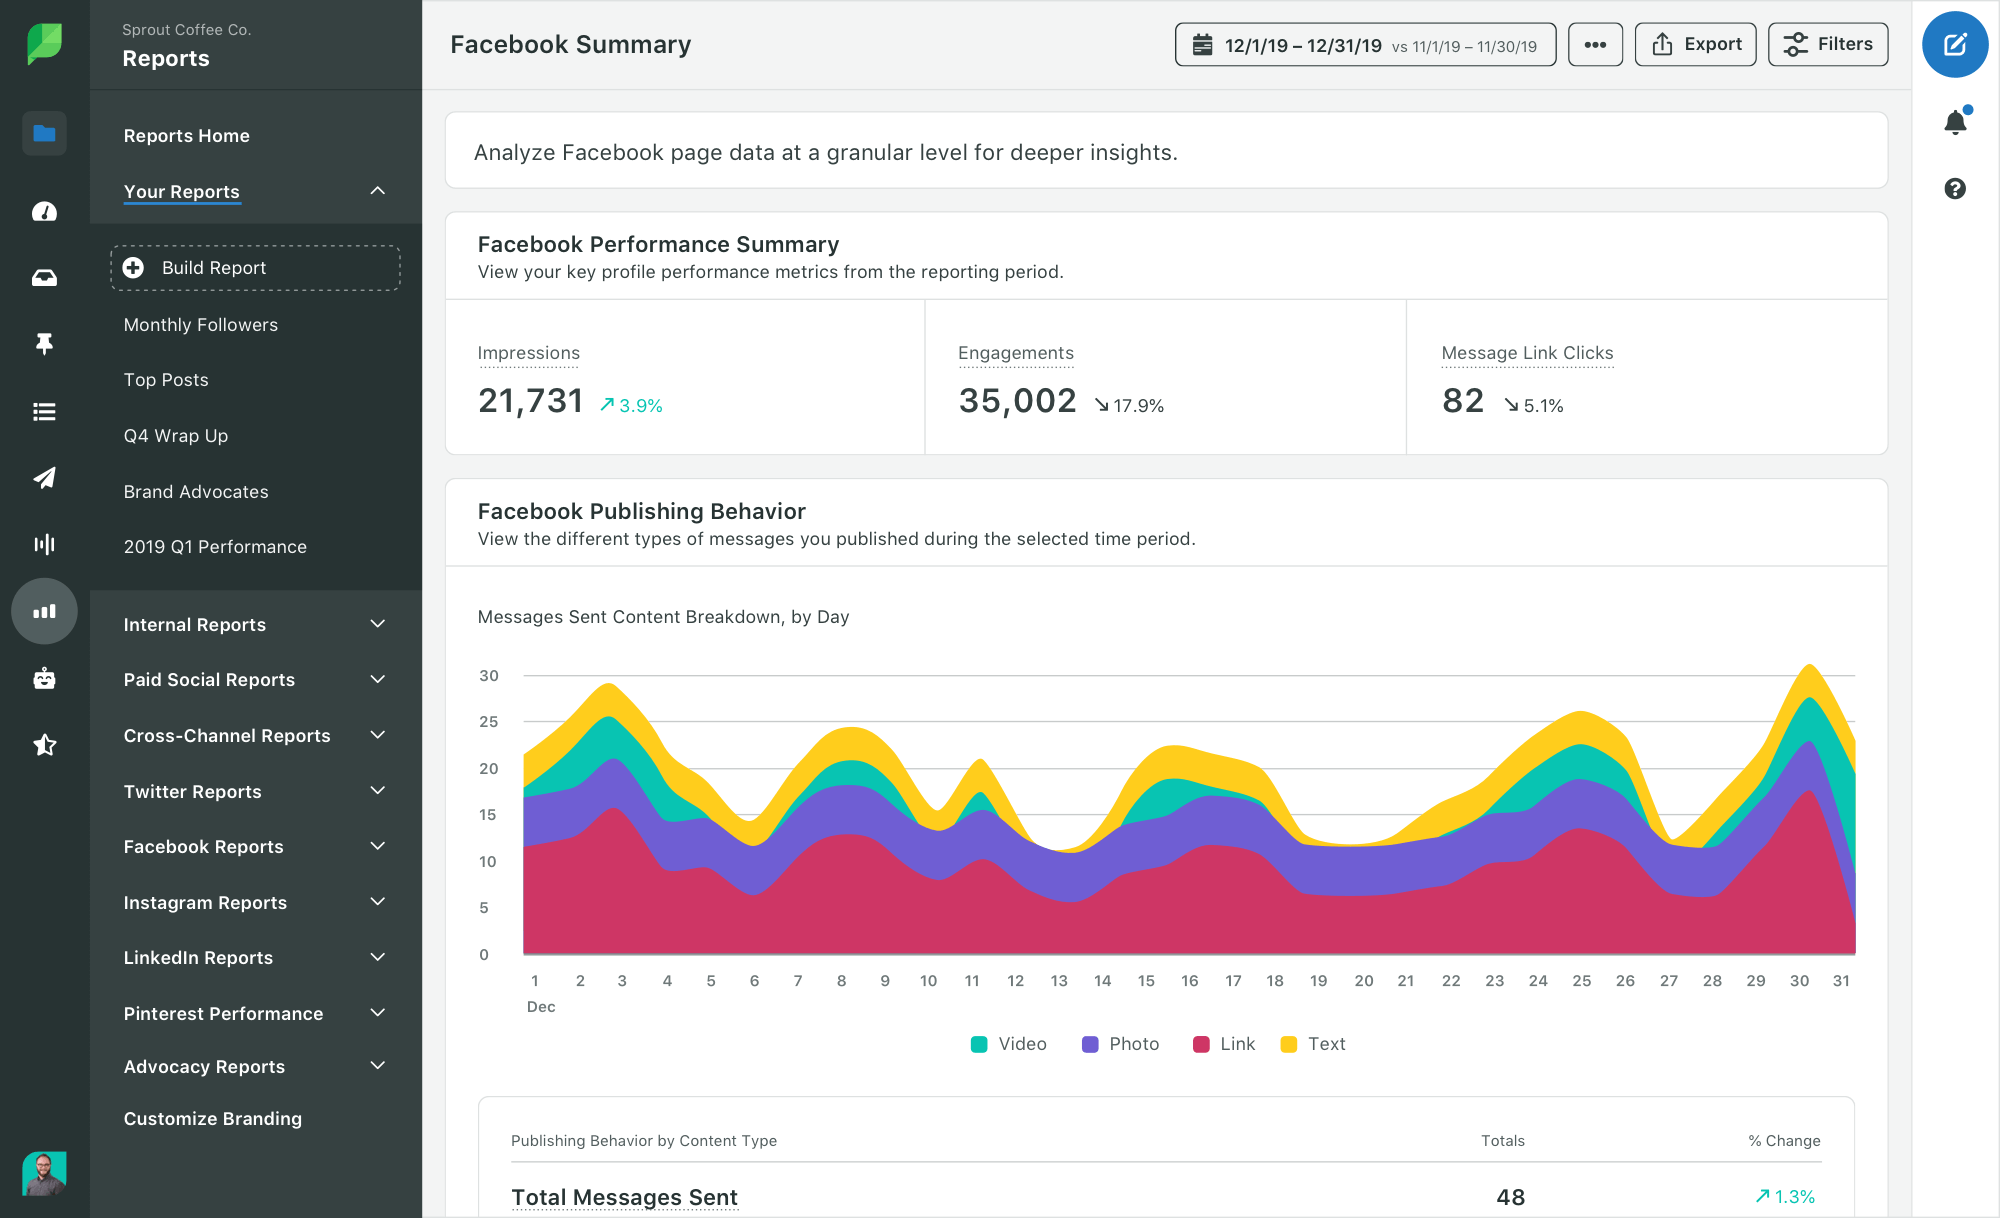
Sprout Social is a full-service social media management tool covering publishing, engagement, analytics, and customer care.
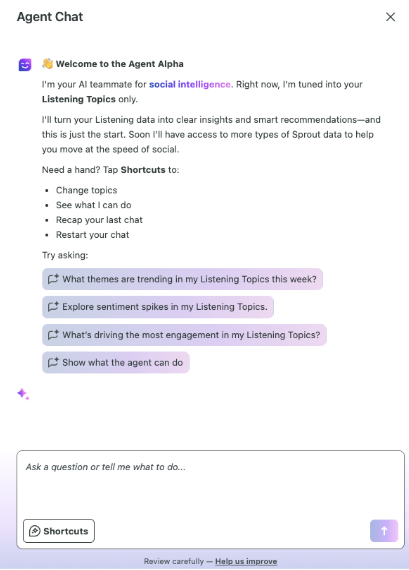
In late 2025 and into 2026, it has made its most significant product push yet with the launch of Sprout AI, anchored by Trellis - a conversational AI agent that turns social data into business intelligence through plain-language queries (similar to IQ Chat on Whatagraph).
The 2026 feature updates are substantial:
- Trellis is now live in the platform's Listening module, letting teams ask questions directly and get contextual answers from their social data without building dashboards manually.
- A new Reddit integration (expanded in March 2026) lets teams engage with owned subreddits directly from the Smart Inbox.
- Instagram Reels now surface five new metrics including skip rate and repost count. Trial Reels lets you test content with non-followers before publishing to your main audience.
- Recruit, launched in February 2026, is an AI-powered creator management tool that builds custom landing pages to source and vet influencer partners.
For agencies, the key update is the new Essentials plan at $79/month (billed annually), which finally brings Sprout within reach of smaller teams. The Professional plan ($299/mo) remains the agency workhorse: unlimited profiles, competitor insights, paid social reports, and AI-assisted post copy and replies.
Key features:
- Trellis AI agent for conversational social data analysis
- Smart Inbox combining all social messages, DMs, and comments
- Social listening powered by Talkwalker (sentiment, trend spotting, spike alerts)
- Competitor benchmarking and share of voice tracking
- Instagram Reels metrics: skip rate, repost count, watch time
- Trial Reels publishing with auto-graduation after 72 hours
- Reddit integration: Smart Inbox engagement with owned subreddits
- Recruit: AI-powered influencer discovery and creator management
- ChatGPT integration via MCP server for embedding social data into AI workflows
- Premium Analytics add-on: advanced filtering, ROI charts, shareable reports
- Automated report scheduling with custom branding
- Employee Advocacy module for brand content amplification
- Customizable post-level performance metrics aligned to business goals
- Bluesky and LINE social listening support
- LLM Insights: monitor how AI assistants represent your brand
Pros: Industry-leading social listening, genuinely useful AI with Trellis, 30-day free trial, strong influencer management via Tagger/Recruit, Essentials plan makes entry more accessible in 2026
Cons: Per-seat pricing scales fast for larger teams, some features require expensive add-ons, occasional bugs on new API updates
Pricing (as of May 2026, per seat/month billed annually):
Plan | Price | Social profiles | Key features |
| Standard | $199 | 5 | Publishing, unified inbox, analytics, keyword monitoring |
| Professional (Most popular) | $299 | Unlimited | Competitor insights, paid social reports, AI Assist, Trellis |
| Advanced | $499 | Unlimited | Sentiment tracking, helpdesk integrations, Message Spike Alerts |
| Enterprise | Custom | Custom | White-glove onboarding, SSO, Employee Advocacy, priority support |
30-day free trial on all plans. Annual billing required; no true month-to-month option at listed rates. Premium Analytics, Listening, and Employee Advocacy available as add-ons.
6. Buffer
Buffer is a social media scheduling and analytics tool that works best for content-focused teams that want clean, simple performance data alongside a solid content calendar.
It supports 12 platforms including Instagram, LinkedIn, TikTok, YouTube, Threads, Bluesky, Mastodon, Facebook, X, Pinterest, and Google Business Profiles - one of the widest platform footprints in its price tier.
In 2025, Buffer shipped some of its most significant updates in years:
- Community is a unified inbox for comments across Threads, LinkedIn, Bluesky, Instagram, Facebook, and X - putting all replies in one place so nothing gets missed after publishing.
- Bulk scheduling via CSV lets you import up to 100 posts at once. LinkedIn Personal Profile Analytics expanded to include views, watch time, and engagement rate.
- The redesigned iOS app (Buffer for iOS 26) is the biggest mobile overhaul the platform has done.
- Posting Streaks and Goals were added to build publishing consistency habits. Instagram Grid Preview moved to all plans.
The analytics are honest: they cover post performance, engagement, reach, follower growth, and best times to post. They don't go deep into paid tracking, competitive benchmarking, or social listening - and Buffer doesn't pretend otherwise.
The AI Assistant uses GPT-4 to generate captions, repurpose content across formats, and adjust tone, with content staying private from OpenAI unless you engage the AI directly.
Key features:
- Community: unified comment inbox across Instagram, Facebook, Threads, LinkedIn, Bluesky, and X
- Content scheduling across 12 platforms including Bluesky and Threads
- Bulk scheduling via CSV (up to 100 posts at once)
- AI Assistant (GPT-4) for caption generation, repurposing, and tone adjustment
- Analytics: post performance, engagement, reach, follower growth, best times
- LinkedIn Personal Profile Analytics (views, watch time, engagement rate)
- Instagram Grid Preview on all plans
- Posting Goals and Streaks for consistency tracking
- Start Page: free link-in-bio builder
- Canva integration built into the composer
- Approval workflows and content permissions (Team plan)
- Branded PDF report exports (Team plan)
- Dark mode
- n8n integration for workflow automation
Pros: Genuinely usable free plan, cleanest interface in its category, excellent for creators and small teams, wide platform support including emerging networks, affordable per-channel pricing at low volumes
Cons: Per-channel pricing gets expensive at 10+ accounts, no social listening or paid tracking, no competitive benchmarking, analytics lack depth for agency client reporting
Pricing (as of May 2026):
Plan | Price | Channels | Key analytics |
| Free | Free forever | Up to 3 | 30-day history, basic analytics |
| Essentials | $6/month per channel | Unlimited | Full analytics history, engagement inbox |
| Team | $12/month per channel | Unlimited | Everything in Essentials, branded PDF reports, approval workflows |
7. Hootsuite
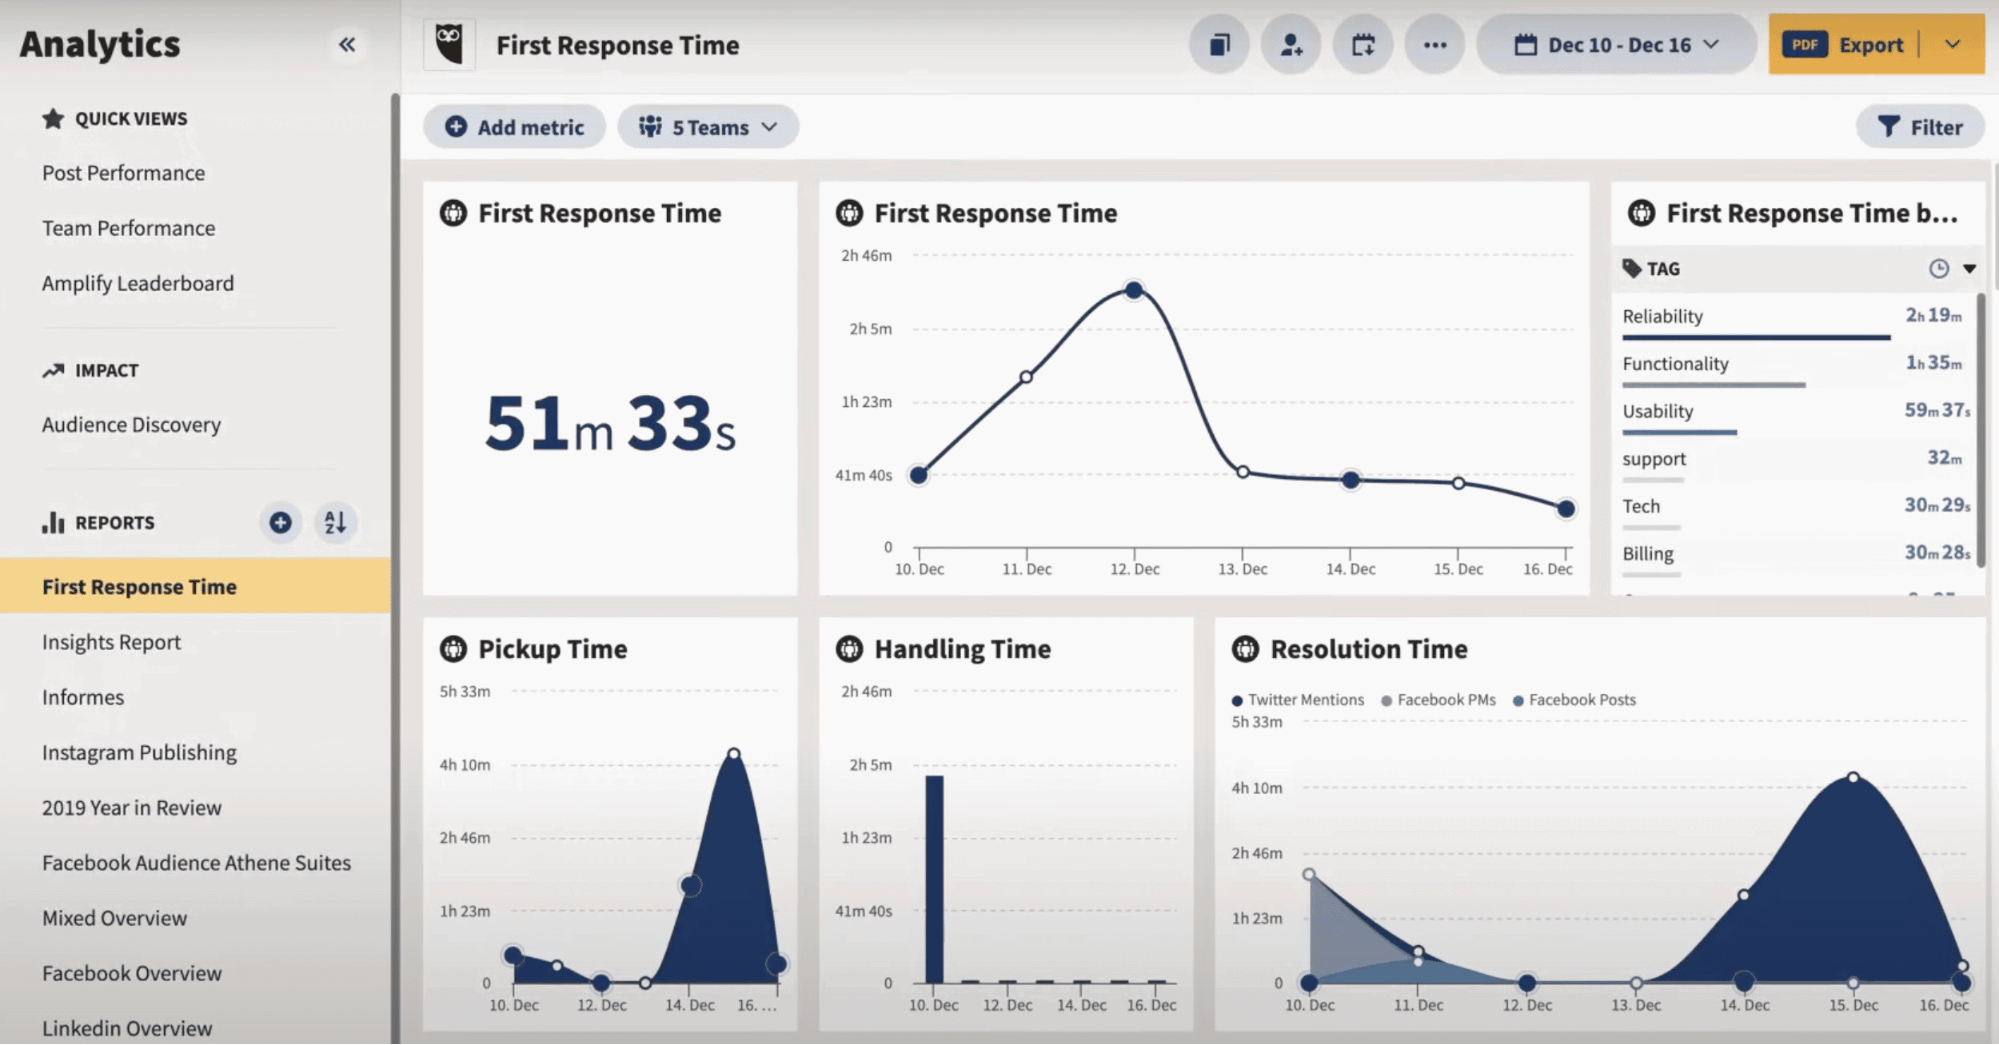
Hootsuite is one of the OG social media management platforms, and it remains relevant in 2026 primarily because of its social listening depth and the breadth of its AI updates.
It ranked #1 in G2's 2026 Best Marketing Products - though it's worth noting the platform raised prices by roughly 40% in recent years and dropped its free plan entirely.
The biggest 2026 story is Yeti, the AI agent powered by Talkwalker's BlueSilk AI. Yeti operates in OwlyGPT to surface trending topics, brand mentions, and actionable insights.
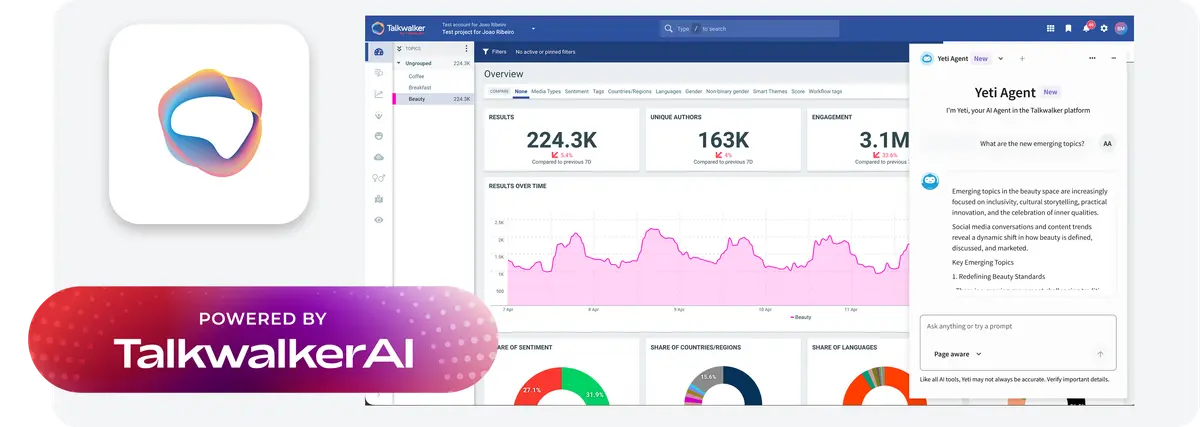
It now has agentic reasoning, MCP server integration, a full-screen hub, and a prompts library - making it one of the more capable AI layers in any social management tool.
LLM Insights is a genuinely new capability: it shows you how AI assistants like ChatGPT, Gemini, and Claude are representing your brand when users ask them questions, giving teams visibility into AI-powered discovery.
March 2026 updates added Instagram Collaboration analytics (tracking partnership post performance vs. non-collab content), expanded LINE coverage to 50,000 profiles for JAPAC markets, AI-generated images that flow directly into Create workflows, and a new external API for syncing analytics data into BI tools.
Key features:
- Yeti AI agent (BlueSilk AI) for social intelligence and workflow automation
- OwlyWriter AI and OwlyGPT for content creation and AI-generated images
- Social listening powered by Talkwalker (sentiment, topics, spike alerts, 150M+ sources on Enterprise)
- LLM Insights: monitor brand representation in ChatGPT, Gemini, and Claude responses
- Instagram Collaboration analytics for influencer partnership measurement
- Stream: real-time monitoring of mentions, hashtags, and keywords
- Reddit Ads management from within Hootsuite
- Competitor benchmarking (5 on Standard, 20 on Advanced/Enterprise)
- Campaign analysis with thread grouping into topics
- Automated report scheduling with PDF/PPT/CSV exports (Advanced+)
- External API for BI tool integration
- Amplify: employee advocacy with personalization and leaderboard
- Bulk scheduling up to 5,000 posts per channel
- Content approval workflows (Advanced+)
- Canva, Grammarly, Google Drive, and Dropbox integrations built in
- LINE data coverage for JAPAC (50,000 profiles)
- Bluesky and Threads listening support
Pros: Best-in-class social listening, strong AI with Yeti agent, LLM brand monitoring is a genuine 2026 differentiator, comprehensive platform for agencies managing multiple clients
Cons: No free plan, trial requires a credit card, per-seat pricing gets very expensive for teams, cluttered interface, support response times inconsistent
Pricing (as of May 2026, per user/month billed annually):
Plan | Price | Social accounts | Key analytics |
| Standard | $99/user/month | 10 | Core analytics, 7-day listening history, 5 competitors |
| Advanced (Most popular) | $249/user/month | Unlimited | Advanced analytics, exportable reports, 30-day listening, 20 competitors |
| Enterprise | Custom | Unlimited | Full suite, 150M+ listening sources, ROI dashboards |
8. Brandwatch
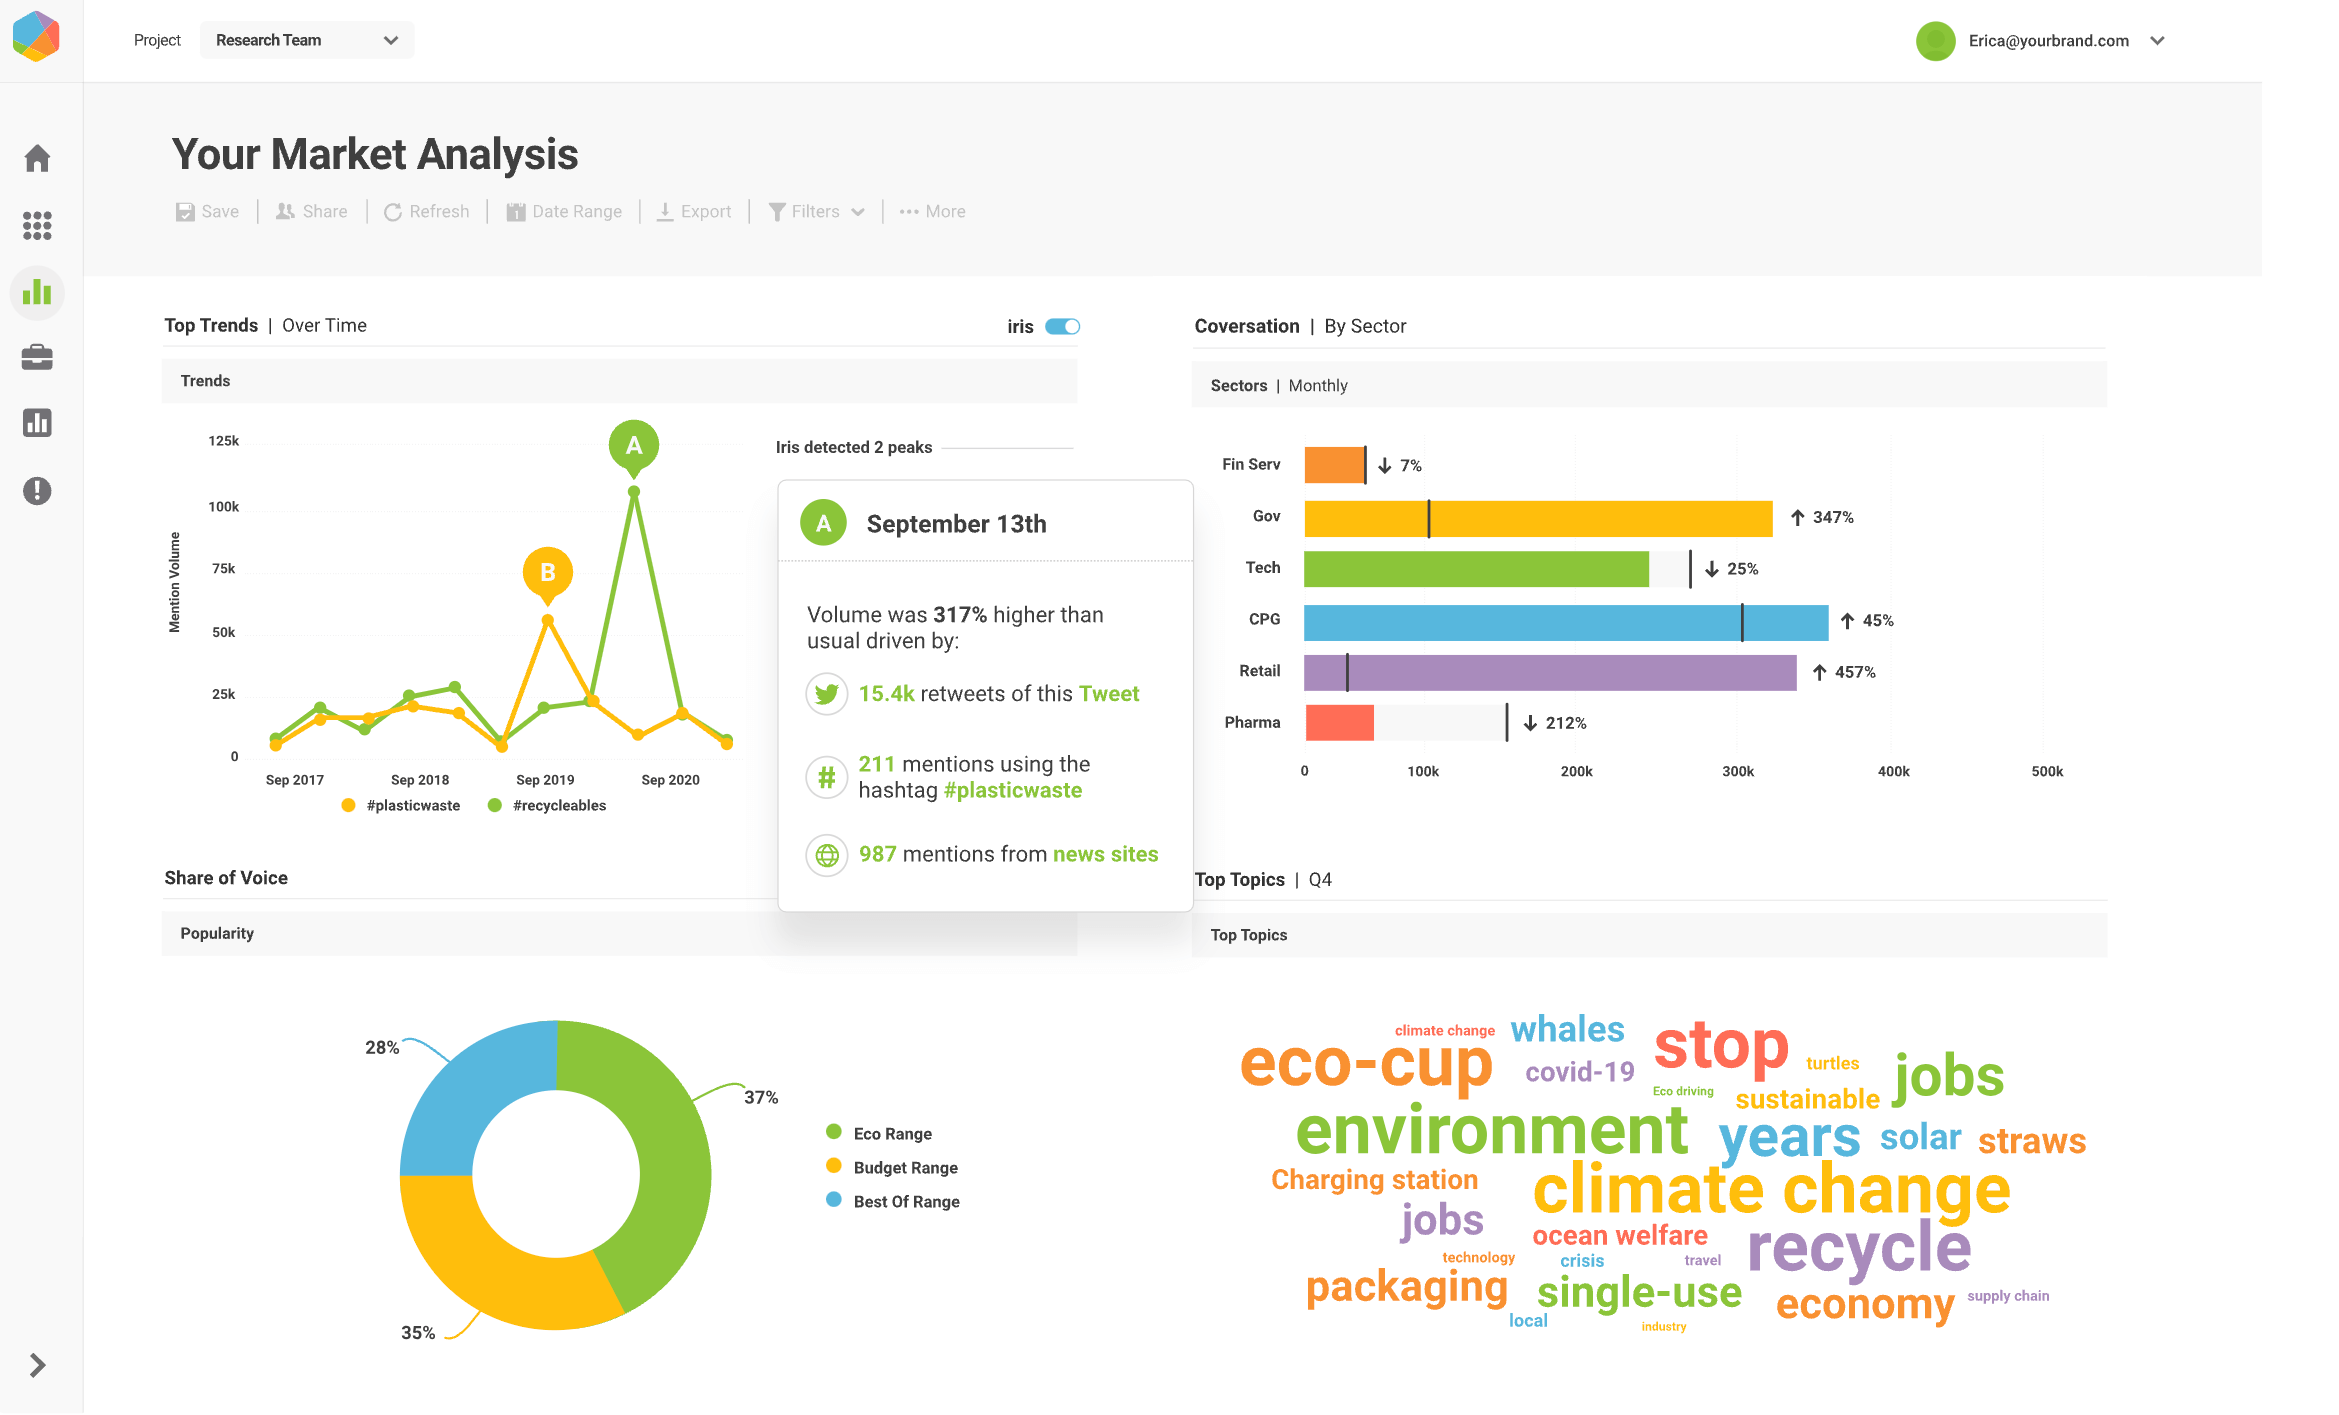
Brandwatch is a consumer intelligence and social media analytics platform, now part of Cision. It collects data from over 100 million social and online sources - including social networks, news, blogs, podcasts, forums, and paywalled media - and has been indexing data since 2009, giving it one of the largest historical datasets of any tool in this category.
The major 2025-2026 development is Iris AI, an intelligence layer embedded throughout the Brandwatch suite. "Ask Iris" is a natural-language chat assistant for querying data without building dashboards.
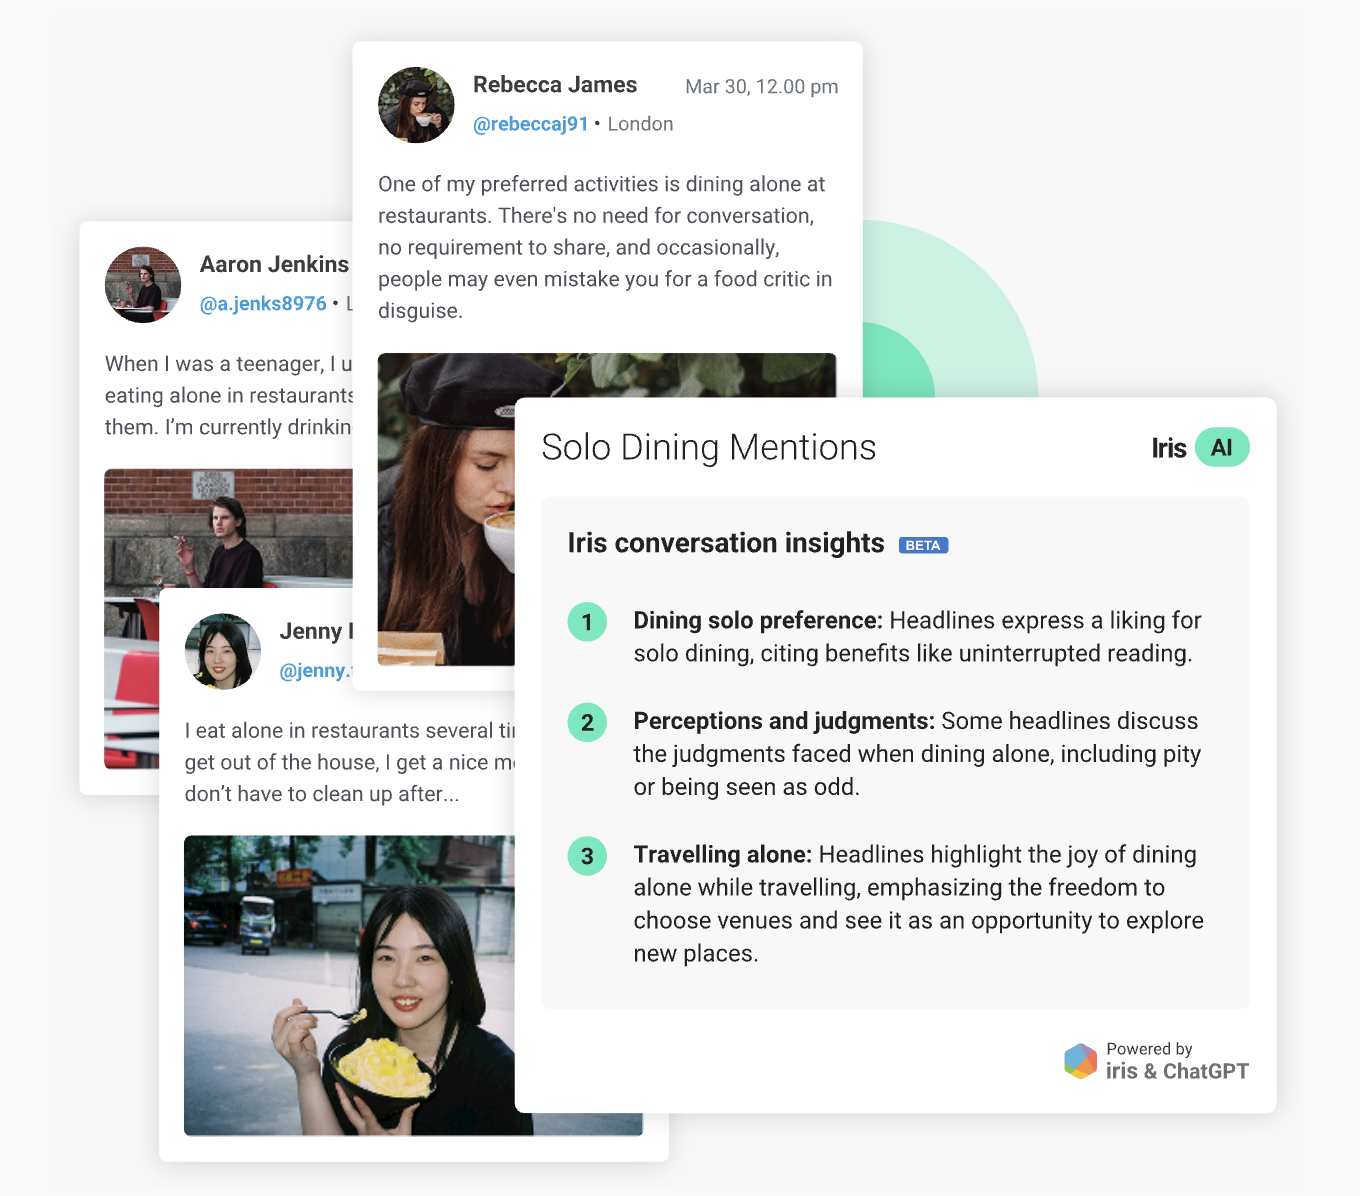
The AI Query Writer creates complete Boolean search queries from plain-language prompts - removing a historically complex setup step.
AI Dashboards automatically generate narrative summaries explaining the "why" behind trends. Data coverage expanded in 2025 to include Threads, TikTok, LinkedIn, YouTube, and over 70,000 podcasts.
Brandwatch is trusted by half of the Forbes 100. It's genuinely powerful and genuinely complex. New users face a real learning curve. And because pricing is entirely custom, you won't know the cost until you've been through a demo and sales process.
For enterprise teams with serious consumer intelligence needs, that's a reasonable trade. For agencies looking for a client-reporting tool, it's more than is needed.
Key features:
- Iris AI: "Ask Iris" natural language data querying
- AI Query Writer: Boolean queries from plain-language prompts
- AI Dashboards: automated narrative summaries of trends
- Data from 100M+ sources including podcasts, paywalled news, and social
- Consumer Research with machine learning trend detection
- Audience profile cards with demographic and psychographic data
- Sentiment and emotion analysis (30+ languages)
- Competitive benchmarking and share of voice tracking
- Salesforce, HubSpot, and Bynder integrations
- Influencer management (via Influence, formerly Paladin)
- Social media management suite (via Falcon.io)
- Custom engagement score aligned to your KPIs
- Brand threat detection and crisis alerts
- "Bring Your Own Data" integrations (2026 roadmap)
- Smarter video and image analysis (2026 roadmap)
- Mobile app (2026 roadmap)
Pros: Largest historical data archive in the category, Iris AI makes complex data exploration accessible, strong for enterprise consumer research, trusted by major global brands
Cons: Steep learning curve, pricing is entirely opaque (custom only), sentiment classification can require manual validation, interface can feel complex for reporting-focused teams
Pricing: Custom. Request a demo for a quote.
9. Rival IQ
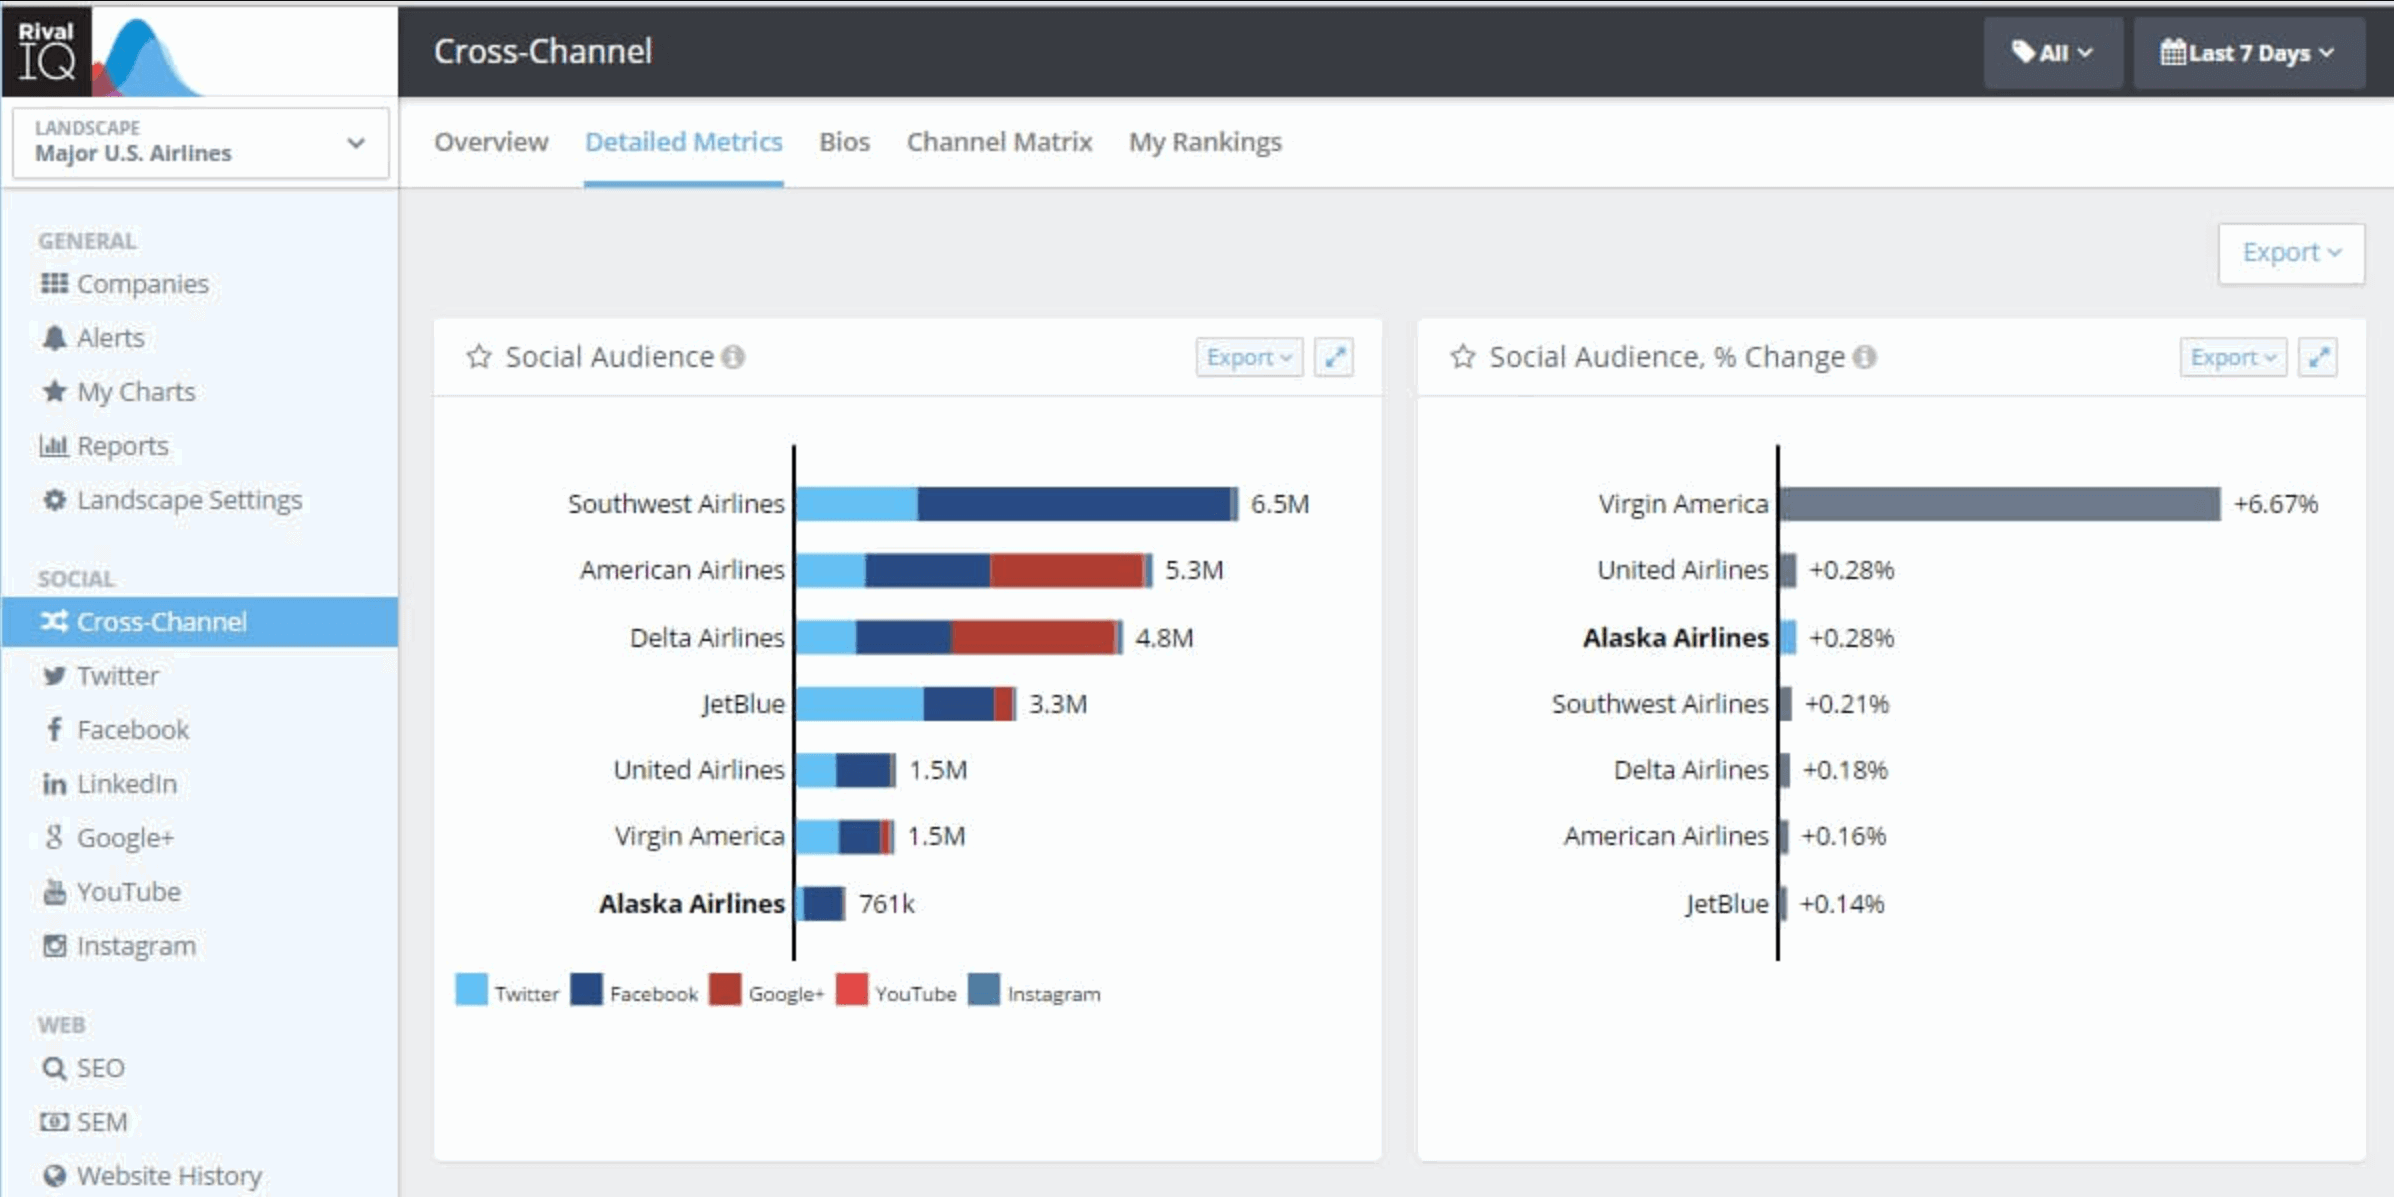
Rival IQ is purpose-built for competitive benchmarking. While most social analytics platforms include competitor tracking as a secondary feature, Rival IQ makes it the entire product.
You put your brand and its competitors into a "landscape" and the platform pulls everything - follower growth, engagement rates, posting frequency, top-performing content, boosted post detection, and profile attribute changes - into a side-by-side comparison.
The social listening features added in recent updates expand Rival IQ beyond pure metrics: you can now track conversations, monitor sentiment, and set keyword alerts. The platform also shows when a competitor has had a breakout post or significant performance shift, with real-time alerts so you can react rather than catch up at the end of the month.
The annual Social Media Industry Benchmark Report (covering 14 industries across Instagram, Facebook, X, and TikTok) is widely cited in the industry and is free to access - a good signal of the depth of data Rival IQ maintains.
The core limitation is that Rival IQ is analytics-only: no publishing, no scheduling, no inbox. It's a research and reporting tool, best used alongside a publishing tool rather than as a standalone.
Key features:
- Competitor analysis and benchmarking across X, Instagram, YouTube, LinkedIn, and TikTok
- Social media content performance comparison: engagement rates, follower growth, posting cadence
- Boosted post detection for competitor paid amplification
- Social post analysis: hashtags, content topics, timing, and format breakdown
- Social listening: keyword tracking and sentiment monitoring
- Real-time competitor alerts for breakout posts and profile changes
- Facebook Ads reporting (Engage plan and above)
- Estimated impressions (Engage Pro and above)
- Multi-handle private data comparison across clients
- Custom chart builder with flexible date ranges
- Unlimited landscape segments for client or industry grouping
- Automated email alerts and scheduled report exports
- Branded client-facing reporting portals
- Industry benchmark data of social media performance: engagement rates by platform and sector
Pros: In-depth competitive analysis, easy data visualization, industry benchmark reports are a strong value-add, continuously improving platform
Cons: Analytics-only (no publishing or scheduling), per-company tracking limits on lower plans, expensive relative to scope for smaller businesses, limited customization options
Pricing (as of May 2026):
Plan | Monthly price | Tracked companies | Data history | Users |
| Drive | $239/month | 10 | 6 months | 1 (+$10/user) |
| Engage | $349/month | 20 | 12 months | 2 (+$10/user) |
| Engage Pro | $559/month | 40 | 24 months | 5 (+$10/user) |
| Enterprise | Custom | Custom | 24 months | Custom |
10. Zoho Social
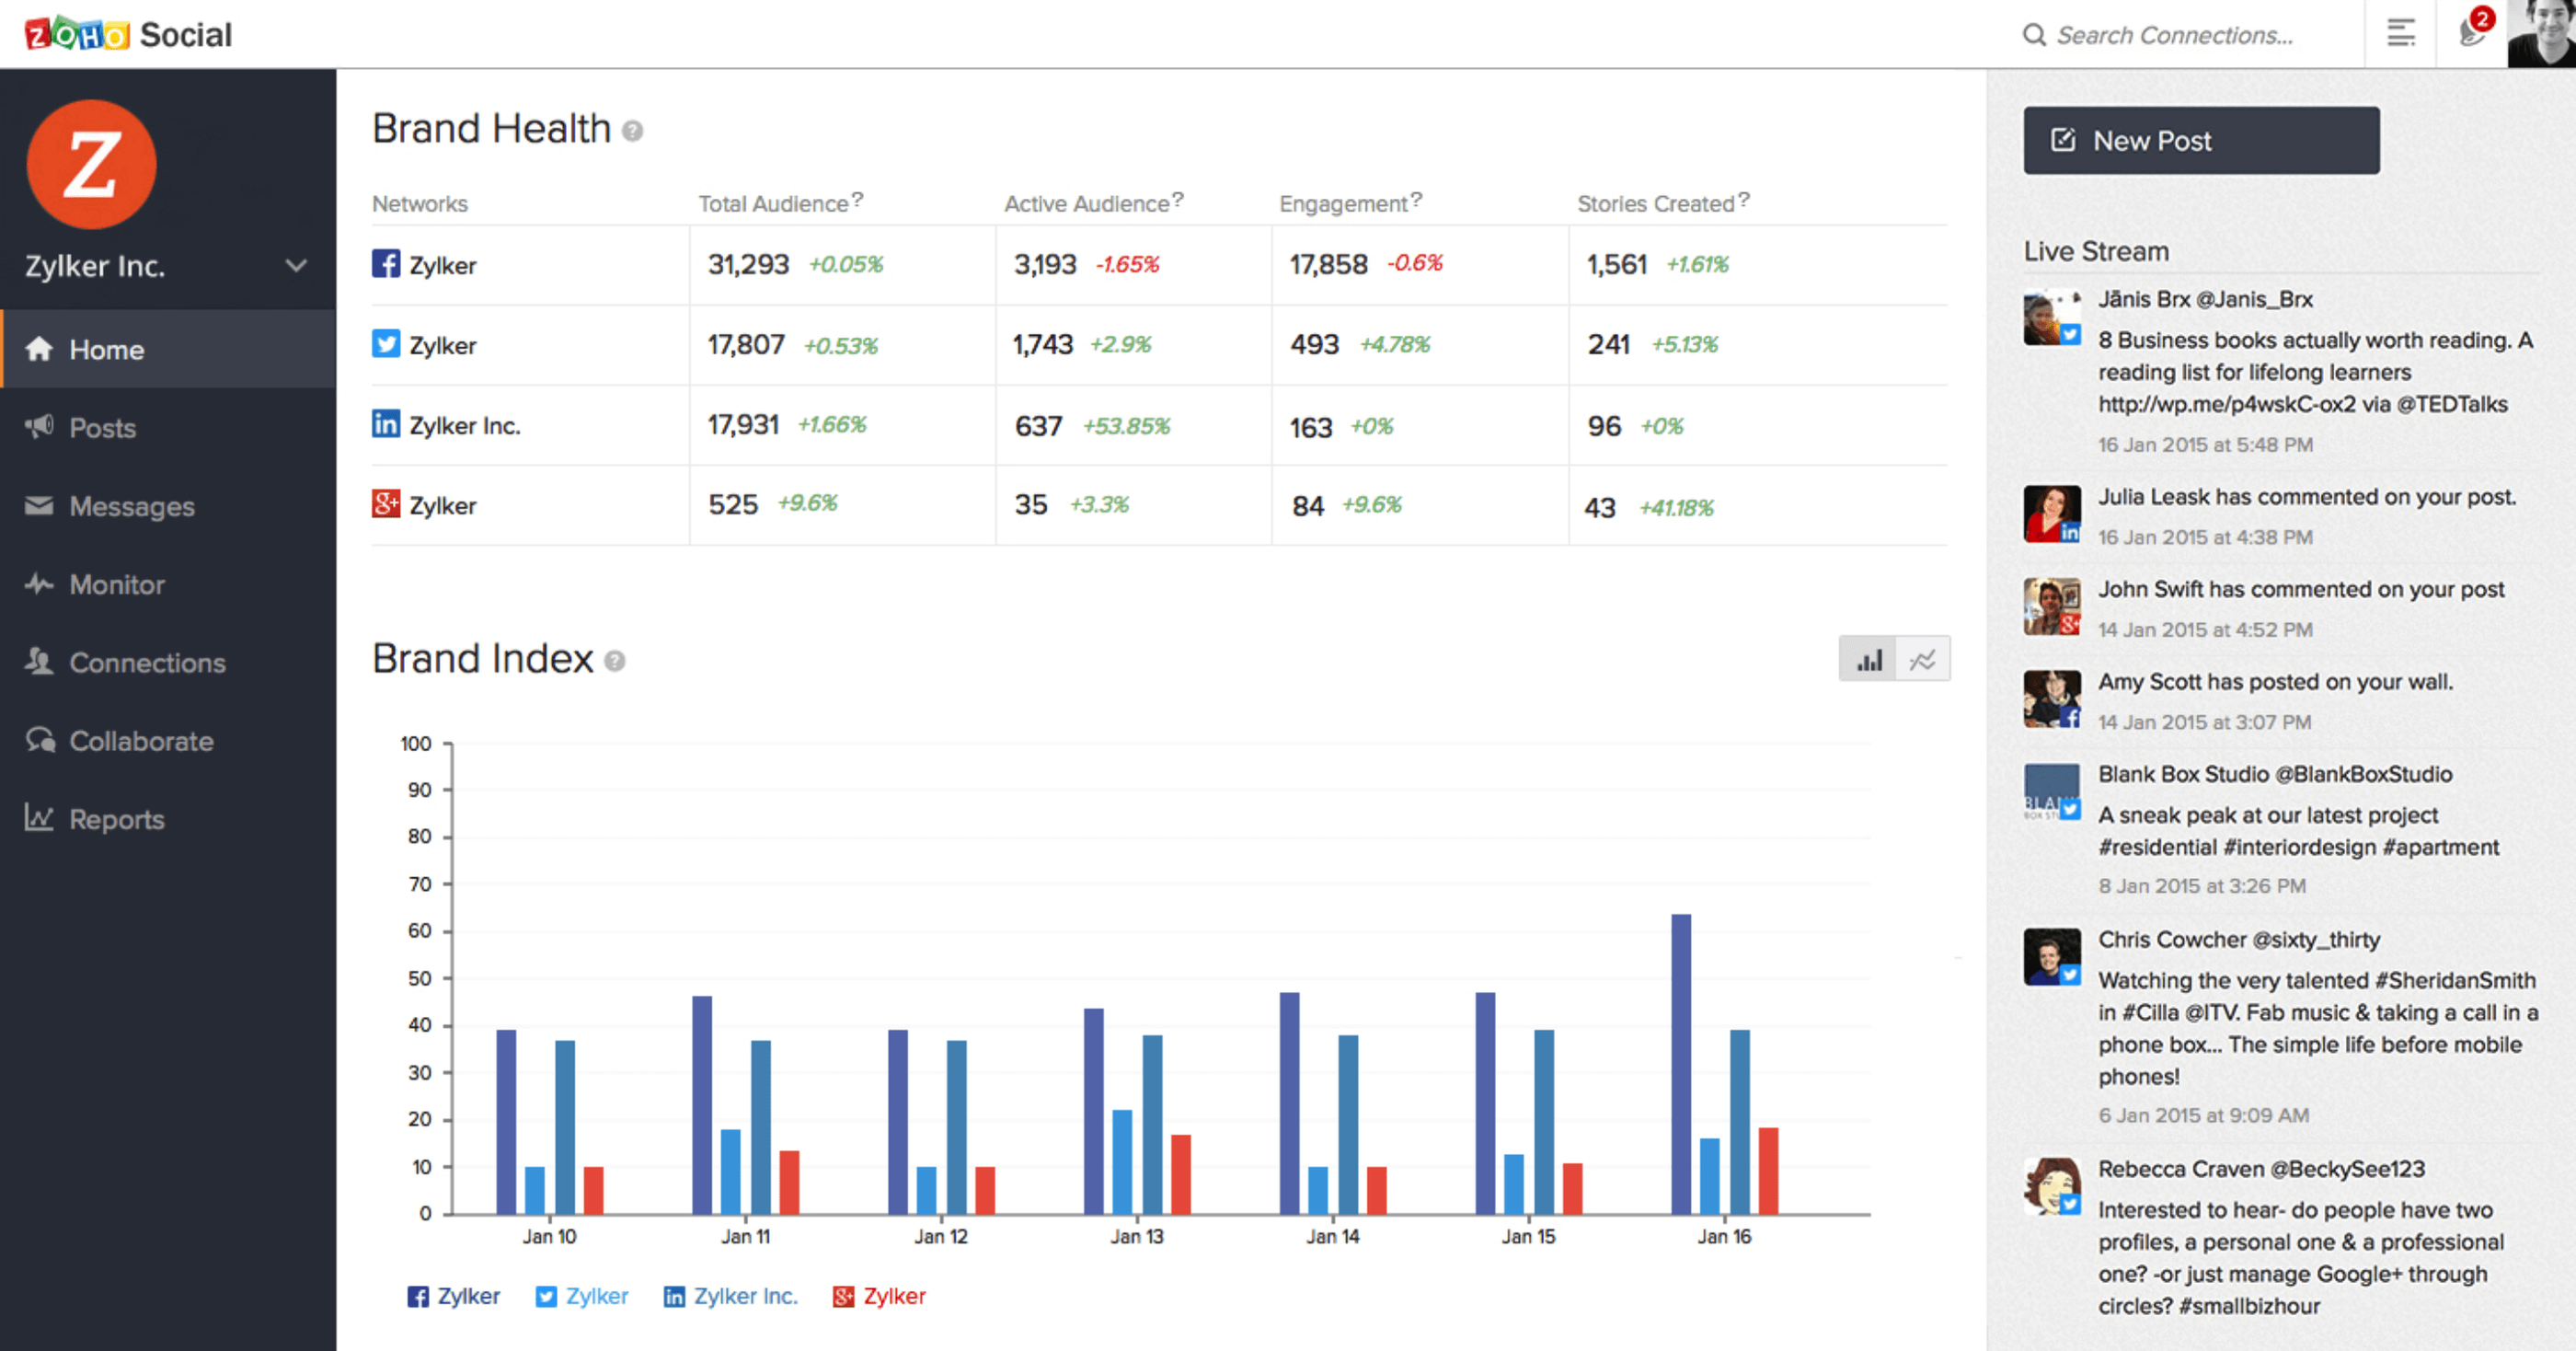
Zoho Social is a social media management and analytics platform built for small to medium-sized brands, with a pricing ladder that scales through to multi-brand agency use. Its free plan is one of the most capable in this category, covering 6 channels including X, Instagram, Facebook, LinkedIn, Google Business, and a profile page.
The standout analytical feature is SmartQ: Zoho's predictive scheduling engine that shows what percentage of your current audience is likely to see a post right now, and recommends the best time to publish. It also suggests the best time of day across different time zones, which is useful for brands with distributed audiences.
For teams already in the Zoho ecosystem, the integrations are a genuine advantage: Zoho CRM syncs lead data directly from social interactions (Professional and above), and Zoho Desk connects social support tickets into a customer service workflow. Zia, Zoho's AI assistant, generates social post copy and replies on all paid plans. Note that YouTube, WhatsApp Business, and Telegram only come in at the Premium tier ($65/month).
A recurring complaint in 2025-2026 reviews is the lack of TikTok integration and limited in-depth analytics - specifically the inability to analyze organic and paid content data separately. For teams that need that granularity, it's a real gap.
Key features:
- SmartQ predictive scheduling with audience likelihood scoring
- Scheduled posting across up to 280 channels (Agency Plus)
- Zia AI for social post and reply generation (paid plans)
- Custom reports with UTM tagging (Premium+)
- Monitoring dashboard with social listening (Professional+)
- Dedicated reports tab for per-network analytics
- Content approval workflows and role management (Premium+)
- Zoho CRM and Zoho Desk integration (Professional+)
- Client portal and branded reports (Agency)
- Mobile app for Android and iOS
- Repeat posting and content recycling (Professional+)
- Brand Index tracking and sentiment analysis
- Fans vs. other reach breakdown
- Pre-defined and customizable report segments
- Post approval system with role-based access
Pros: Generous free plan, SmartQ is genuinely useful for timing optimization, deep Zoho ecosystem integration, easy report customization, strong mobile app
Cons: No TikTok integration, limited organic vs. paid data separation, email-only support, analytics depth trails Sprout and Hootsuite, UI can feel dated
Pricing (as of May 2026):
Plan | Monthly billing | Annual billing | Brands/channels | Key features |
| Free | Free forever | Free | 1 brand, 6 channels | Scheduling, drafts, basic analytics |
| Standard | $15/month | $10/month | 1 brand, 10-11 channels | Bulk scheduling, media library, post insights |
| Professional | $40/month | $30/month | 1 brand, 10-11 channels | SmartQ, repeat posting, monitoring, Zoho CRM |
| Premium | $65/month | $44/month | 1 brand, 13-14 channels (adds YouTube, WhatsApp, Telegram) | Custom reports, UTM, team collaboration (3 members) |
| Agency | $320/month | $230/month | 10 brands, 130-140 channels | Client portal, branded reports, client logins |
| Agency Plus | $460/month | $330/month | 20 brands, 260-280 channels | Multi-client management, extended capacity |
11. Mentionlytics
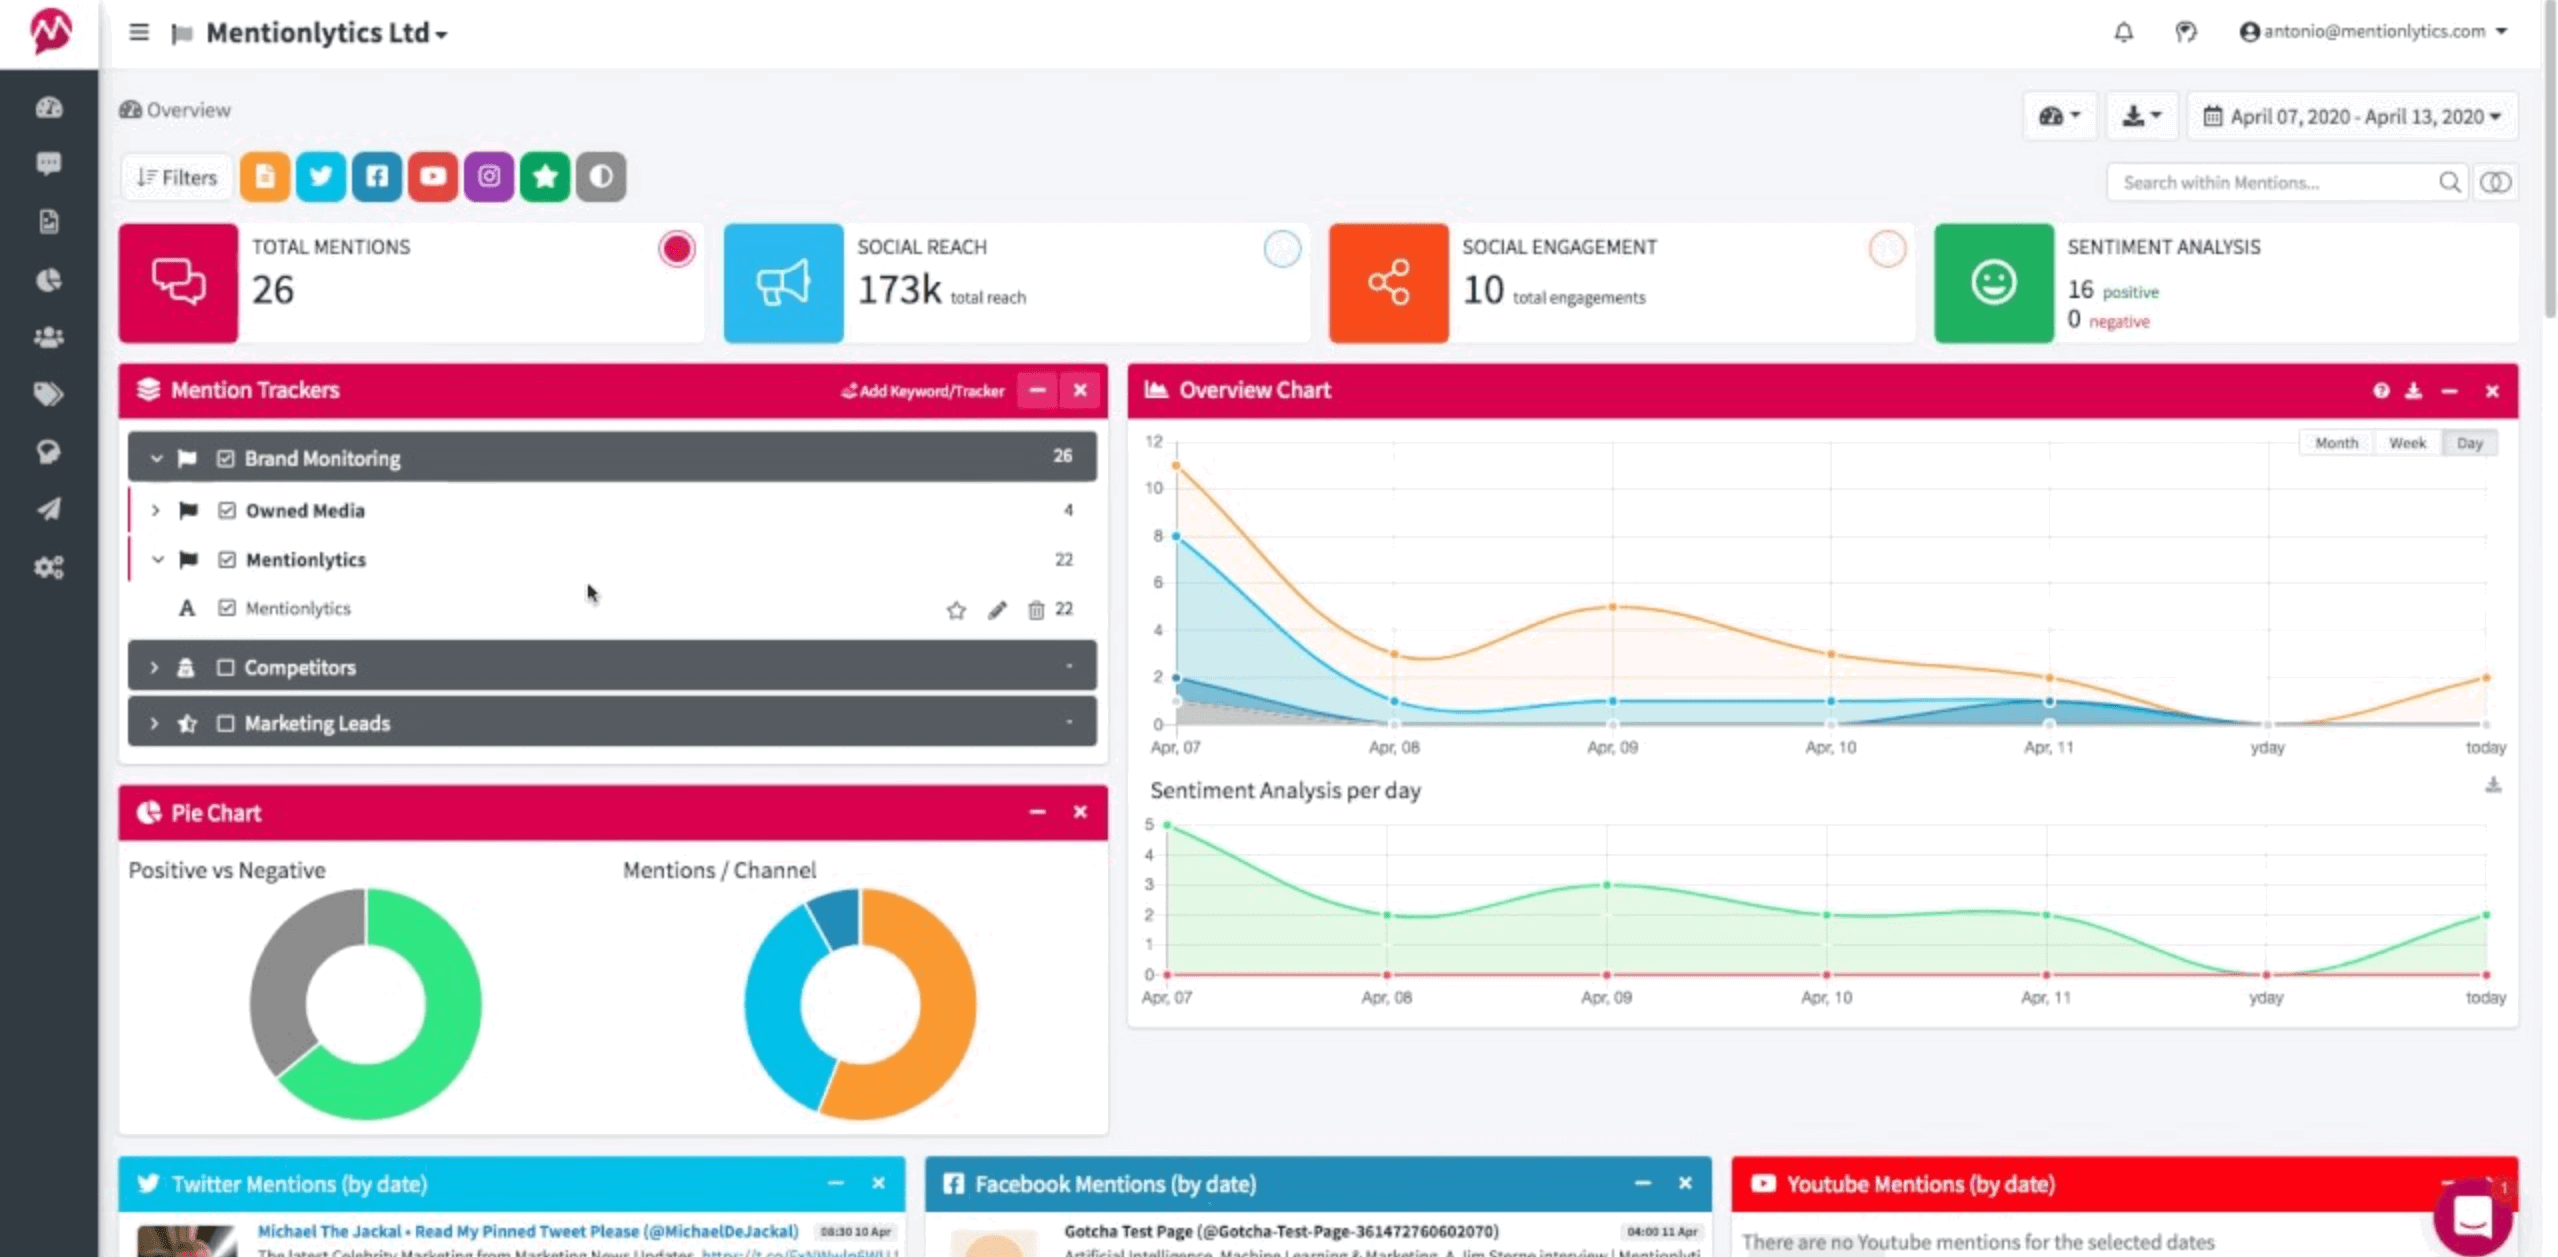
Mentionlytics is an AI-powered social media monitoring and brand intelligence platform that covers social networks, news, blogs, forums, YouTube, Reddit, and podcasts. It's one of the few tools at this price point that monitors across this range of sources while also providing AI-driven recommendations on what to do with the data.
The Social Intelligence Advisor (SIA) is Mentionlytics' AI layer. It doesn't just surface what's being said - it tells you what to do about it: actionable recommendations based on your monitoring data, delivered automatically.
Anomaly Detection flags unusual spikes or drops in mention volume before they become surprises. AI Emotion Analysis categorizes mentions beyond positive/negative into specific emotional responses, which is useful for PR monitoring and crisis detection. The AI Mention Translate feature translates any mention into English, Spanish, Portuguese, or Greek with one click.
For agencies managing multi-language or multi-market clients, the combination of 30+ language monitoring, Boolean search, and customizable dashboards per client makes Mentionlytics one of the more capable options in its price range.
Key features:
- Social media and web monitoring across social networks, news, forums, YouTube, Reddit, and podcasts
- SIA (Social Intelligence Advisor): AI-generated actionable recommendations
- Anomaly Detection: automatic spike and drop alerts
- AI Emotion Analysis: emotion categorization beyond positive/negative sentiment
- AI Mention Clustering: groups similar mentions to reduce noise (Pro+)
- AI Mention Translate: instant translation of mentions into 4 languages
- Boolean search for precise keyword queries
- Share of voice reports and competitor benchmarking
- Influencer identification and profiling
- Real-time alerts and customizable notification triggers
- White-label reports and custom dashboards (Pro+)
- Client portal access (Business+)
- Integrations with Slack, Hootsuite, Looker Studio, Power BI, and API access
- Managed Service add-on (Mentionlytics experts handle your monitoring)
- 30+ language sentiment analysis
Pros: Wide monitoring coverage including podcasts and forums, SIA makes insights actionable rather than just descriptive, reasonable pricing for the feature set, all plans offer free trials
Cons: Occasional slow loading times, keyword monitoring can return irrelevant results for broad terms, limited customization on lower plans
Pricing (as of May 2026, billed annually):
Plan | Monthly price | Keyword rules | Monthly mentions | Users |
| Basic | $49 | 3 | 5,000 | 2 |
| Essential | $141 | 10 | 15,000 | 10 |
| Advanced | $249 | 15 | 50,000 | Unlimited |
| Pro | $416 | 25 | 100,000 | Unlimited |
| Business | From $624 | 40+ | 200,000+ | Unlimited |
| Enterprise | From $1083 | 100+ | Custom | Unlimited |
12. BuzzSumo
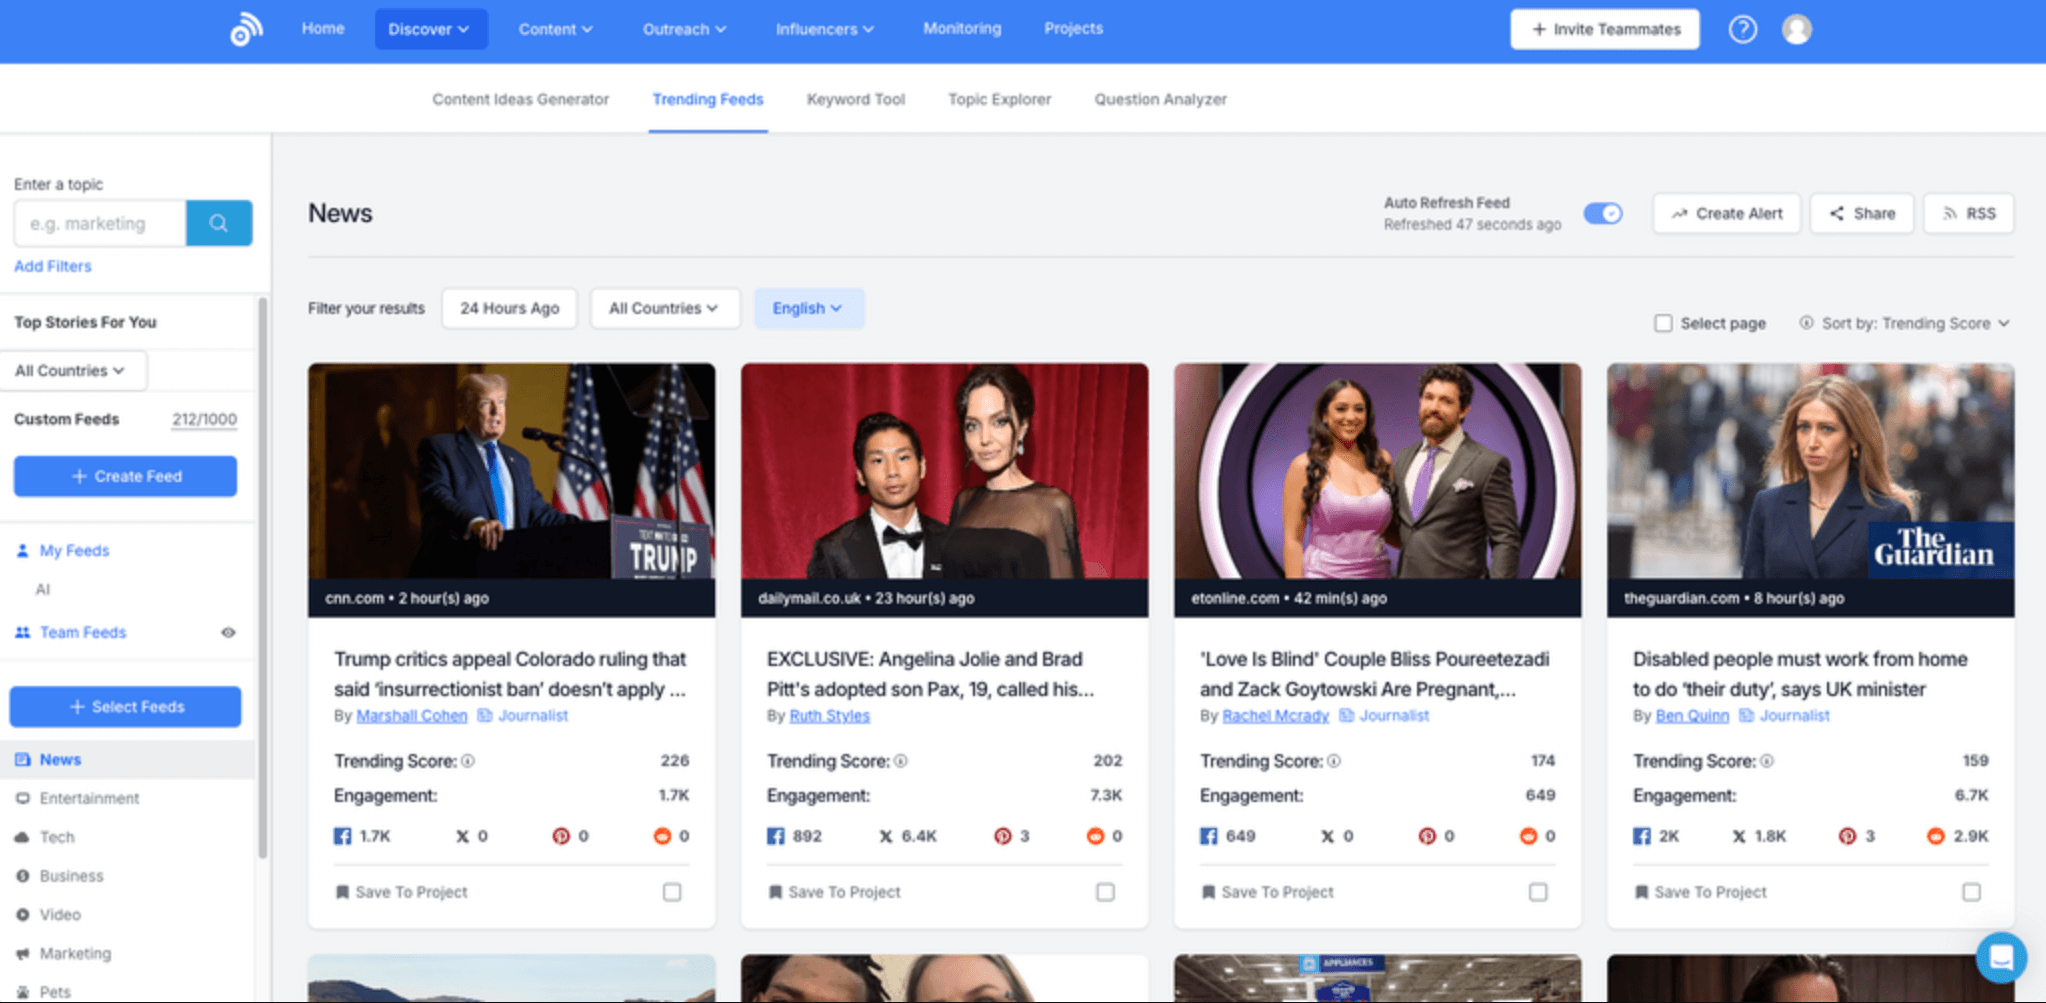
BuzzSumo is a content intelligence platform built around a single core question: what content is resonating, and with whom? It answers that by indexing content engagement data across Facebook, X, Pinterest, Reddit, and other web sources - showing you which articles, formats, and topics are getting the most shares and interactions in any niche.
It's used by content strategists, PR and comms teams, and agencies that produce a high volume of articles or campaigns and need data-backed topic selection rather than guesswork. The Content Analyzer surfaces top-performing content for any keyword or domain, making it a direct research tool for competitive content strategy. The Trending Now view shows what's gaining traction in real time.
The journalist and influencer discovery database is the other strong suit: you can find authors and creators covering specific topics, filter by engagement and reach, and set up alerts when they publish new content. This makes it useful for PR outreach alongside content research.
BuzzSumo is not a social media management tool. There's no scheduling, no publishing, no inbox. It's research-first. The pricing reflects its positioning as a specialist tool: plans start at $199/month, which is steep if you only need basic content ideas occasionally.
Key features:
- Content Analyzer: engagement data for any topic, keyword, or domain
- Real-time Trending Now feed for emerging content opportunities
- Top-shared content ranking across Facebook, X, Pinterest, Reddit, and web
- Journalist and influencer discovery with contact details
- Outreach tools for journalist and creator pitching
- Brand and keyword monitoring with real-time alerts
- Competitor domain analysis: what content is working for rivals
- Backlink analysis for content SEO strategy
- Question analyzer: what questions audiences are asking
- Content alerts for brand mentions, competitor updates, or keyword spikes
- Topic clustering for content gap identification
- YouTube content analytics
- Historical data access (2-5+ years depending on plan)
- Slack alerts for real-time notifications
- API access (Suite and Enterprise plans)
Pros: Best content research tool in its class, excellent influencer and journalist database, accurate social share counts, strong for PR and content strategy teams
Cons: No scheduling or publishing, expensive for occasional use, content curation can surface repetitive results, higher plans required for advanced features like full historical data and backlink analysis
Pricing (as of May 2026, billed annually):
Plan | Monthly price | Usage limits | Data history |
| Content Creation | $199/month | 2k articles/month | 2 years |
| PR & Comms | $299/month | 10k articles/month | 3 years |
| Suite (Most popular) | $499/month | Unlimited | 5 years |
| Enterprise | $999/month (annual only) | Unlimited + full API | 5+ years |
How to choose a social media analytics tool
The right platform depends on where you spend most of your time and what you do with the data after you have it. A few frames worth thinking through:
If you manage reports for clients, the key questions are: can you white-label it, can you automate delivery, and can you blend cross-channel data without rebuilding everything for each client? Whatagraph, Sprout Social, and Metrics Watch are built for this workflow.
If competitor intelligence is the priority, Rival IQ and Brandwatch are the strongest options. Keyhole is worth considering if influencer tracking matters.
If you're a small brand or solo marketer, Buffer's free plan or Zoho Social's Standard plan give you solid fundamentals without a significant cost commitment.
If you primarily need to understand how social drives website behavior, GA4 is free and remarkably powerful once it's properly configured.
The best tool is the one your team will actually use consistently, not the one with the longest feature list. Pick based on your real workflow.
Published on Aug 05 2024
WRITTEN BY
Brinda GulatiBrinda Gulati is a fractional content marketer and freelance writer who specializes in data-driven storytelling and writing easy-to-understand, informative content for humans. She has two degrees in Creative Writing from the University of Warwick, and believes that above all, stories are a deeply human endeavor. She has two dogs, knows thrifting spots, and loves afternoon naps.