


TL:DR
Supermetrics is a marketing intelligence platform built around data connectivity and infrastructure. With its new AI Agents (launched early 2026), it now automates analysis and dashboard creation, but reporting, branding, and presentation typically happen in external tools.
Who it’s best for:
Enterprises or data-savvy teams with in-house BI infrastructure who only need a pipeline, not visualization, automation, or client reporting.
Key features at a glance:
| Feature | Supermetrics |
| Integrations | 130+ connectors, but depth and reliability can be mixed; some are premium or paid add-ons. |
| Stable connections? | Frequent complaints about broken connections and the need for re-authentication. |
| Ease of use | Steep learning curve, especially for non-technical users; clunky and dated interface. |
| Data blending | Available, but in-platform guidance on execution is limited. |
| Internal dashboards | None; Supermetrics is purely a data pipeline. |
| Customizable reports | No real reporting; requires an external BI tool for all customization and branding. |
| Report sharing & automation | Requires external tools for scheduling, formatting, and sharing reports. |
| Security | GDPR & CCPA compliant, SOC 2 Type II certified, SSL encryption, 2FA, SSO on higher-tier plans, role-based access (implied, not explicitly detailed for all tiers). |
Pros ✅
- Broad range of 130+ marketing data connectors
- Helps centralize marketing data from various sources
- Gets the core job of data pulling done reliably when connections are stable
- Supports various data destinations like Google Sheets, Looker Studio, and data warehouses
Cons ❌
- Unpredictable and opaque pricing model (per destination, per data source, per user, per account)
- Frequent complaints about missing or unreliable data due to connection breakages
- Steep learning curve with a clunky user interface
- Support is often gated by higher-tier plans
Why You Can Trust This Review
At Whatagraph, we live and breathe marketing data every day. That’s why this review is grounded in real use, real numbers, and real user pain points.
Here’s what we did:
- Fact-checked against live docs: Pricing, feature limits, and security claims are captured straight from the vendor’s public pages.
- Hands-on sandboxing: GA4, HubSpot, Shopify, Instagram—you name it, we connected it.
- Tracked real-world user discussions: Recent, verified G2, Capterra, and Trustpilot reviews; public forum threads, and help-center discussions are scanned for recurring themes—things that crop up more than once end up on our radar.
- Timed the help desk: We file an ordinary “how-do-I” ticket, then clock how long it takes to get a human, actionable answer.
- Scored against agency must-haves: From stable integrations to client-ready reporting to quality of customer support.
We want you to walk away feeling informed and ready to make a smart, confident decision that benefits your team and your clients.
Supermetrics Pricing
Supermetrics’ pricing page shows familiar tiers like "Starter," "Growth," and "Enterprise", with monthly fees that seem to start reasonably for a SaaS tool.
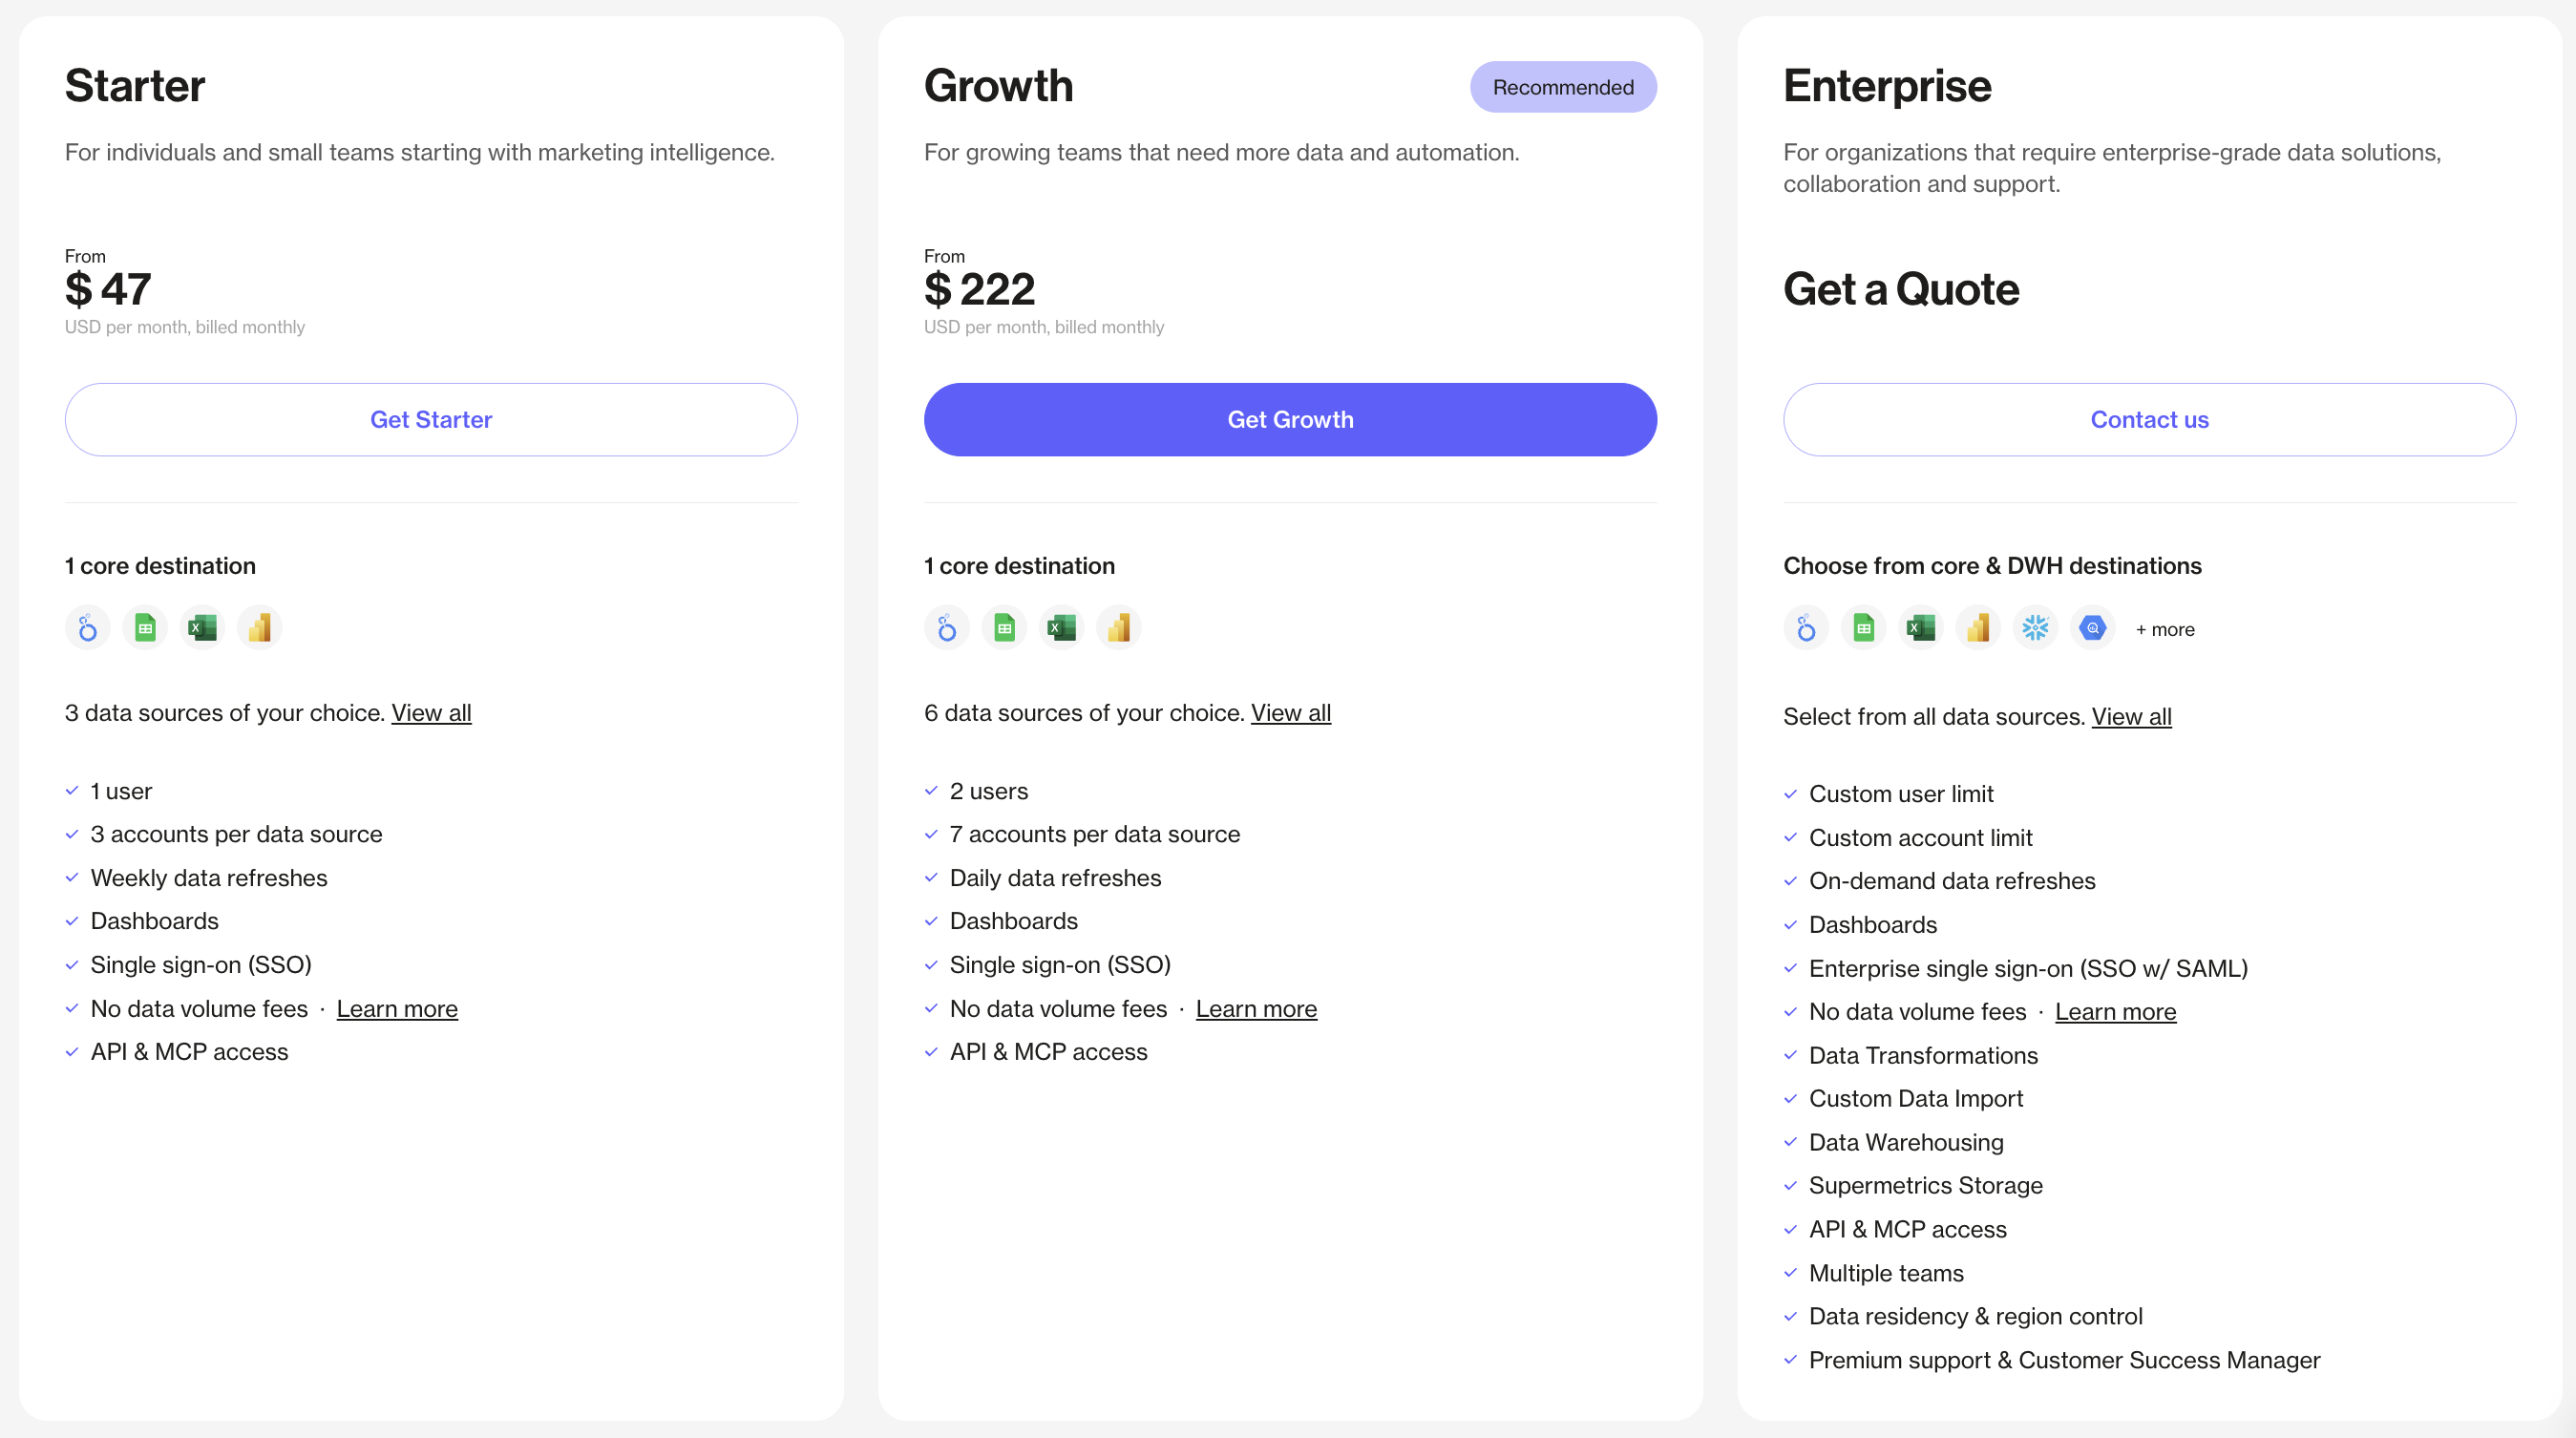
Here's how the plans break down:
| Plan | Starter | Growth | Enterprise |
| Starting Price (Monthly Billing) | $47/month | $222/month | Custom |
| Core Destinations | 1 | 1 | Core + Data Warehouse options |
| Data Sources Included | 3 | 6 | All available |
| Accounts per Data Source | 3 | 7 | Custom |
| Users | 1 | 2 | Custom |
| Data Refresh Frequency | Weekly | Daily | On-demand |
| Dashboards | Yes | Yes | Yes |
| SSO | Standard SSO | Standard SSO | Enterprise SSO (SAML) |
| Data Transformations | ❌ | ❌ | ✅ |
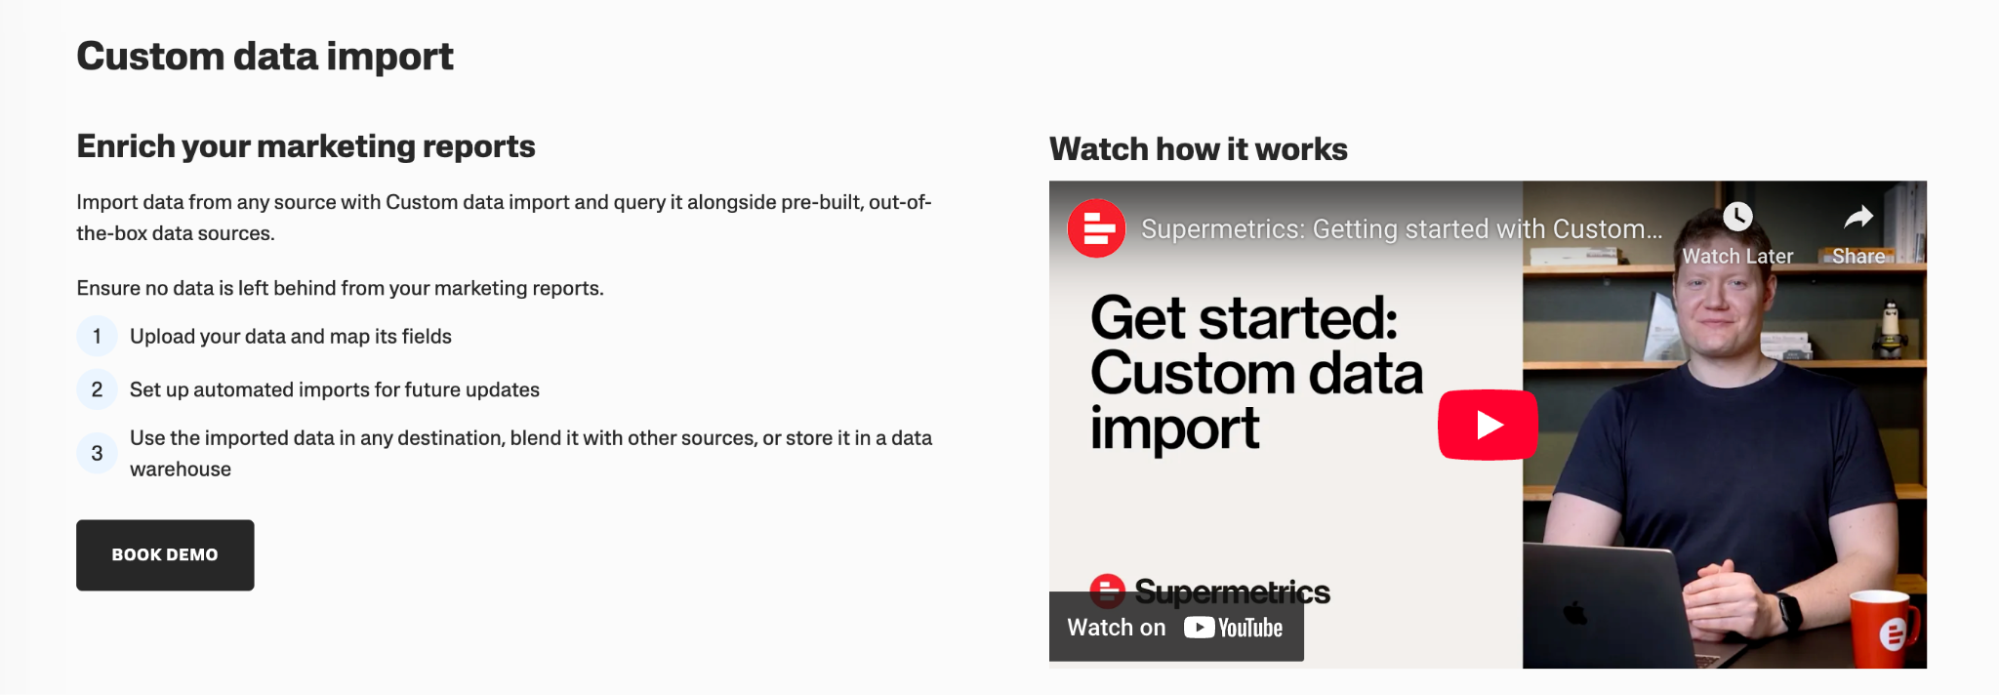
| Custom Data Import | ❌ | ❌ | ✅ |
| Data Warehousing | ❌ | ❌ | ✅ |
| Supermetrics Storage | ❌ | ❌ | ✅ |
| Multiple Teams | ❌ | ❌ | ✅ |
| Premium Support & CSM | ❌ | ❌ | ✅ |
| API & MCP Access | ✅ | ✅ | ✅ |
| Data Volume Fees | None | None | None |
A few important things jump out:
1. You only get 1 destination on Starter and Growth. If you need to send data to both Looker Studio and a warehouse? That’s not included.
2. Data source limits are tight. 6 sources on Growth sounds generous, until you count: Google Ads, Meta, LinkedIn, GA4, TikTok, Shopify… you’re already maxed out.
3. Account limits scale fast for agencies. Growth includes 7 accounts per source. Managing 15 Meta ad accounts? You’ll hit that ceiling.
4. The powerful features live in Enterprise. Data transformations, warehousing, storage, multi-team setup — all gated behind custom pricing.
Despite the introduction of Supermetrics AI, Supermetrics is still priced like a data pipeline tool. You’re paying for:
- Number of sources
- Number of accounts
- Number of destinations
- Refresh frequency
- Infrastructure features
And you’ll still need another tool for visualization and client reporting. That’s where the real cost, and complexity, starts to stack.
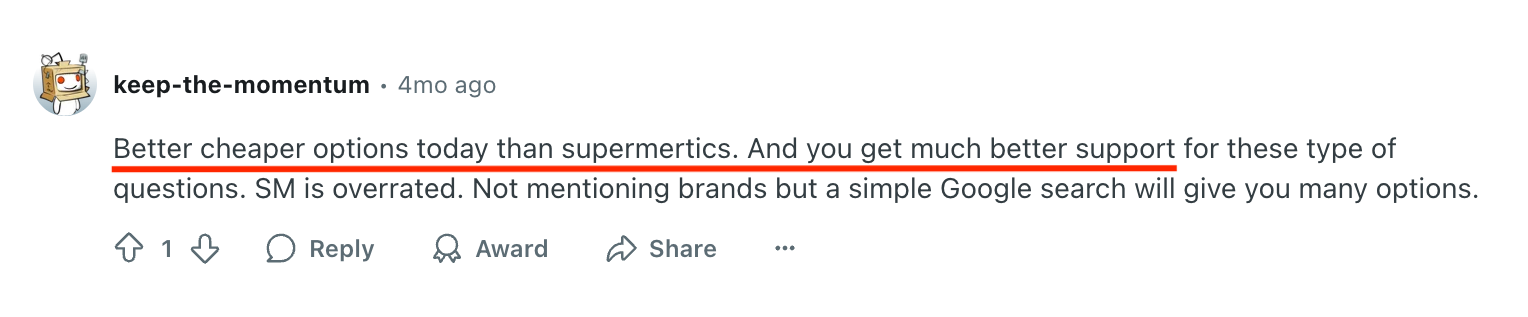
A Reddit user in r/DigitalMarketing flat out calls Supermetrics “overrated” especially because there are “better cheaper options today,” plus you get “much better support.”
 Most small to mid-sized agencies (5–15 clients), particularly those handling complex ecommerce datasets or extensive social media campaigns, will realistically spend $600–$1,200/month.
And that’s just for Supermetrics. You'd still need to pay extra for a visualization tool.
Agencies juggling multiple destinations or syncing frequently (e.g., hourly reports) often find themselves nudged into enterprise tiers. At that point, you’re in custom pricing territory…and that’s rarely budget-friendly.
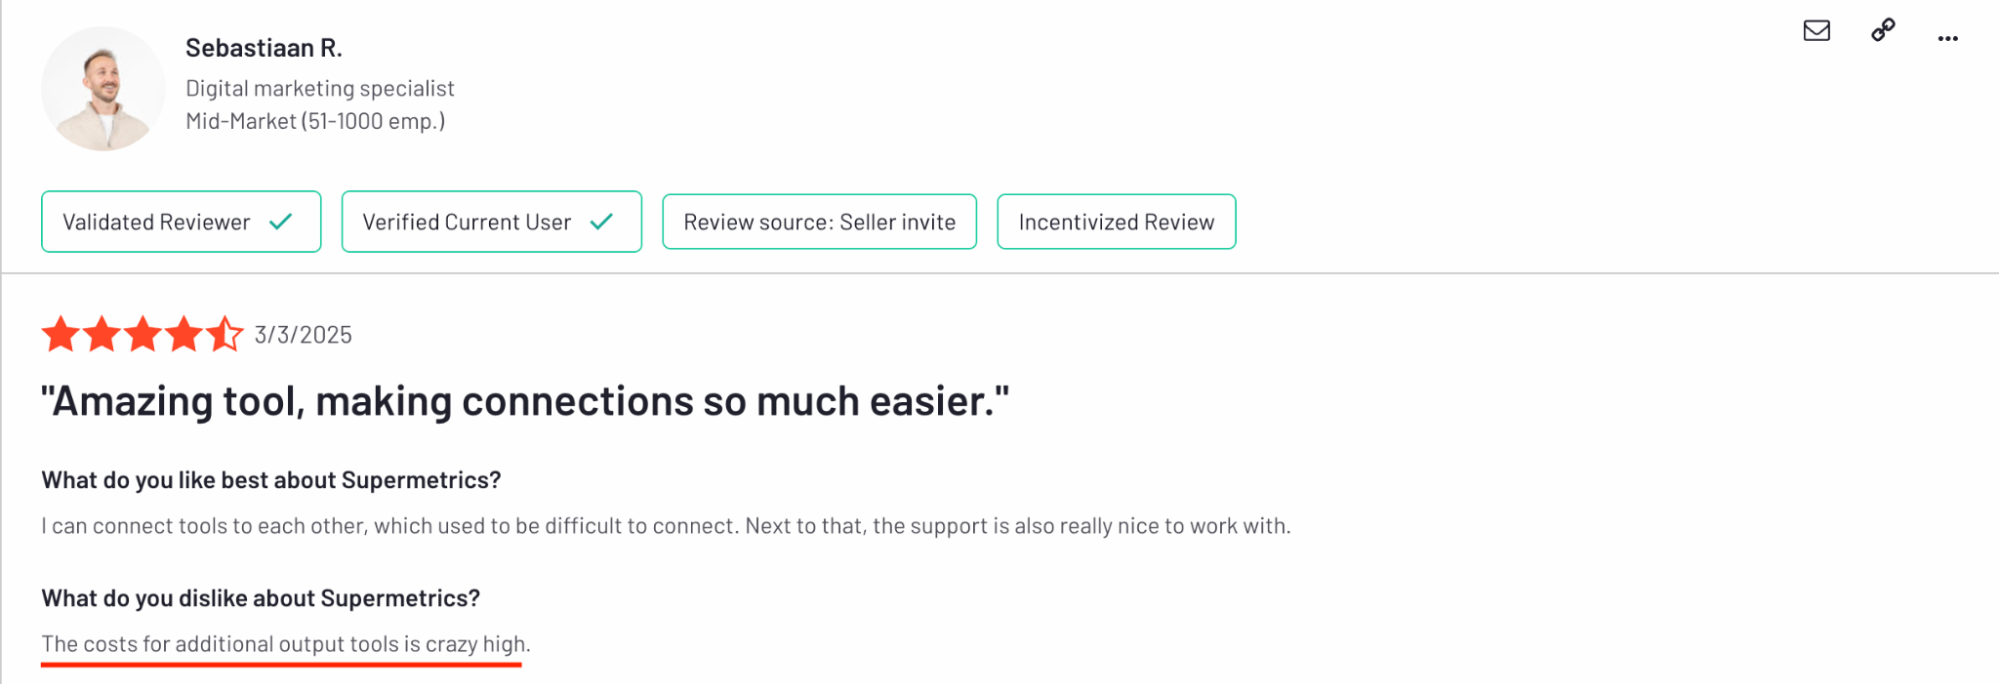
Of the 12 recent, verified reviews on G2 in 2025, four of them—a third—mention Supermetrics’ pricing as something they dislike most about the platform.
Like Sebastiaan R, a digital marketing specialist who says:
“The costs for additional output tools is crazy high.”
Key takeaways for your budget
- Calculate the true total cost of ownership (TCO): Don't just look at the Supermetrics sticker price. Consider the "Extras," the cost of your separate visualization tool, the internal hours spent managing two systems, and troubleshooting broken connectors. When comparing Supermetrics to an all-in-one platform like Whatagraph, the TCO for Supermetrics + VizTool can be surprisingly high.
- Primary cost drivers scale quickly: Additional data sources cost $29 each, destinations $149 each, and users $29-$99 each, depending on the plan.
- Plan limits don't match real-world usage: The Starter plan's 3 data sources cover basic Google Ads + Facebook Ads + GA4, but most agencies need LinkedIn, email platforms, and multiple ad accounts. The Growth plan's 7 sources may seem adequate, but quickly fill up when managing multiple clients with diverse platform needs.
Heads up: These numbers assume everything works perfectly. Factor in the time cost of managing broken connections, troubleshooting with two different support teams, and training staff on multiple tools—and the real cost gets much higher.
Now compare this to an all-in-one marketing reporting platform like Whatagraph.
Supermetrics charges you to move data.
Whatagraph is built to centralize, visualize, automate, and explain it, in one platform.
Also, Whatagraph's pricing scales with your needs. Check out our pricing page for the most up-to-date information.
Now let’s zoom out. Here are the key structural differences between Whatagraph and Supermetrics’ pricing:
1️⃣ Connector vs All-in-One Platform: Supermetrics is a data pipeline. Whatagraph includes data pulling, visualization, automation, white-labeling, and AI insights in one tool.
2️⃣ Paid Entry vs Free Forever: Supermetrics has no free tier. Whatagraph offers a true free-forever plan, no credit card required and no time limits.
3️⃣ User Limits vs Unlimited Users: Supermetrics caps users on lower tiers. Whatagraph includes unlimited users on every plan.
4️⃣ Destination-Based vs Credit-Based Scaling: Supermetrics pricing depends on data sources, accounts, destinations, and users. Whatagraph scales by source credits, not by users or reports.
5️⃣ Two-Tool Workflow vs Built-In Reporting: Supermetrics requires Looker Studio or another BI tool for reporting.Whatagraph includes dashboards, automated reports, and AI summaries natively.
6️⃣ Enterprise-Gated Features vs Mid-Tier Unlocks: Supermetrics locks advanced features behind Enterprise. Whatagraph unlocks transformations, white-labeling, and data transfers earlier (Boost plan).
Start free trial with Whatagraph today (then commit later).
Real User Reviews: What are Customers Saying About Supermetrics?
I didn’t just comb through independent review sites like G2, Capterra, and Trustpilot. I also scoured Reddit threads, YouTube comments, X posts, and even Instagram reels where marketers vent in plain sight.
The goal is to surface the real stuff: what users love, what drives them up the wall, and the patterns that show up again and again—no matter where they’re talking.
Supermetrics pros: What users love
✅ Broad range of integrations and connectivity options
Supermetrics shines when it comes to breadth. If your marketing stack looks like a giant Jenga tower—GA4 for SEO and website analytics, Meta Ads and LinkedIn for social media campaigns, TikTok, Shopify for ecommerce, HubSpot, the works—there’s a good chance Supermetrics has a connector for it.
A recent, verified review on G2 praises Supermetrics’ ability to tap into different social media marketing sources:
The options available and settings are great and there's a ton of platform integrations they connect with.
✅ Easily gathers your data for simpler reporting
Supermetrics is a big help when you need to bring marketing data together from lots of different places. People use it all the time to pull data from their main online tools and send it straight to programs like Google Sheets, or to get it ready for Looker Studio.
It’s praised as a “great tool for data-driven marketers” and even a “game-changer” for marketing analysts and businesses that need “automated, accurate, and easily accessible reporting.”
✅ Gets the core job done
Many appreciate that Supermetrics simply delivers on its main promise: getting your data where it needs to go. If your primary goal is to pipe information from your marketing platforms directly into a tool like Looker Studio, users find it does exactly that.
Like Jayden H., a Digital Marketing Manager who says:
It does what it's supposed to. Helps me get data in Looker Studio.
Supermetrics complaints: Where users get frustrated
❌ Pricing feels opaque and manipulative
Users report feeling nickel-and-dimed. Adding a new connector might require a contract update. Legacy features get reclassified into higher tiers. And you might not even find out until your report breaks—or your invoice suddenly jumps.
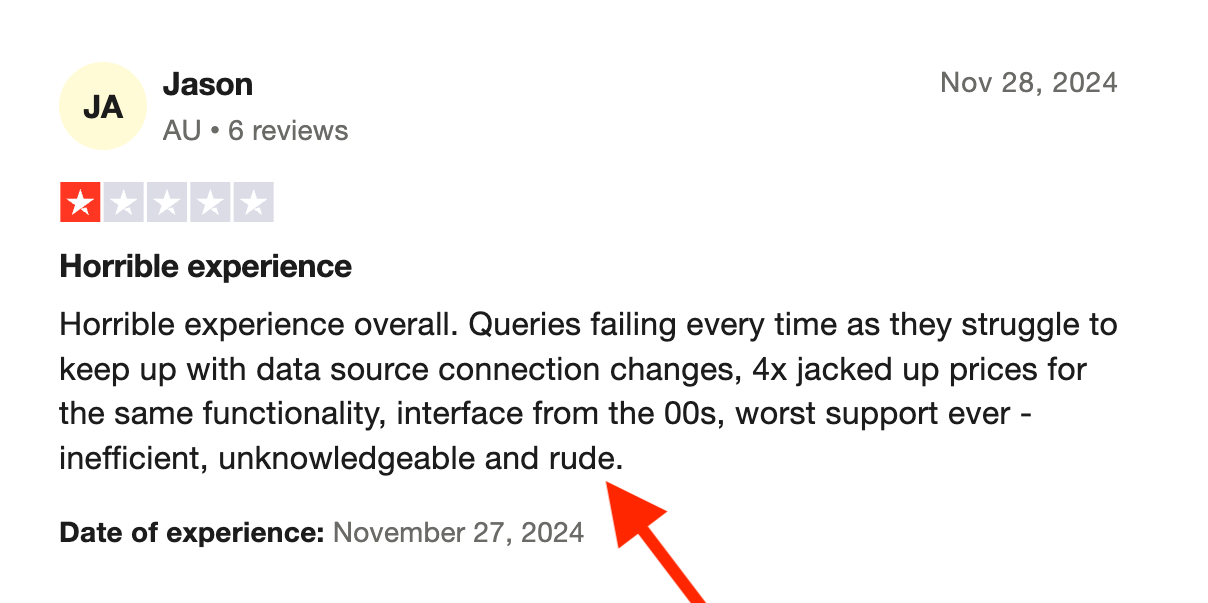
On X, Cory Dobbin posted a scathing Supermetrics complaint earlier this year: “It's crazy to me how expensive Supermetrics is for what is one of the most unreliable tech products I've ever used.”

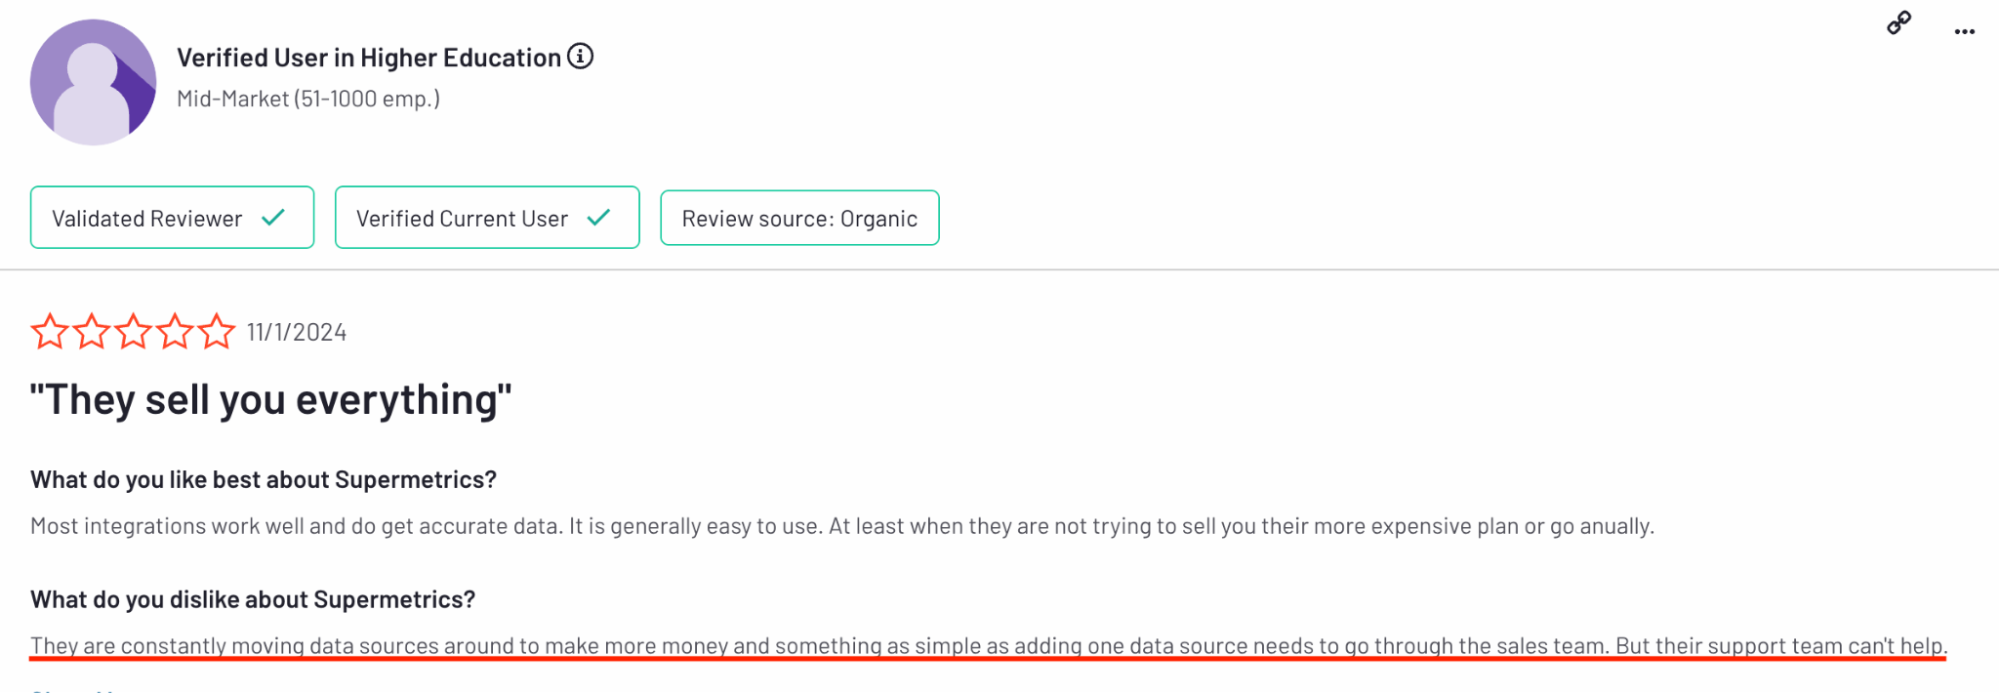
A verified reviewer on G2 complains: “They are constantly moving data sources around to make more money and something as simple as adding one data source needs to go through the sales team. But their support team can't help.”
On Trustpilot too, Supermetrics hasn’t curried favor with users recently.
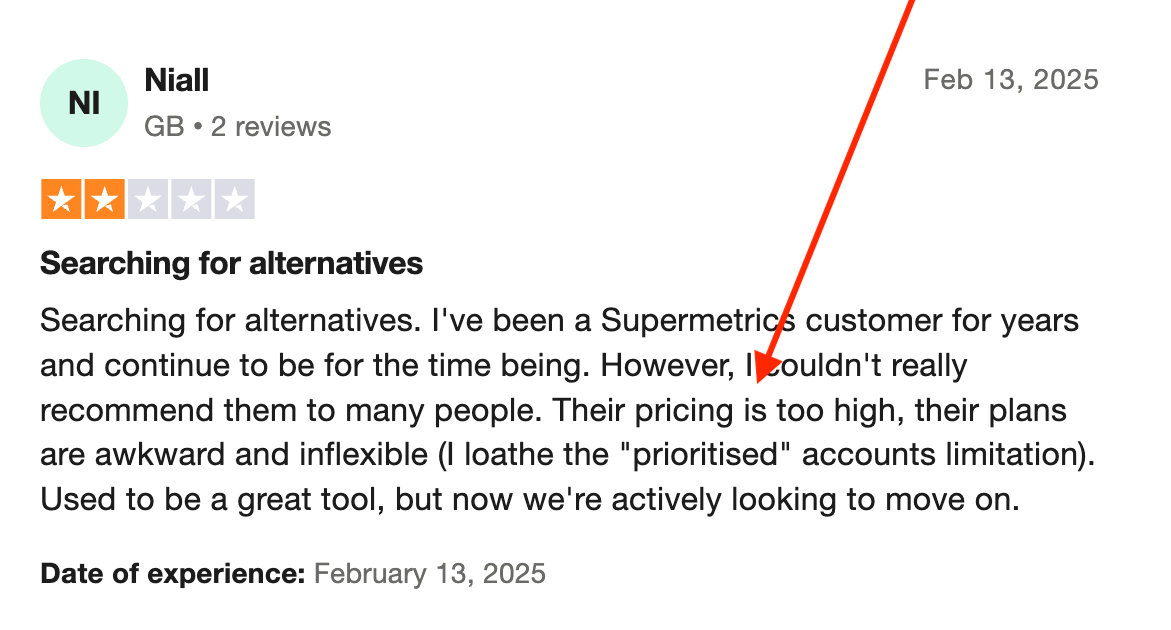
Niall complains: “Their pricing is too high, their plans are awkward and inflexible (I loathe the "prioritised" accounts limitation).”
 ❌ Steep learning curve and clunky user experience
Some connectors require multi-step setups, and platform logic isn’t always obvious—especially if you're switching between their Sheets and Looker Studio connectors. That means onboarding can eat up valuable hours (or days), especially for junior staff.
As a verified user points out: “The UI is sometimes hard to learn and not that intuitive.”
Another user echoes this sentiment:
The initial configuration can be confusing, especially for first-time users. Some connectors require extra steps that aren’t always intuitive.
❌ Support is gated—and not always helpful
You’re often on your own unless you’re on a premium plan. Even then, support may direct you to paid upgrades rather than fix the issue. So when a connector breaks—or a data source moves—you’re left either waiting, escalating, or coughing up more money.
Even though users praise the support team for guiding them with screenshares, they still complain that:
Support team isn't always able to help - they have a solution but it sometimes costs more money because you aren't paying for the service or solution.
❌ Account management is rigid and inconvenient
If your agency has multiple clients or shared logins, you’ll probably hit friction. Supermetrics ties everything to individual Google accounts, which creates access headaches when onboarding team members, shifting ownership, or collaborating across teams. It’s not built for flexibility.
Kayla T., in an incentivized review on G2, shares her gripe:
I wish Supermetric accounts weren't tied to Google accounts. It makes working cross-functionally very difficult. I also struggle with choosing between the sheets vs. data studio connectors because it limits our ability to analyze and present data sometimes.
What Does the “Two-Tool Workflow” Look Like Daily With Supermetrics?
‼️ NEW: Since we wrote this piece, Supermetrics has introduced Supermetrics AI, which reduces some of the manual analysis work by adding AI-driven dashboard creation and insights. However, for client-ready reporting, white-labeling, and presentation workflows, teams will still rely on external visualization tools.
If you’re considering Supermetrics, it’s important to understand what you’re actually signing up for—because it’s not an all-in-one reporting tool like Whatagraph.
Supermetrics is just a “middleman” or a data connector. You can’t actually build charts, create dashboards, or design client-ready reports within Supermetrics itself.
Once it has that data, it needs to hand it off. You must ship your data to a separate data visualization tool—most commonly Looker Studio, Google Sheets, or another BI platform— to do anything meaningful with it.
Here’s what that actually looks like in your day-to-day:
Step 1: Connect your marketing platforms to Supermetrics.
Sounds easy—until you realize some connectors (like TikTok or HubSpot) are paid add-ons, and others randomly break or drop fields with no warning.
Step 2: Ship that data into Looker Studio (or Sheets, Tableau, Power BI, etc.).
If the sync lags or breaks, your Looker charts go blank. And now your client’s “live dashboard” is either outdated or just...not there.
Step 3: Build your report in Looker Studio.
Prepare for another steep learning curve. Nested filters, field mismatches, and slow loading times (like 15–20 seconds per widget) aren’t uncommon.
Step 4: Realize something’s off in the data.
Now you're debugging: Is it Supermetrics' connector? Did Looker misread a field? Or did Facebook change its API again?
Step 5: Contact support (maybe both teams).
You file a ticket with Supermetrics... and maybe another with Google. Hope you get answers before your client check-in.
Step 6: Manually patch the report if needed.
Because you will need to—via Google Sheets workarounds, filters, or re-pulling data. All of which takes time and introduces risk.
Step 7: Repeat across every client, and every campaign.
Multiply the hassle by 5, 10, or 50 clients, and suddenly your “automated” reporting stack isn’t saving you time—it’s burning it.
Don't want to go through all this? Here's how Kim Strickland, Digital Marketing Specialist at Peak Seven broke free.
Real-life success story: How Kim slashed 63 hours per month on reporting by ditching their "Frankenstein" stack
Kim used to wrestle with a complex reporting setup: Funnel.io for data prep, Supermetrics to fill in the inevitable connector gaps, and then the frustrating final battle in Looker Studio to build reports.
She would spend over 40 painstaking hours per report, plagued by broken filters, mismatched fields, and client-facing errors that eroded trust.
Looker Studio was slow and always breaking. The data wouldn’t pull through, or it would pull through incorrectly. It was frustrating, time-consuming, and a constant guessing game.
The Whatagraph fix: After switching to Whatagraph's all-in-one platform, Peak Seven saw a dramatic turnaround:
- 63 hours clawed back every month from reporting.
- An incredible $9,000 in reported savings, per client, each month.
- Effortless creation of custom, drag-and-drop reports and confident sharing of real-time client dashboards.
Read the full case study.
With Looker Studio, everything was muddled. But Whatagraph has opened up transparency and communication. Whatagraph is now our Bible—both for clients and internal teams.
Here’s Kim, in her own words:
Supermetrics Deep Dive #1: Data Pulling and Connectors
Let’s start at the core: Supermetrics exists to move your marketing data from Point A to Point B. That’s it. No charts, no dashboards, no visual flair—just the plumbing.
So how good is it at that job?
How many out-of-the-box integrations are there?
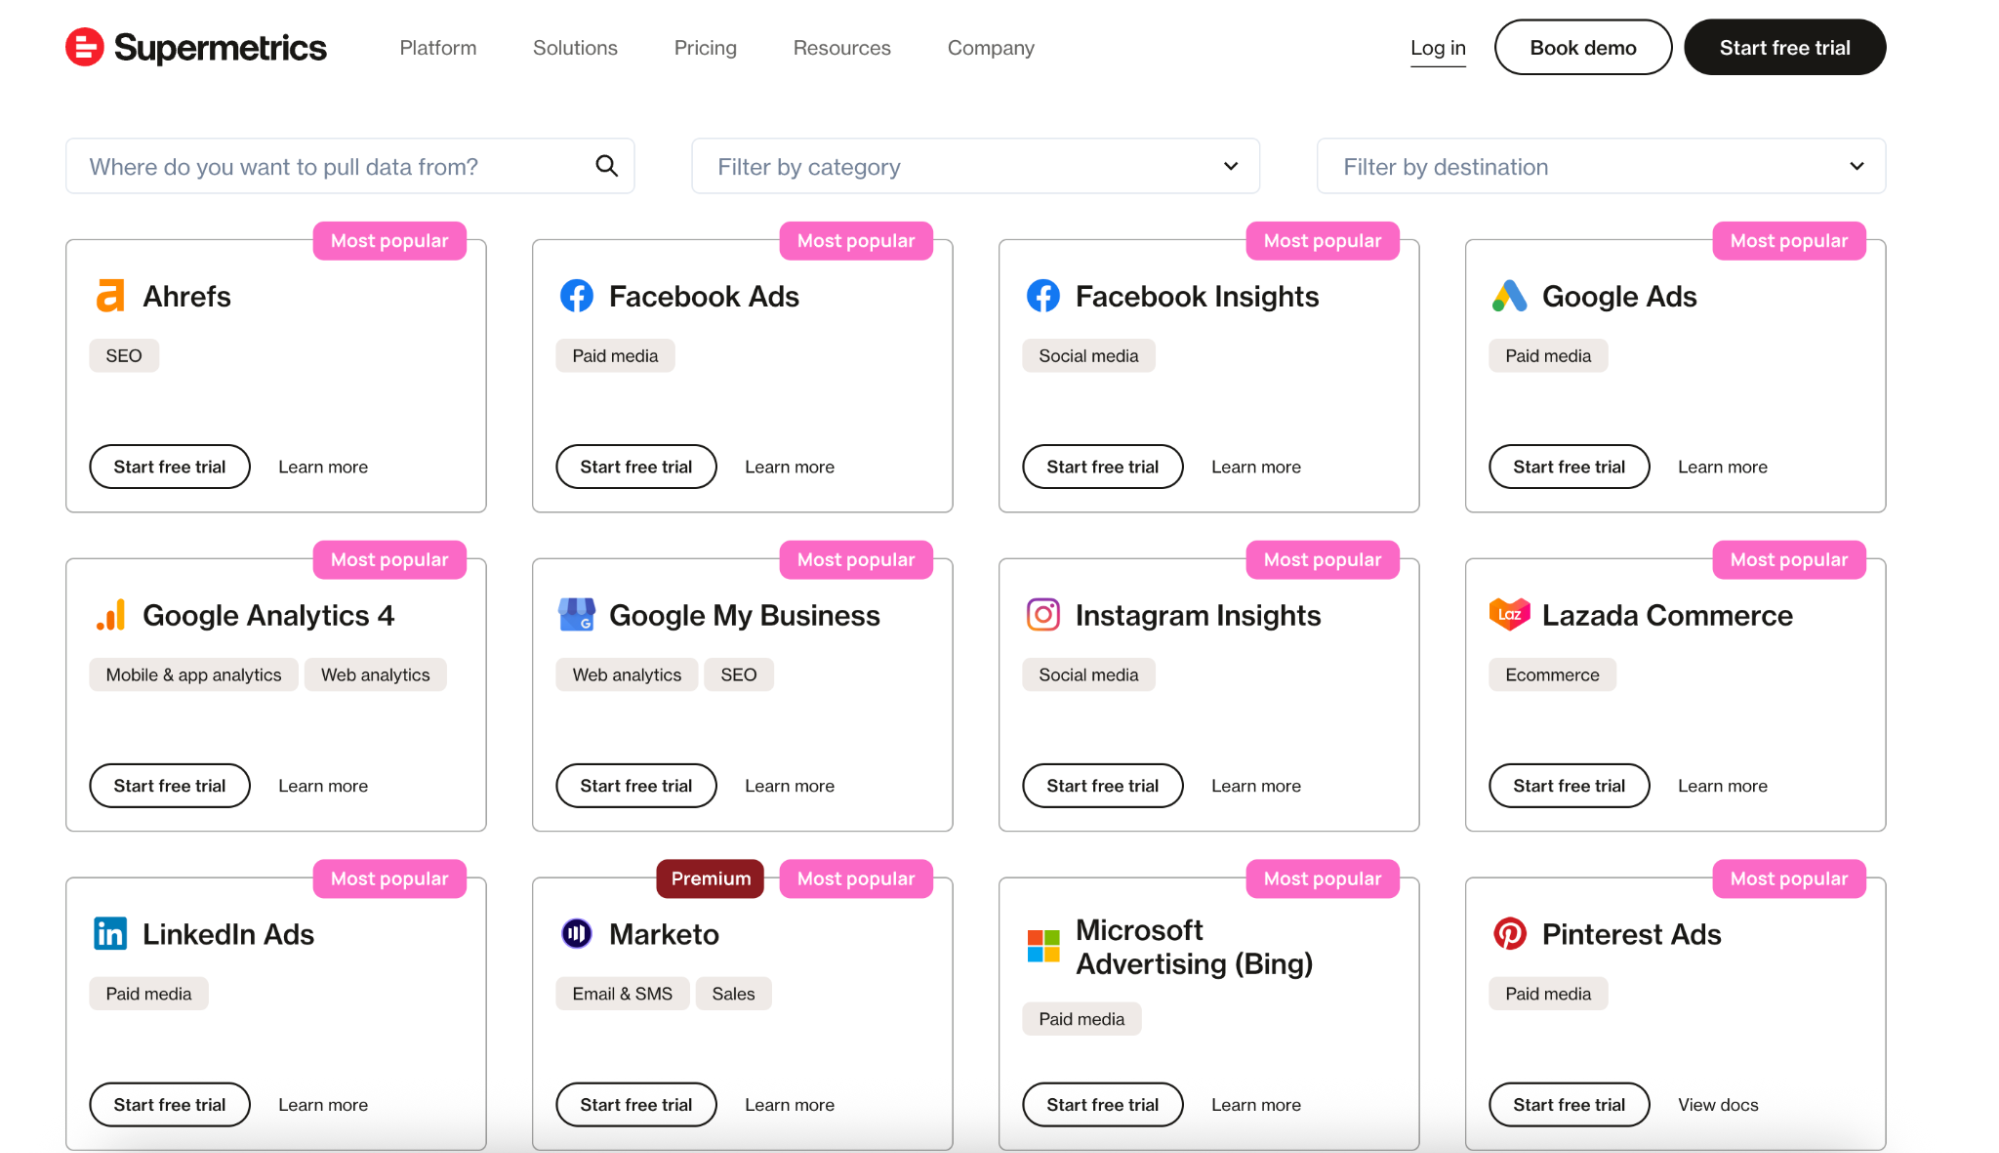
Supermetrics connects to 138 platforms out of the box—everything from Meta Ads, Google Analytics, and HubSpot to lesser-known tools like Criteo or Outbrain.
If it’s a marketing platform with an API, chances are Supermetrics has a connector for it (or at least plans to charge extra for one soon).
That sounds impressive—and it is. Agencies juggling a dozen paid media platforms will find this breadth helpful.
They also have the option for you to upload your custom data, which I think is pretty neat if you’re already sitting on scattered points.
But here's the small print: while the number is impressive, not all connectors are created equal or included by default.
- Tiered access: Some "premium" or newer connectors are only available on higher-priced plans.
- Paid add-ons: You might find specific connectors you assumed were standard actually require an additional fee on top of your subscription. Always verify which specific connectors your chosen plan actually includes.
How reliable are these connections day-to-day?
This is where things get messy.
Supermetrics connections break. A lot.
These breakages happen in the “connecting” stages – a.k.a. When you’re sending the data from a source platform (e.g. Google Ads) to Supermetrics, and then to Looker Studio or whichever BI tool you’re using.
When these connections break, the data on your visualization tool—and reports—become inaccurate.
If you don’t catch this in time before sending reports off to your clients, you risk breaching the trust you’ve built with them. And you might end up answering tricky questions from clients rather than proving your value.
And when these connectors break, you’ll either need to:
- Manually reconnect them yourself
- Or contact Customer Support and wait
One of our customers at Whatagraph—Tanja Keglić, Performance Marketing Manager at Achtzehn Grad agency—knew this pain all too well.
Tanja used to use Supermetrics and Looker Studio, but the connections frequently broke, sources failed to load properly, and she had to either waste time fixing them herself or contact Support for help. She told us:
It’s such a pain to reconnect a lot of sources and accounts on Supermetrics—and it takes so much time, which you don’t have when you want a quick report.
If you’re using an “automated” platform, you shouldn’t have to be wasting time manually fixing the connections or sitting around for Support.
This is what Whatagraph was built for.
From connecting to your data sources, to cleaning it up, to visualizing and sharing it, Whatagraph takes care of your entire data journey. This means:
- There are less chances of data inconsistencies, connection issues, or breakages.
- Your data is safe, secure, and organized on one platform.
- You don’t need to jump from one platform to another.
- You don’t need to learn how to use new tools.
Plus, the integrations we provide at Whatagraph are fully-managed. This means they’re more seamless, stable, and reliable.
And our Product engineers regularly maintain these integrations so you don’t have to.
Fully-managed integrations also mean if there are bugs, we can resolve them quickly without having a third-party company involved.
When Tanja switched to Whatagraph, the biggest win she saw was stability. She raved:
We don’t have any connection issues on Whatagraph at all. We just connected the platforms once, and that was it.
Read the full case study.
Where can Supermetrics send your data?
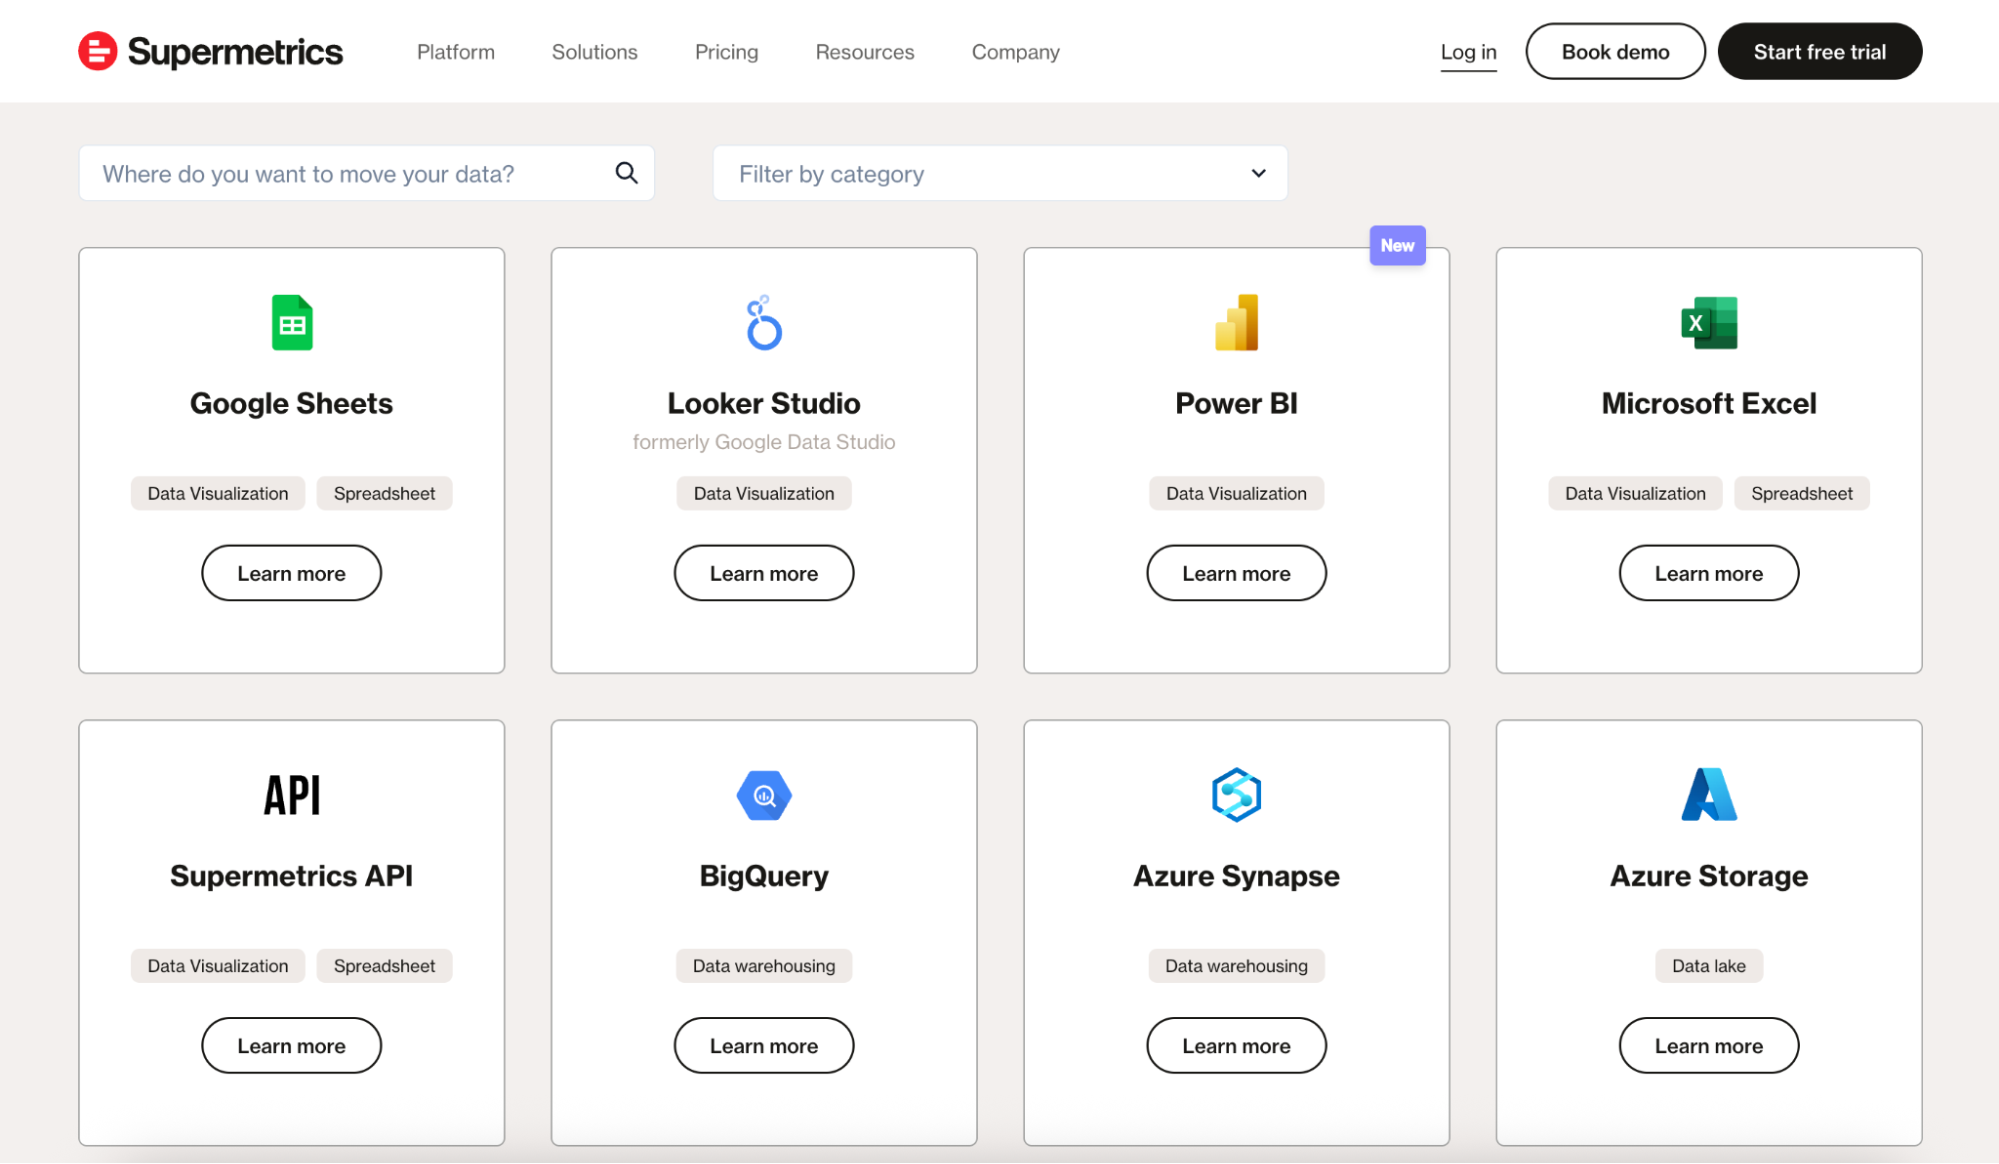
Supermetrics is designed to be a data pipe, and it can send your data to a variety of popular “destinations”:
- Spreadsheets: Google Sheets, Microsoft Excel (classic choices for many marketers).
- BI and visualization tools: Looker Studio (very common), Tableau, Power BI, Qlik, etc.
- Data warehouses: Google BigQuery, Amazon Redshift, Snowflake, Azure Synapse (for more advanced data storage and analysis).
Basically, Supermetrics fetches the data and drops it off.
Because Supermetrics only delivers the data, it doesn't help you see it, chart it, or present it.
You are fundamentally tied to using a second platform (your chosen spreadsheet, BI tool, or data warehouse) for any actual reporting, visualization, or in-depth analysis.
How does data freshness compare to direct platform access?
If you need truly real-time data, Supermetrics (like most third-party connectors) will have some limitations.
Yes, Supermetrics offers scheduled refreshes—but there are some significant strings attached, straight from their own documentation.
- Supermetrics themselves state they have a hard limit of 5 scheduled refreshes per file (like a single Google Sheet) to "maintain their reliability." If you need more, you should break your data into separate files.
- They also advise keeping your total scheduled refreshes per account below 50, warning that having 100 or more can cause refreshes to simply fail.
- Here’s a big one—Supermetrics points out a Google Apps Script limitation that means their refresh system can only run for about 6 minutes per account, per hour. If your scheduled refreshes for that hour take longer than 6 minutes to complete (and for agencies pulling lots of data, they often do), Supermetrics says the refresh “will get pushed out.”
This might fly for a once-a-month big-picture report.
But for daily agency operations—quick client answers, timely campaign optimizations, or dashboards that need to be genuinely live—these refresh limitations are a constant headache.
They breed stale data, create client-facing inaccuracies, and add unnecessary stress to your workflow.
The Whatagraph advantage: You get a consistent 30-minute refresh rate across every data source, blend, and platform—automatically. That means faster answers, fresher insights, and no more awkward “let me just double-check that number” in front of a client. And most importantly—never having to question the accuracy of your data-driven reports.
Supermetrics connects to 130+ marketing platforms and can send your data to spreadsheets, BI tools, or warehouses—but it’s just a pipe. No charts, no dashboards, and often, no real-time reliability. Plus, connections break often.
Supermetrics Deep Dive #2: UX and Usability
What's it really like working with and within Supermetrics day-to-day?
Let's look at its interface, how it actually plays with your other essential tools, and the real effort it takes to get your team up to speed.
Is the interface intuitive and modern?
At a glance, Supermetrics presents itself as clean and professional. But once you’re inside the tool, things start to feel...clunky.
The interface feels dated and click-heavy.
 Supermetrics' pages lack clear visual prioritization.
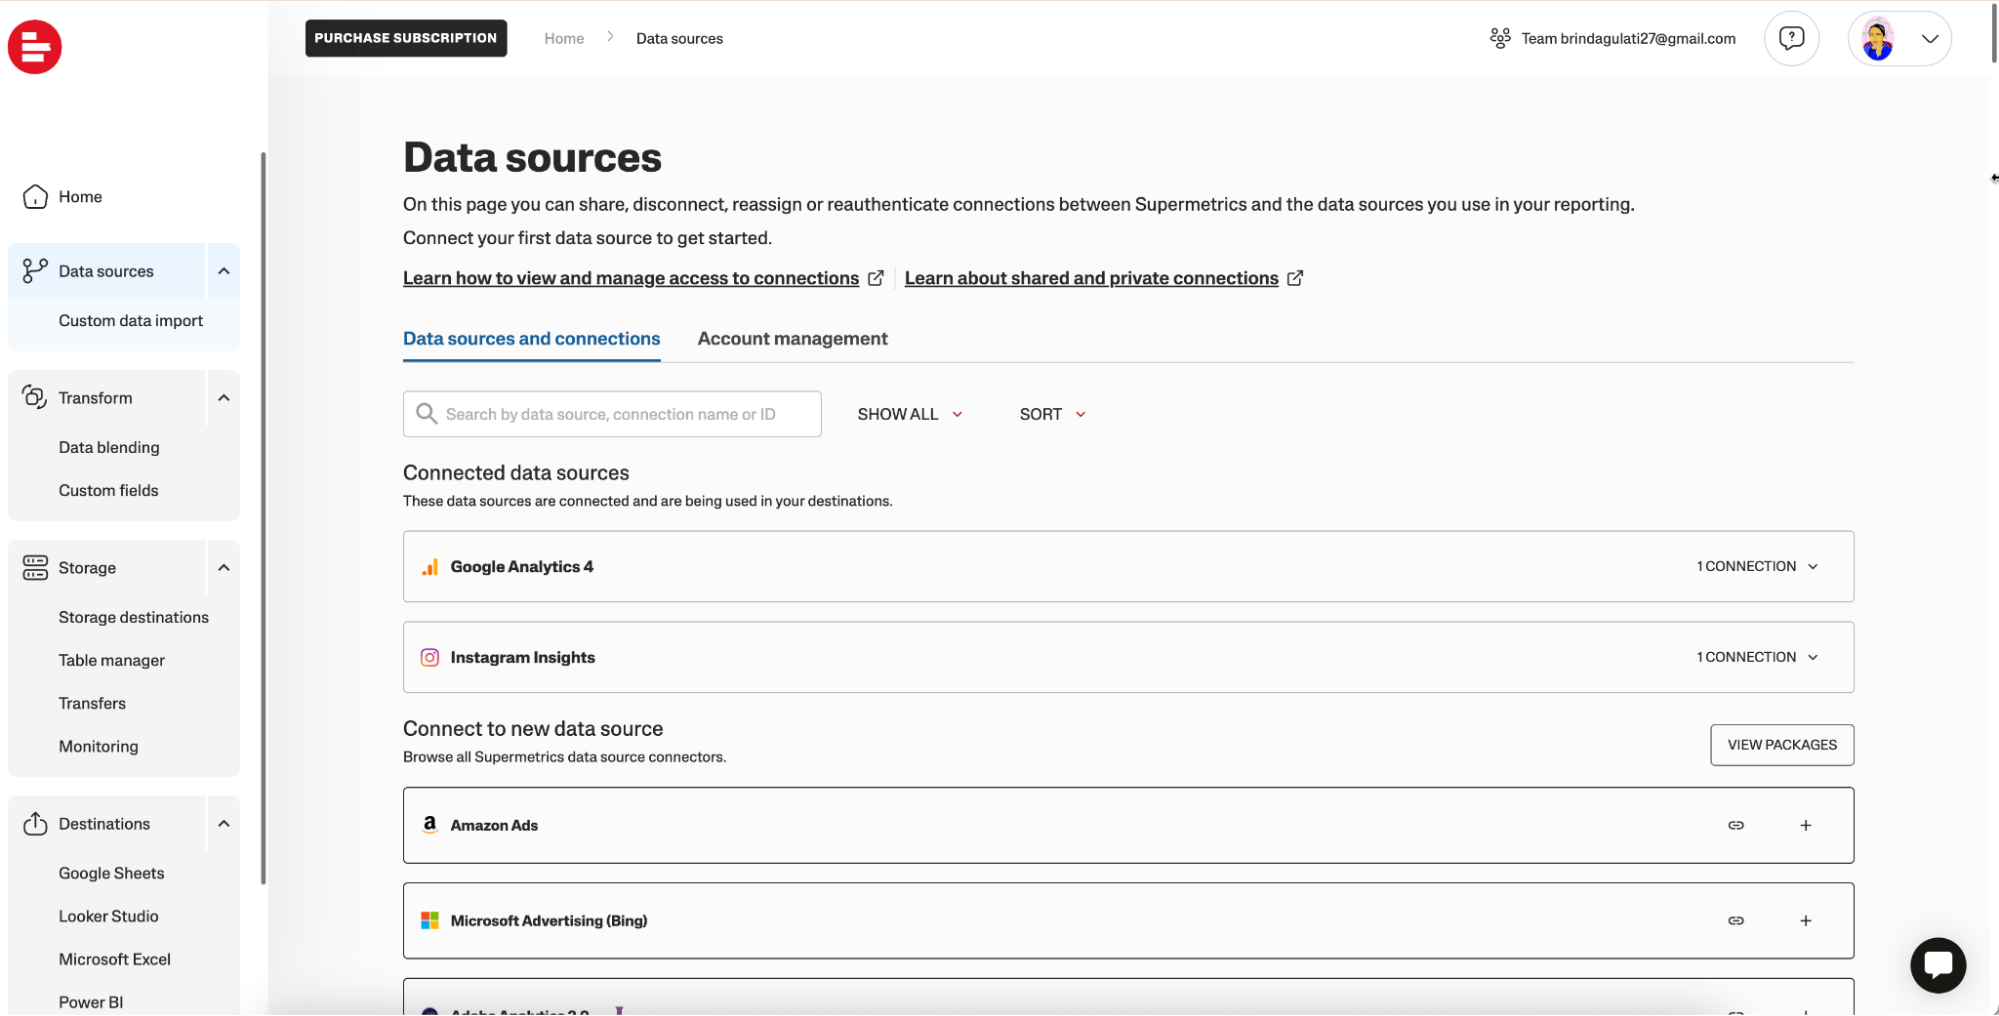
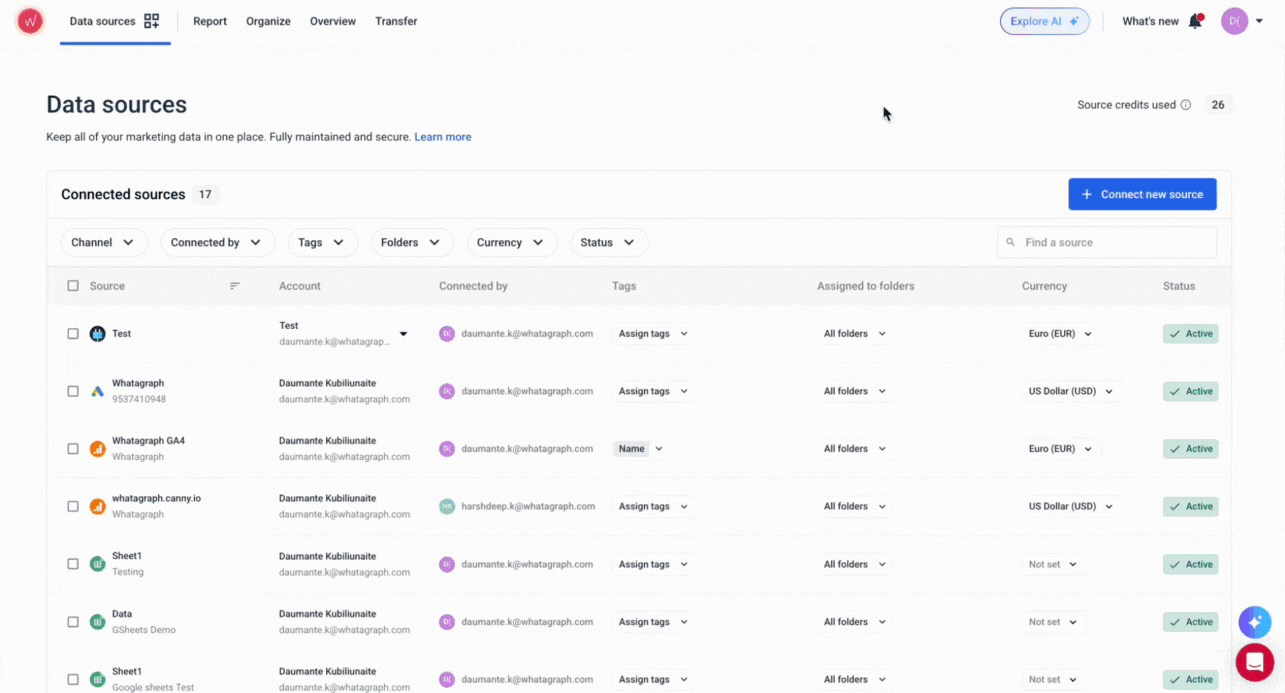
On the “Data Sources” screen, for example, connected sources aren’t highlighted in a way that makes them easy to scan or manage.
It’s hard to tell what’s active, what needs attention, and what’s optional. Important controls—like re-authentication or source editing—are tucked into tiny dropdowns or buttons with little explanation.
The left-hand menu is dense. Each section—Data sources, Transform, Storage, Destinations—is packed with submenus, most of which open into new full-page views instead of drawers or modals.
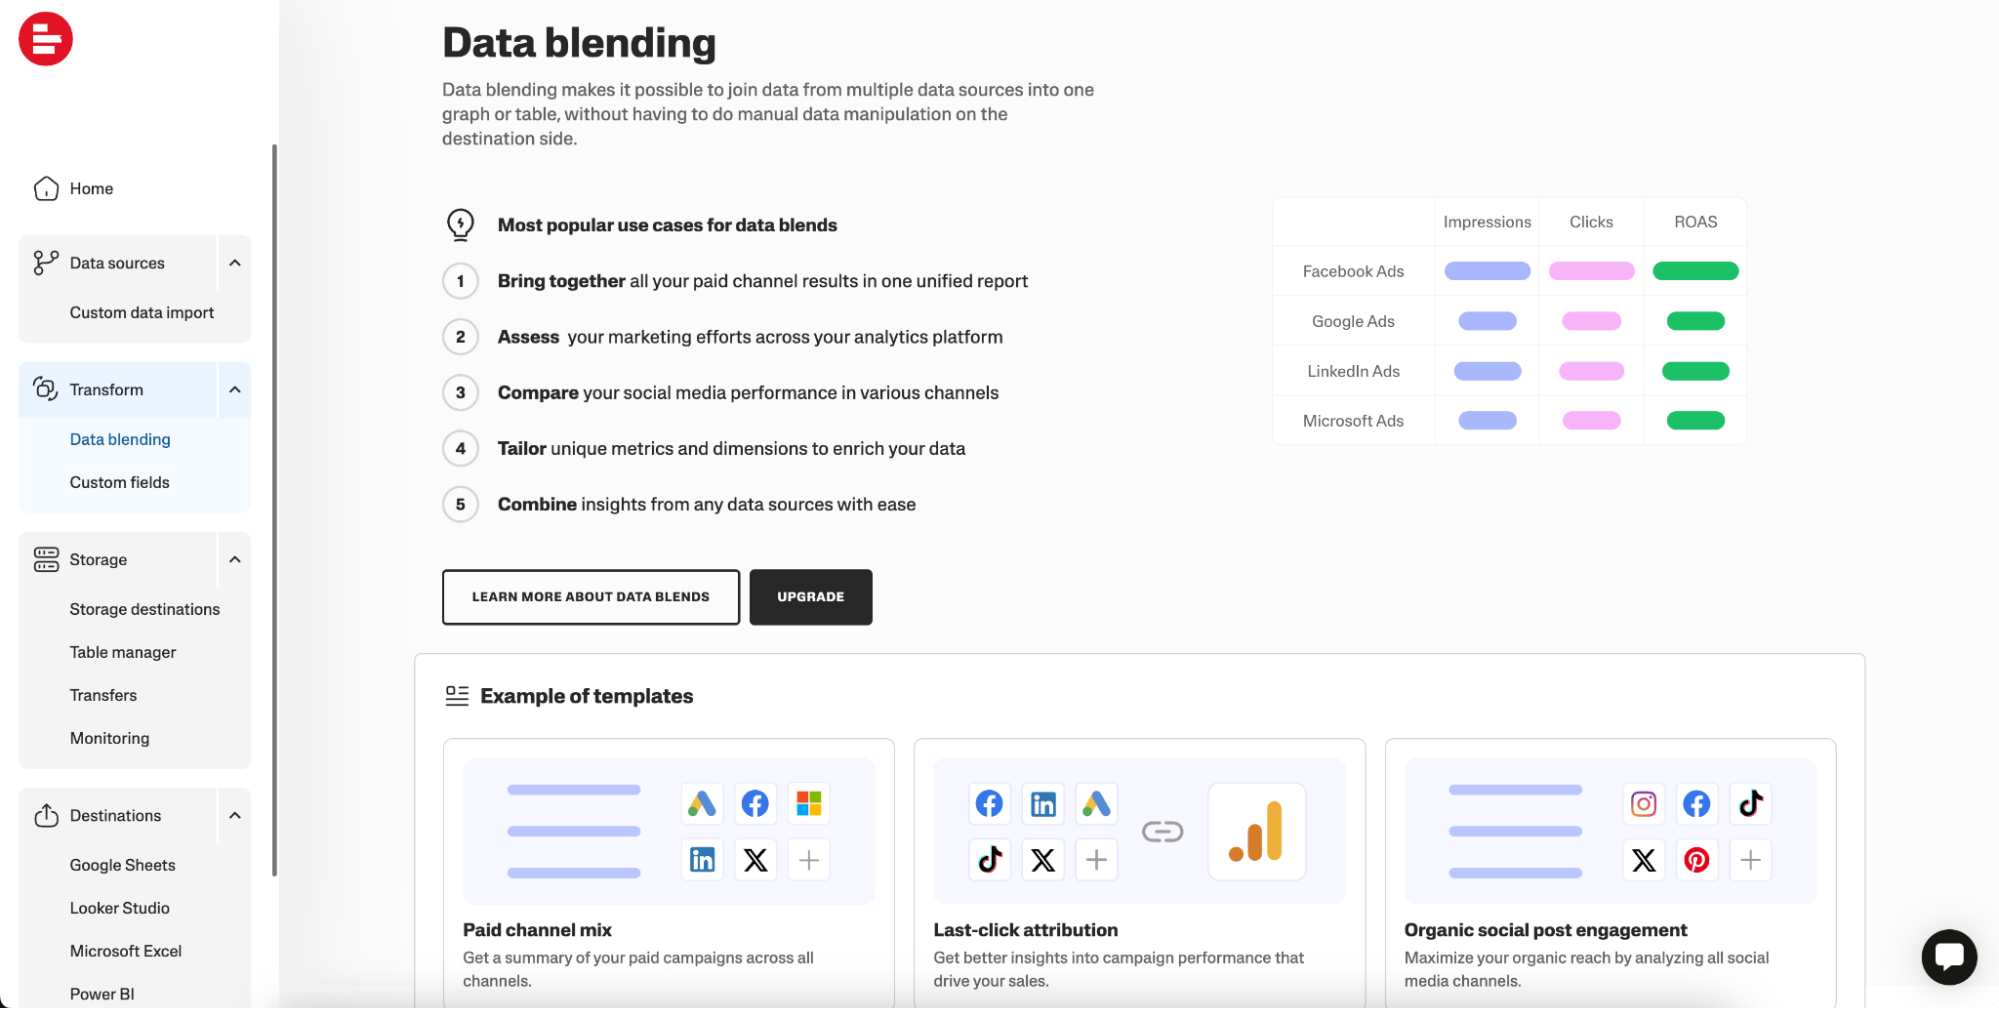
Take the “Data Blending” page, for instance. It shows you impressive use cases—but almost no actual in-platform guidance on how to execute them unless you upgrade. You’re shown what’s possible, not how to actually do it.
Now compare that to Whatagraph.
From the moment you land on the “Data Sources” screen, things just make sense. You get a clean, filterable table. It’s visually organized, you can assign tags, view status at a glance, and connect new sources without five extra clicks.
Even currency management is baked into the same view. It feels modern—and fast.
 Plus, you don’t need to switch tabs or export anything elsewhere. You can pull, organize, and visualize your data in the same marketing analytics platform.
That means fewer tabs, fewer tools, and fewer things to break.
How long does onboarding actually take for different skill levels?
If you’re technical—or already used to Looker Studio or complex spreadsheets—you’ll likely get the hang of it within a few days.
But for account managers or junior marketers, the ramp-up curve is steeper.
Even users who praise it as a “great tool” run into speed bumps with Supermetrics’ set up:
The initial configuration can be confusing, especially for first-time users. Some connectors require extra steps that aren’t always intuitive.
If you’re deploying across a team, expect to spend time training users on connector setup, troubleshooting sync errors, and managing access (especially since Supermetrics accounts are tied to individual Google logins).
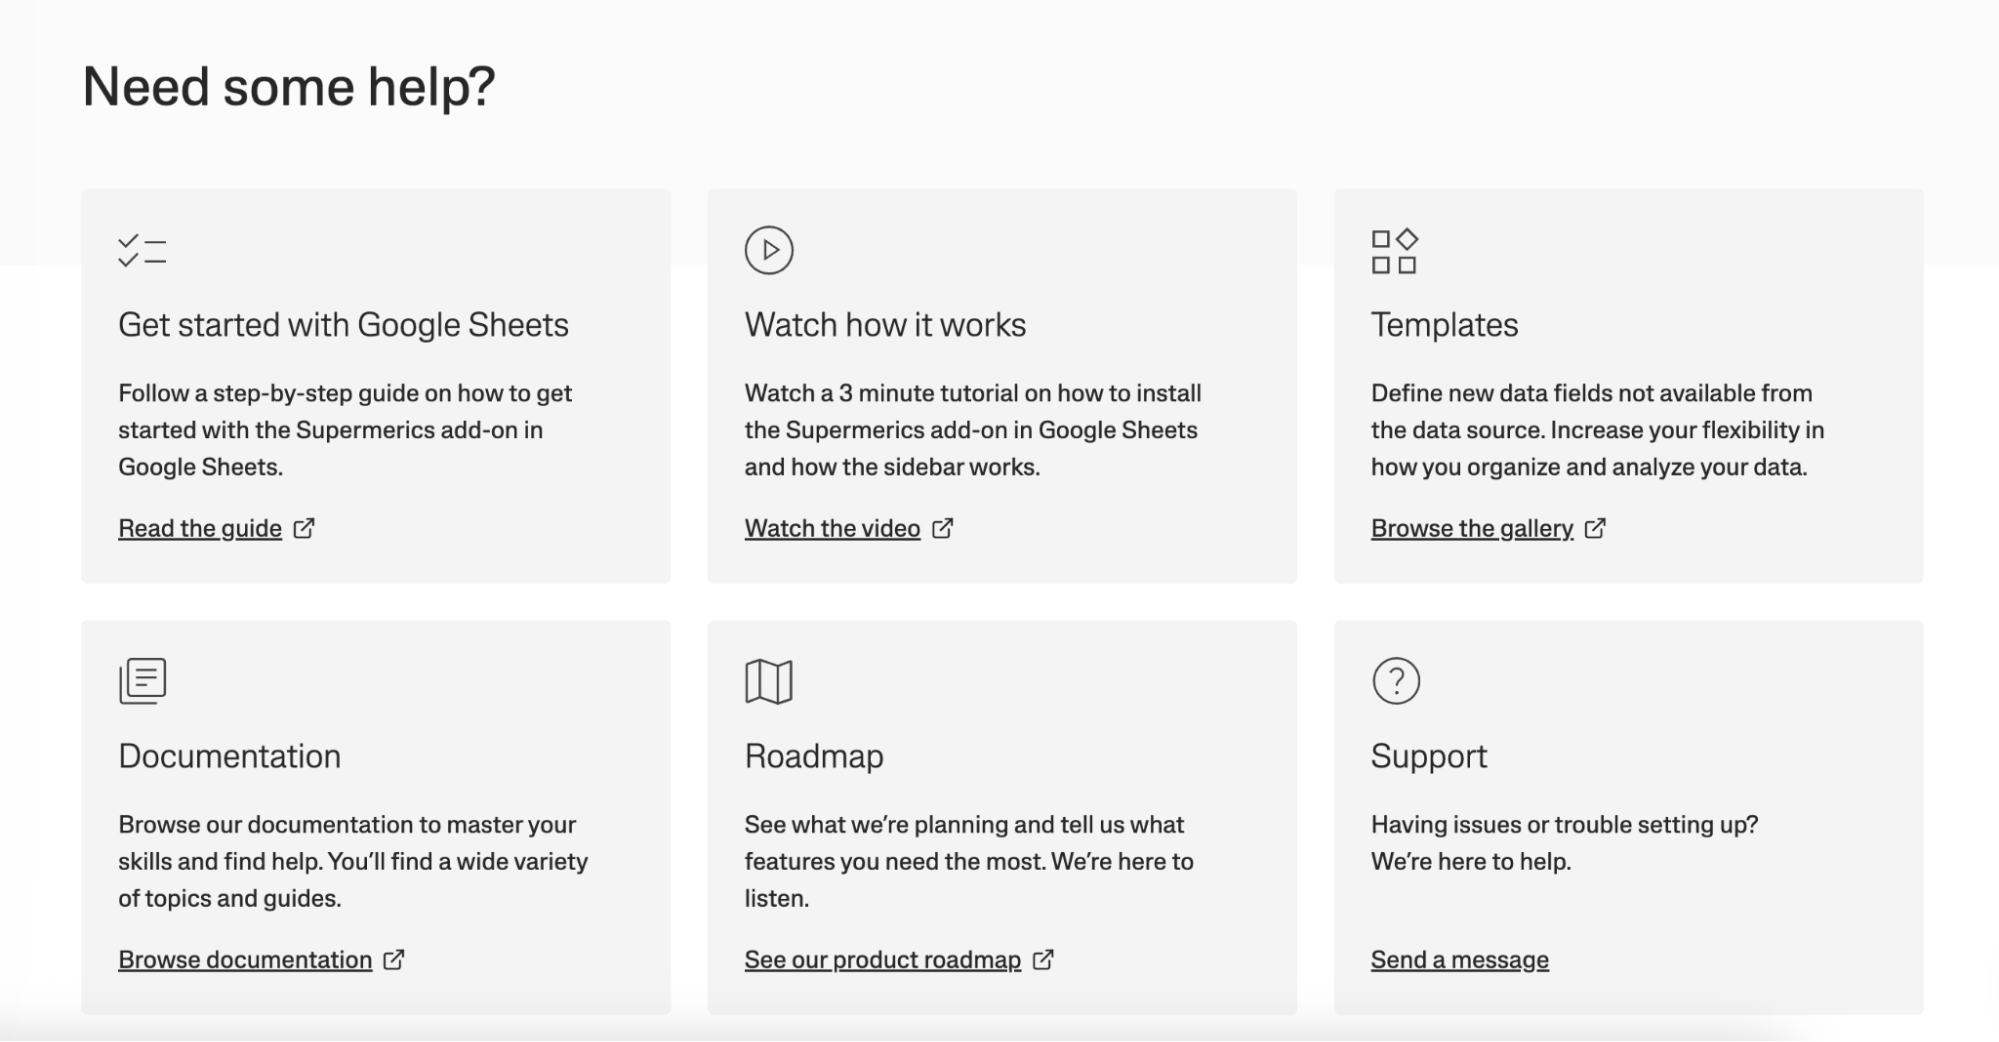
I do, however, appreciate that Supermetrics has abundant in-app guidance tutorials on every page:
 But honestly, as a marketer myself, I’d much prefer a plug-and-play platform that can help me whip up a report in minutes after connecting my data sources—without having to comb through onboarding materials.
Whatagraph is built for simplicity, and it’s why verified users like Marcio D. call us the “Tesla or Mercedes of digital analytics tools”:
The simplicity to use it, its visually appealing graphics, and comprehensive user experience make it a one-stop solution for consolidating metrics across all of my marketing channels.
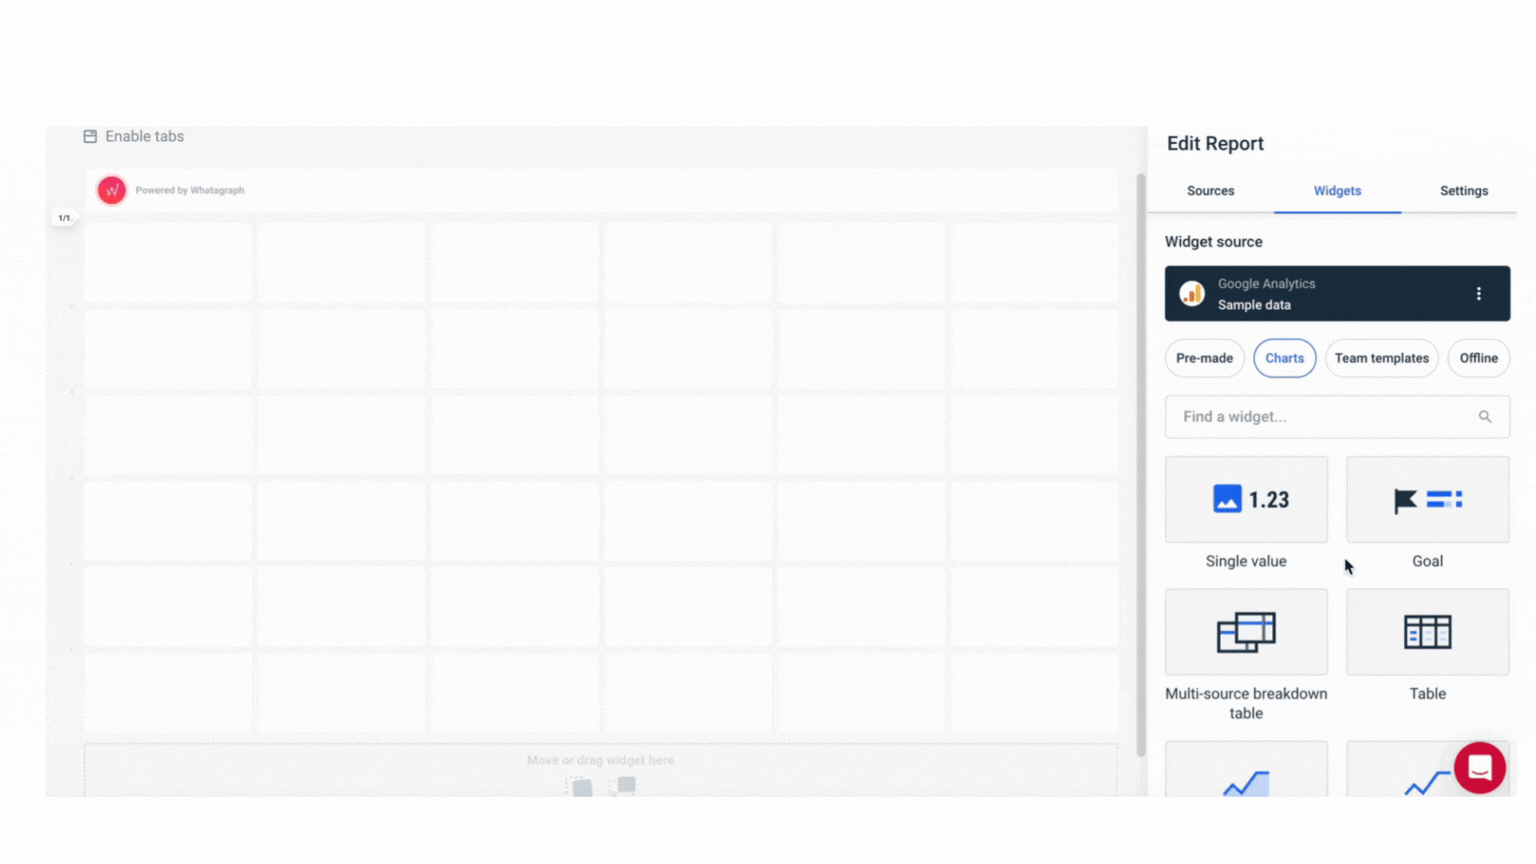
Take a look at how easy it is to build your first report with Whatagraph:
How does Supermetrics play with Looker Studio?
Supermetrics promises to get all your diverse marketing data into Looker Studio so you can build those dashboards. But "getting it there" and "playing nicely together" are two different things.
If we’re talking about usability, Supermetrics’ job is only half the battle won. The next tab I have to open and monitor is Looker Studio.
That means:
- More configuration.
- More permissions.
- More “wait—why does this widget look off again?”
I used a Supermetrics template and pulled data from my Instagram Business account.
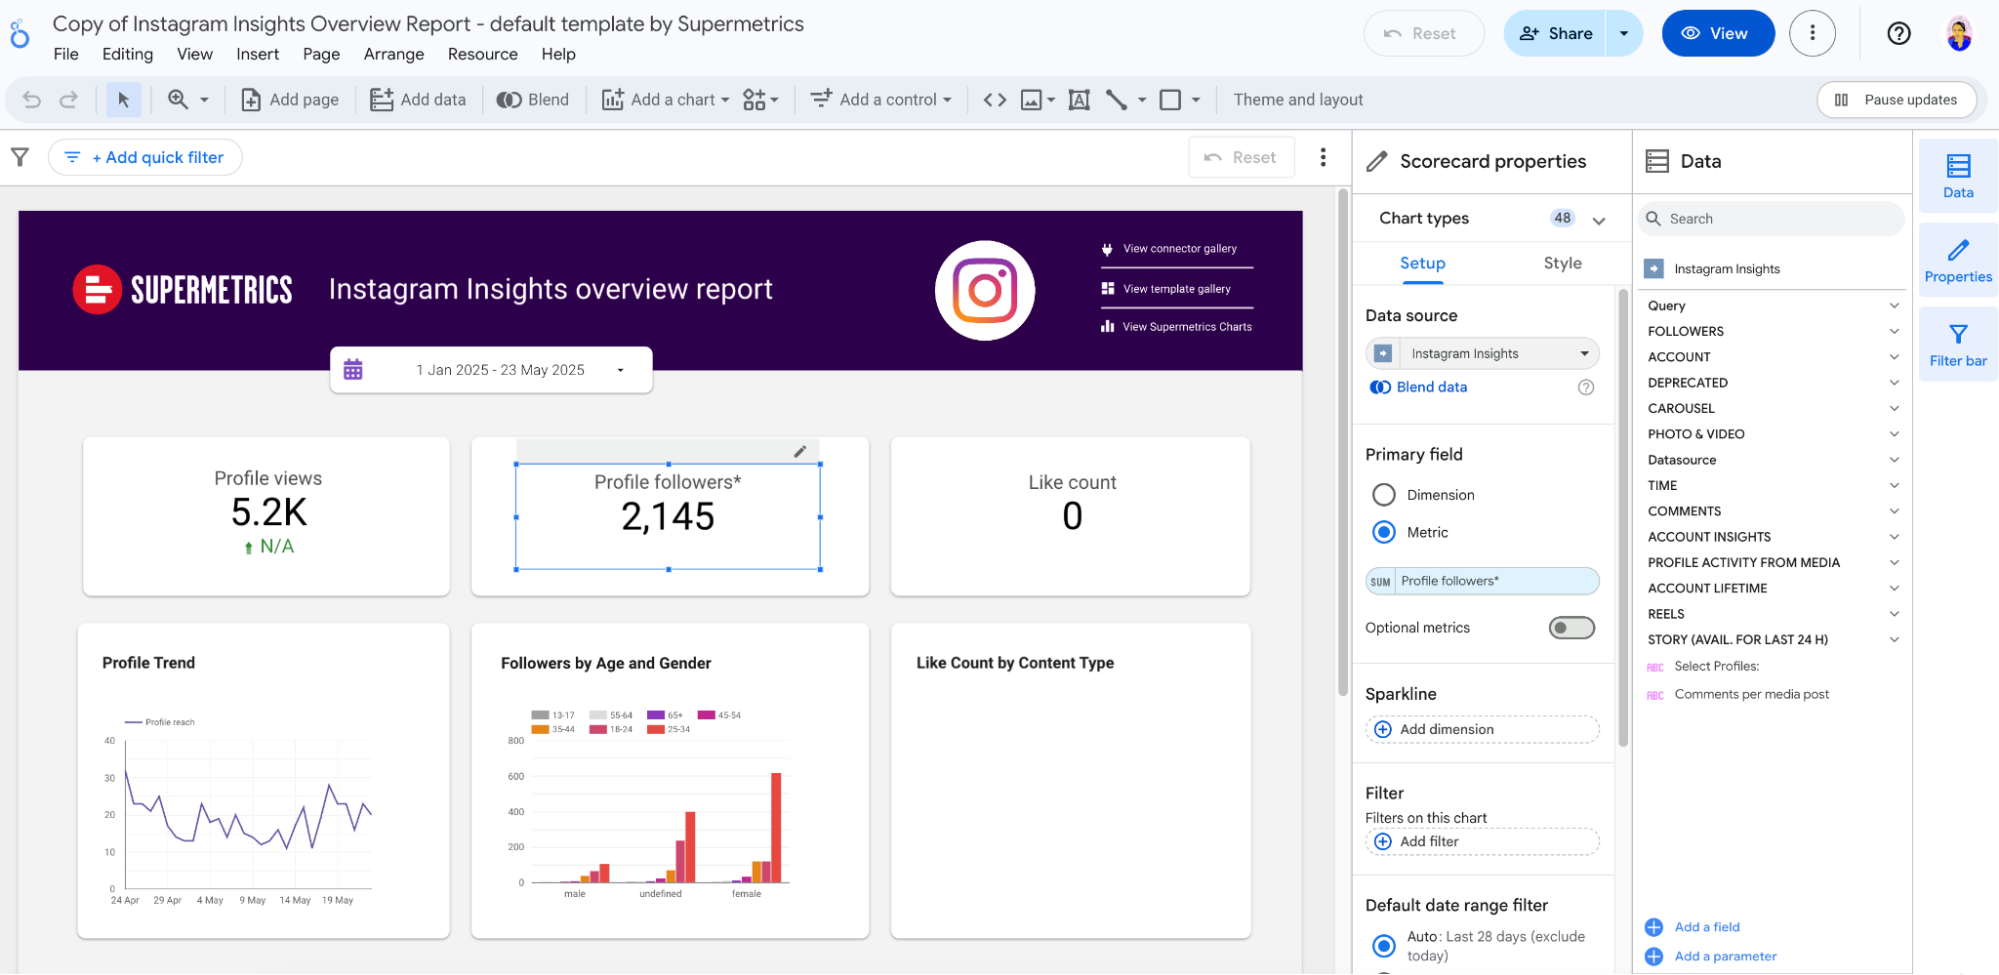 Looker Studio is not a bad tool. But it wasn’t built for speed, visual polish, or cross-functional collaboration. It was built to be flexible and free—and it shows. You’ll spend more time tweaking chart properties and wrestling with layout logic than actually delivering insights.
Next, I tested another template by connecting my GA4 data.
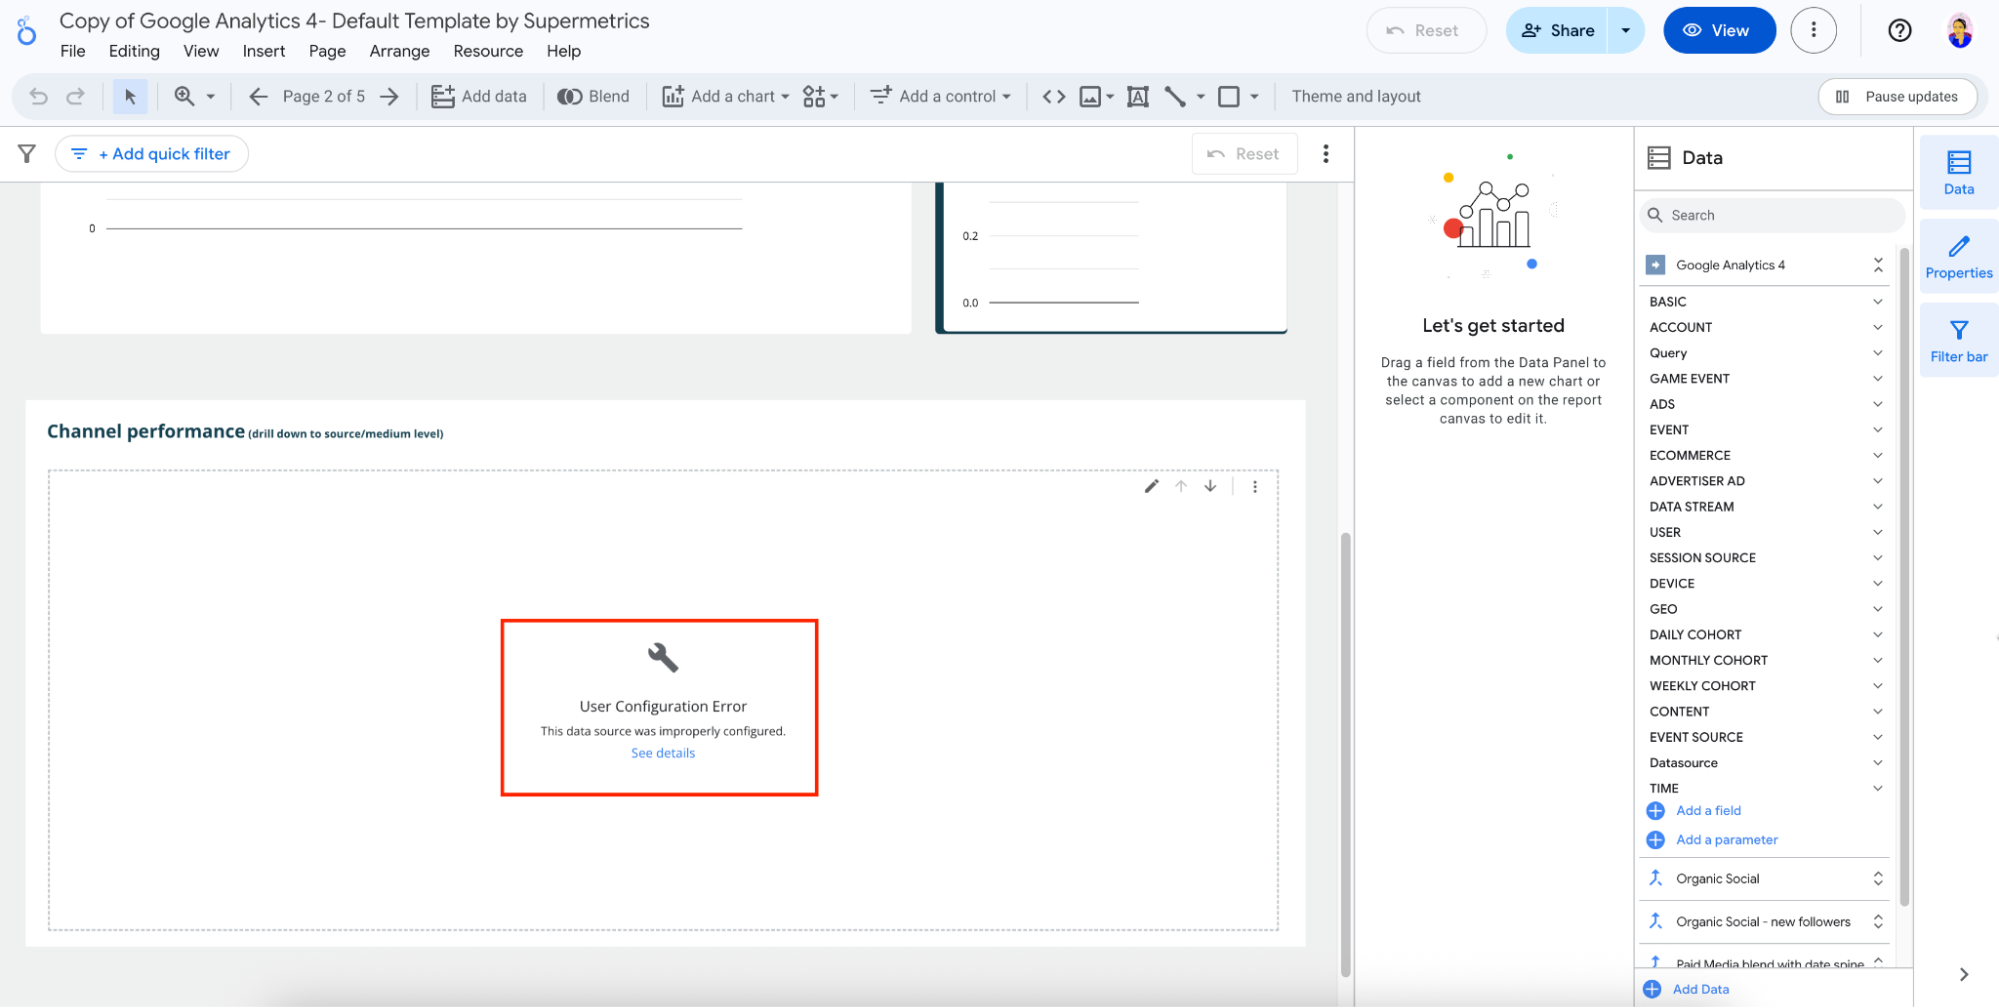
The same method. The same two tools. The same process.
But now this shows me a “User Configuration Error”—so my next step is to tell both support teams—Supermetrics and Google—and figure out where the problem is.
This is the reality of the two-tool workflow: you don’t just use the tools, you manage the relationship between them.
And that’s where user experience starts to unravel. Instead of delivering insights, you’re left wondering: can I really trust this report?
You're constantly switching tabs, copying IDs, toggling data source settings, re-checking filters, adjusting dimensions—just to get your dashboard to look normal, let alone insightful.
It’s not that Supermetrics or Looker Studio are broken. It’s that the burden of making them work together falls squarely on you. There’s no seamless UX handoff. No shared memory between tools.
No “Oh, this just works.”
If you’re a solo marketer, that’s a drain on time and mental energy.
If you’re on an agency team, it slows delivery and spreads technical ownership thin across people who didn’t sign up to be data engineers.
Supermetrics is powerful, but not plug-and-play. It’s built for users with some technical background and assumes familiarity with the visualization tool you're connecting to.
Supermetrics Deep Dive #3: Visualization and Reporting
Now that your data is flowing—what can you actually do with it? Let’s talk about what happens after the data lands.
2026 UPDATE: Supermetrics Introduces Supermetrics AI
In early 2026, Supermetrics introduced Supermetrics AI: a suite of AI capabilities embedded across its platform.
This is a meaningful evolution.
Instead of being just a data pipeline, Supermetrics now includes built-in AI Agents designed to automate parts of the reporting and analysis workflow.
Here’s what that looks like in practice:
- Dashboard Agent → Lets you query marketing data in natural language and generate dashboards or refine reports on the fly.
- Insights Agent → Analyzes performance trends, explains changes (like sudden drops in leads), and recommends next steps.
- Connector Agent → Guides users through building new integrations in a low-code environment.
On top of that, Supermetrics has expanded its APIs and launched an MCP Server, allowing teams to connect their marketing data securely to tools like ChatGPT, Google Gemini, and workflow automation platforms
In other words: Supermetrics is layering AI on top of its data foundation.
That’s important.
But here’s the nuance.
Supermetrics AI enhances how you analyze and explore data, it doesn’t fundamentally change the platform’s role.
You’re still working within a connector-first architecture.
For many teams, that means:
- Data still needs to be visualized in dashboards
- Client-facing reports still need formatting and branding
- Reporting workflows may still involve external BI tools
Supermetrics AI reduces manual analysis, yes.
It helps answer the “why” faster.
It speeds up dashboard creation.
But it doesn’t eliminate the need for a broader reporting workflow if you’re running a multi-client agency setup.
And now, how does Supermetrics AI compare to Whatagraph 3.0? Here’s how:
| Capability | Supermetrics AI | Whatagraph 3.0 |
| Natural-language dashboard creation | ✅ Dashboard Agent | ✅ Whatagraph IQ |
| Automated performance insights | ✅ Insights Agent | ✅ Built-in Insights space |
| Low-code connector building | ✅ Connector Agent | Native connectors (55+) |
| AI summaries inside reports | Partial (insight explanations) | ✅ Directly embedded summaries inside your report, based on your data |
| Full white-label + branded reports | ❌ Not native | ✅ Built-in |
| Reporting automation | Requires external tools | Fully integrated |
In short, Supermetrics AI helps you analyze data faster. Whatagraph 3.0 helps you analyze and present data faster.
Here are three key differences:
1️⃣ Architecture: Add-On AI vs AI-Native Platform
Supermetrics AI:
- Adds AI Agents (Dashboard, Insights, Connector)
- Enhances querying and analysis
- Exposes data to external AI tools (ChatGPT, Gemini) via APIs
But the underlying structure remains connector-first.
You still move data into destinations. You may still rely on external visualization tools.
Whatagraph 3.0:
- Connects, cleans, visualizes, and analyzes data in one system
- AI is embedded across the entire workflow (Whatagraph IQ)
- Reporting, branding, insights, and sharing happen in one place
It’s not AI on top of a stack. It replaces the stack.
2️⃣ Workflow Philosophy
Supermetrics AI: “We’ll make your data smarter.”
Whatagraph 3.0: “We’ll remove the technical work entirely.”
Supermetrics still expects teams to understand:
- Destinations
- Data flows
- Architecture
- External dashboards
Whatagraph is explicitly built for marketers who aren’t data scientists, and who don’t have technical experience or don’t have the time to learn.
3️⃣ External AI Integrations vs Built-In Intelligence
Supermetrics emphasizes:
- MCP Server
- Enterprise APIs
- Integration with tools like ChatGPT and Gemini
That’s powerful, especially for technical teams, but can be too technical for marketers.
Whatagraph emphasizes:
- AI that stays inside the platform
- Insights grounded directly in source data
- No need to upload data to external AI tool
That’s simpler, especially for marketers who just want to focus on doing what they do best.
Can you customize and white-label reports without jumping to another tool?
If you want branded, client-ready reports, you’re immediately in "tool two" territory—usually Looker Studio, but it could also be Tableau, Power BI, or a spreadsheet. And those tools come with their own learning curves, quirks, and pricing models.
Need to add your logo? Change fonts? Match a client’s brand colors? That’s on you—and on the capabilities of the second tool, not Supermetrics.
So technically, yes—you can customize and white-label. But not within Supermetrics. And definitely not without extra effort.
The Whatagraph advantage: Whatagraph bakes white-label customization into the reporting workflow itself—without the “two-tool” duct tape.
Whatagraph makes it your show:
- Total white-labeling: Your logo, your agency colors, your style. Period. Consistent branding is easy with global and report-level settings.
- Your custom domain: Deliver reports from reports.youragency.com—not ours. Even email notifications carry your brand
How easy is it to create client-ready, branded reports with the Supermetrics approach?
Supermetrics itself does not create, design, or brand your reports.
So, when we talk about the "Supermetrics approach" to creating client-ready, branded reports, what we're really discussing is a multi-step, two-tool process:
- You use Supermetrics to query and pull data into your chosen destination – typically Looker Studio, Google Sheets, Excel, or a more advanced BI platform like Tableau or Power BI.
- You then switch entirely to that second tool to:
- Build your charts, tables, and all visual elements.
- Apply any branding (logos, colors, fonts).
- Structure the layout to be "client-ready."
- Share it with your client.
How "easy" is this approach?
The honest answer is that it depends entirely on the second tool you choose and your team's proficiency with it, but it’s rarely "easy" in the way an integrated solution like Whatagraph is.
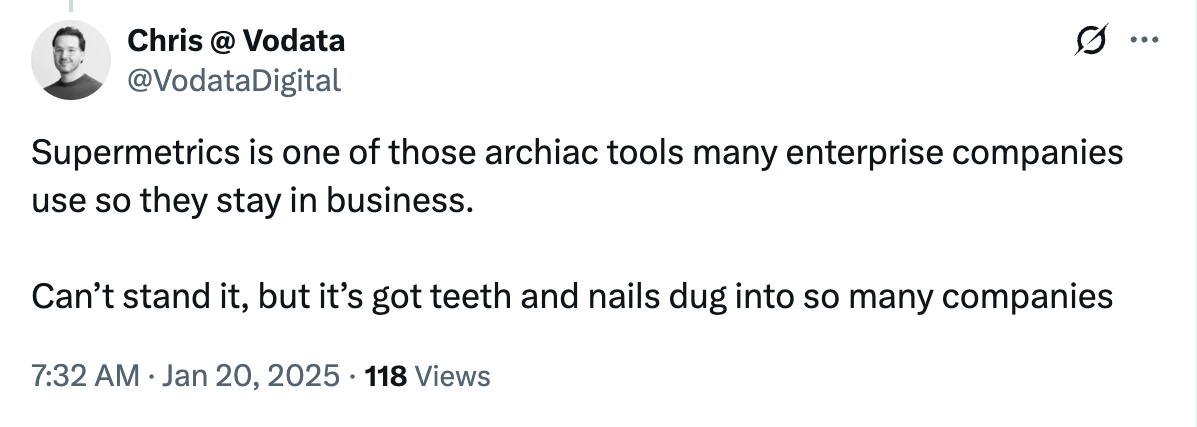
So why do companies still use and choose Supermetrics?
According to business owner Chris on X, “Supermetrics is one of those archiac tools many enterprise companies use so they stay in business…Can’t stand it, but it’s got teeth and nails dug into so many companies.”
If you’re looking for other choices, check out this guide to Supermetrics alternatives in 2026.
Creating a polished, client-ready report with Supermetrics takes real work—and it’s split across two tools. You’ll get there eventually, but not without some duct tape and a lot of tweaking.
Supermetrics Deep Dive #4: Daily Workflows and Customer Support
We’ve touched on this earlier—but it’s worth digging into because this is the part that makes or breaks your day.
Can you do end-to-end marketing analysis in a unified workspace within Supermetrics?
Let's be blunt: no, you absolutely cannot.
There’s no "Supermetrics workspace" where you pull data, analyze it with built-in tools, create visualizations, build dashboards, and then share client-ready reports. That entire analysis-to-presentation workflow happens outside of Supermetrics, in those other tools.
Supermetrics sits between you and your marketing platforms. If anything upstream changes—Facebook tweaks permissions, Google resets a token—your connector drops out.
And so does your data.
And your report.
And your client's trust.
This means your daily workflow is inherently fractured. You’re in Supermetrics (or its sidebars) to manage data pulls and connections.
Then you’re in Looker Studio, Google Sheets, or Power BI for everything else—data blending (beyond what Supermetrics offers), visualization, dashboard design, insight generation, and report sharing.
Another daily annoyance: I can’t actually see any of my reports inside Supermetrics. There’s no dashboard, no summary, no “here’s what you’ve built.”
 I have to hop over to Looker Studio every time—because Supermetrics doesn’t track or display your reporting output at all.
Who do you call when something breaks?
This is where the "two-tool workflow" really throws a wrench in the works.
If a Supermetrics connector is clearly broken, or a query in their sidebar is throwing an error, then yes, Supermetrics support is your first port of call.
But often, the problem is murky. Is your Looker Studio chart blank because:
- Supermetrics failed to pull the data?
- Supermetrics pulled it, but it didn't transfer correctly to Looker Studio?
- The data source platform (e.g., Facebook's API) had an outage?
- Your Looker Studio chart configuration is wrong? You can spend a lot of time just figuring out which vendor's problem it actually is.
For example, when I asked the support team why my GA4 data won’t load in the reports, they pointed out that it was a Google problem—and directed me to Google’s documentation.
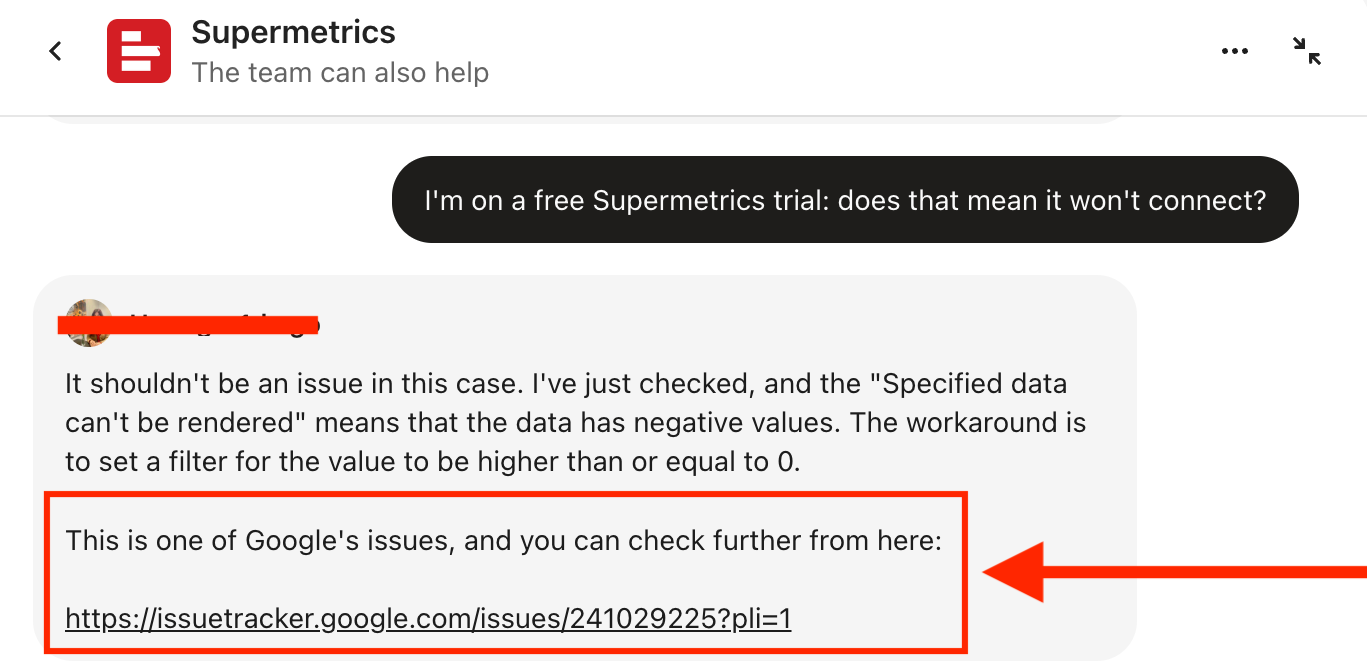 Granted, they were generous with their instructions and detailed steps, I still had two platforms’ support documentation open right in front of me to troubleshoot one data connector for one report.
As for dedicated support, if you're on their premium-priced “Business” or enterprise-level plans, Supermetrics does offer access to a dedicated Customer Success Manager. This is a higher level of personalized support and strategic guidance.
However, for users on the more common Starter, Growth, or Pro plans, this type of dedicated, proactive account management isn't typically part of the package; you'll be relying on the standard support channels like email, chat (often with a chatbot first), and the help center.
If the thought of diagnosing issues across Supermetrics and Looker Studio (and maybe contacting both support teams) makes your head spin, here’s the Whatagraph difference:
- Your very own dedicated Customer Success Manager—on every plan: That’s right. No need to be a top-tier enterprise client. Every Whatagraph user gets a dedicated Customer Success Manager.
- One platform, one call: Because Whatagraph handles everything—data connections (ETL), report building, and automation—there’s no finger-pointing at other tools if something goes wrong. We own it, we fix it.
This all-in-one support is why folks like Stef Oosterik, Quality Manager at Dtch. Digitals, not only LOVE our support but often make the switch from juggling tools like Looker Studio:
Whatagraph's support team is very responsive. This makes it easy for us to give feedback, think of solutions, and get the right data visible for clients quickly. And most issues are fixed in a day!
Read the full case study.
What are the other ways to get help?
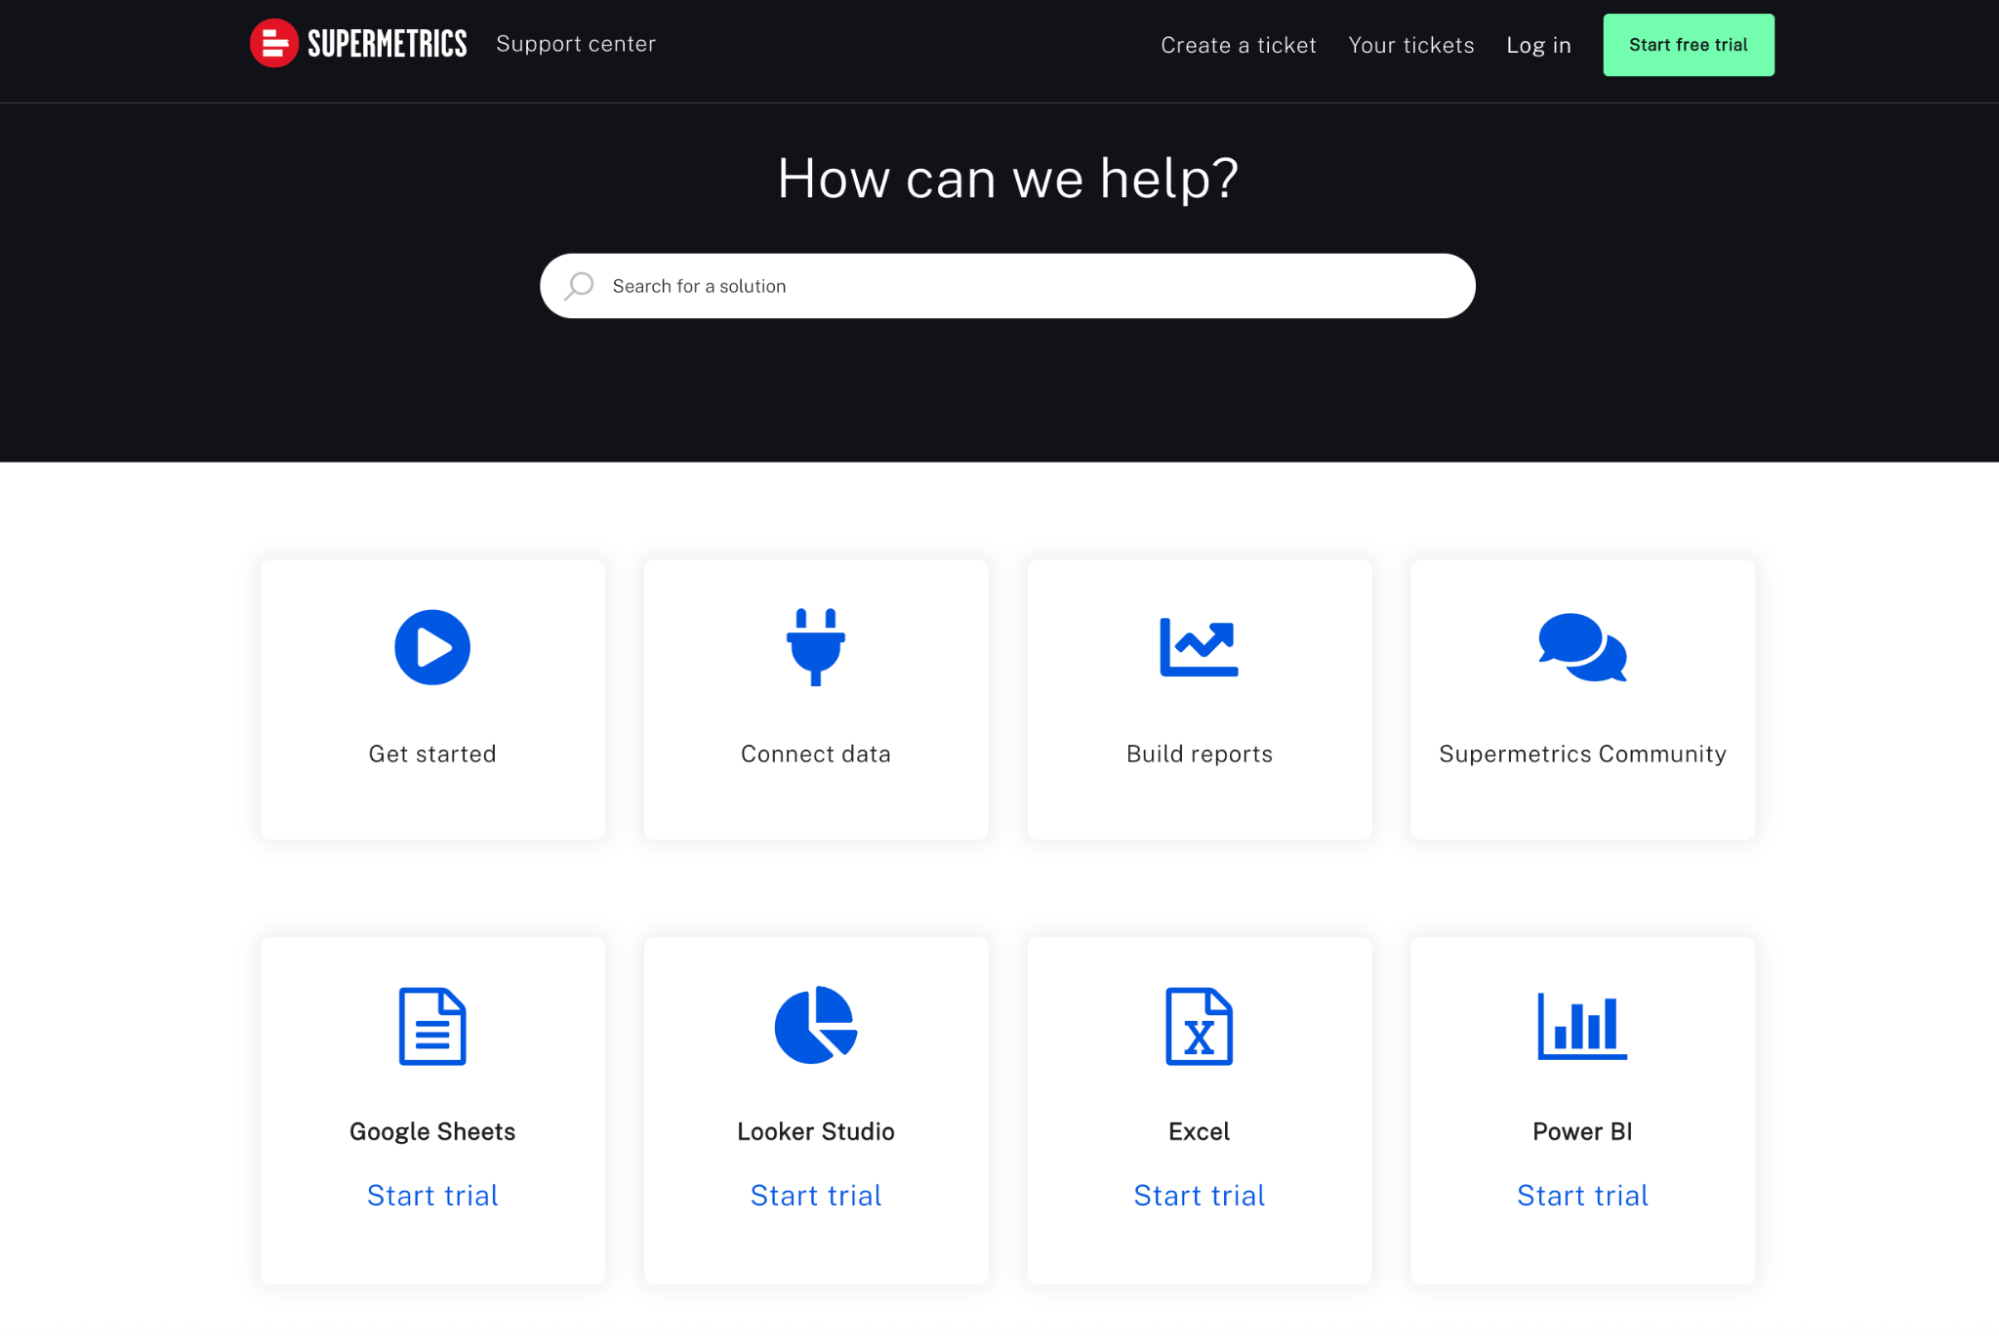
Supermetrics offers a few avenues:
- Support center: Supermetrics has a library of online articles, guides, and FAQs. This is your first line of defense for self-service troubleshooting and learning how features should work.
- Live chat: Supermetrics offers live chat support, accessible via their Hub and website, typically during their business hours (their support teams are in locations like Helsinki, Dublin, Atlanta, and Singapore, offering 24/5 coverage).
- Community: They also offer a native forum where people can ask and answer questions from fellow Supermetrics users.
When the above fails, you'll typically land on Supermetrics' online support ticket submission form.
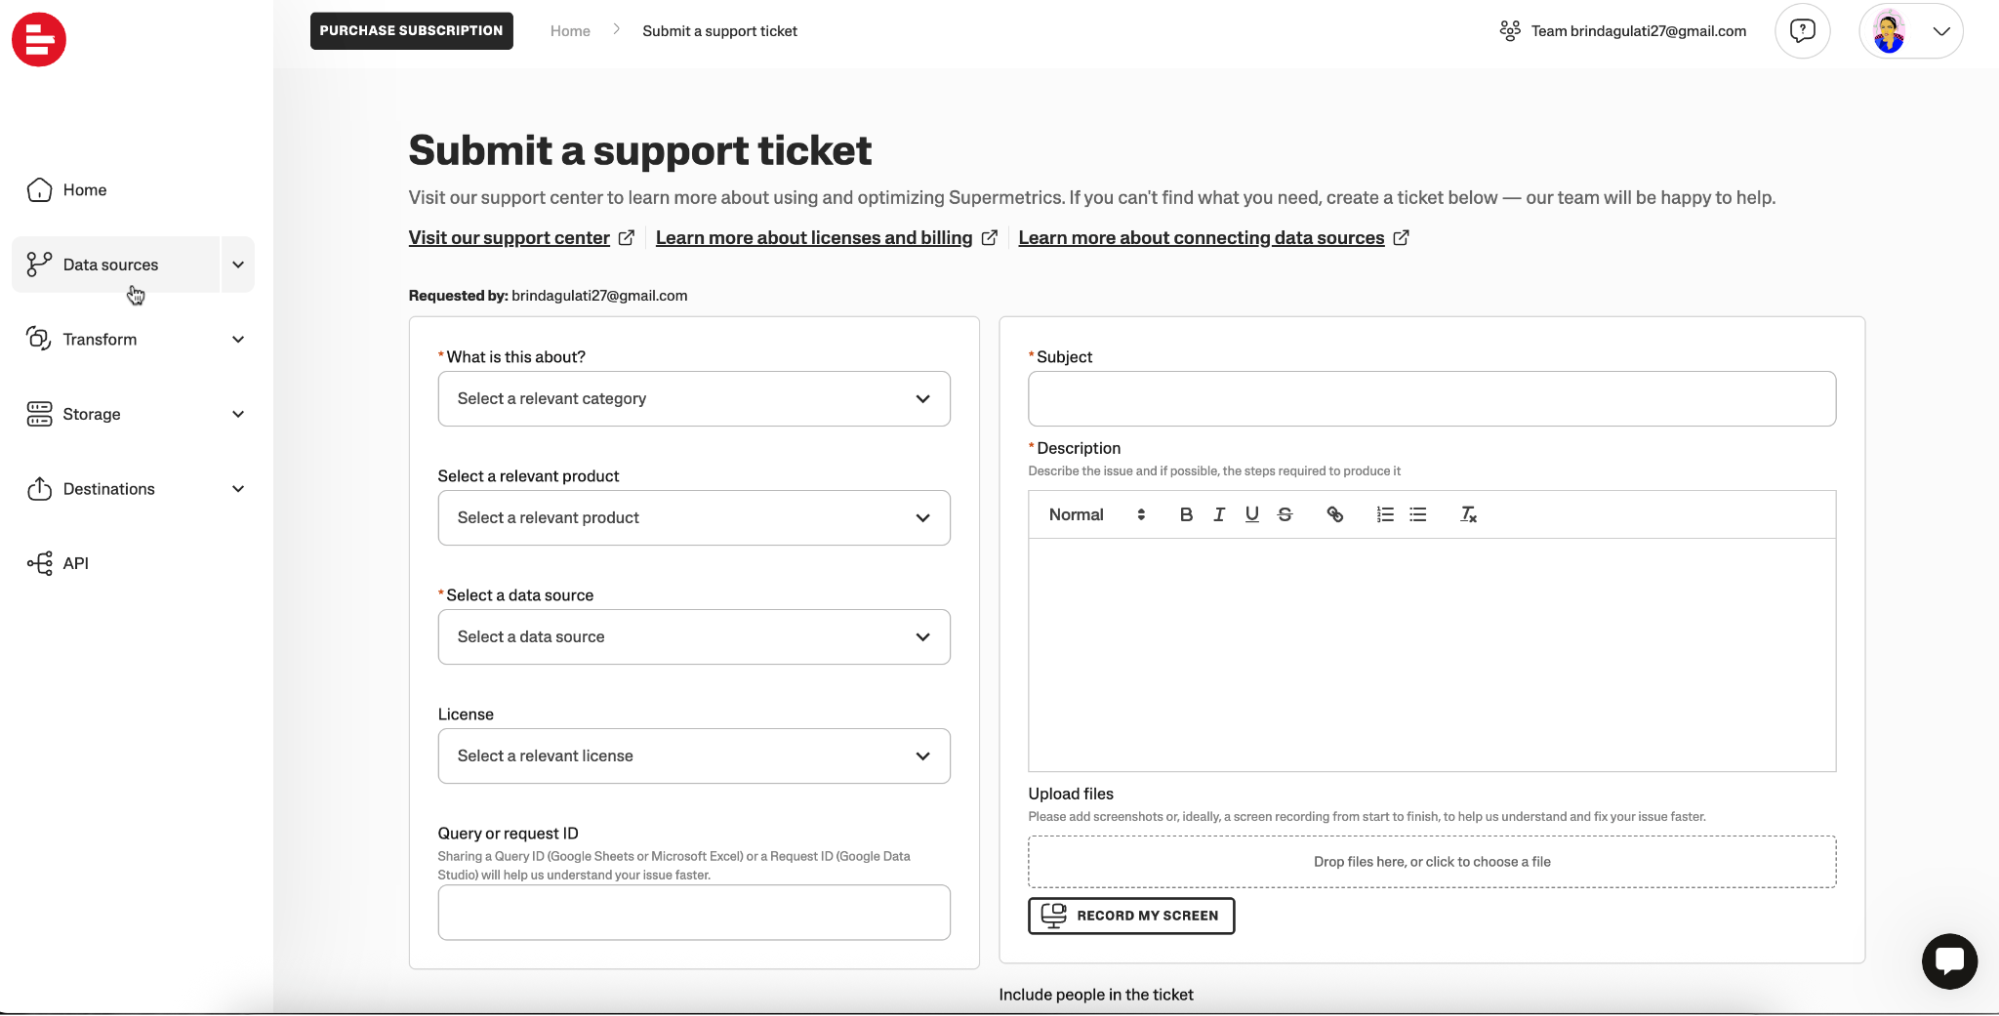
Supermetrics tries to gather a lot of specific information before you even type out your main problem.
You’ll often need to:
- Select a relevant category for your issue (e.g., technical, billing).
- Specify the Supermetrics product you’re using (for Sheets, Looker Studio, API, etc.).
- Pinpoint the exact data source involved, if applicable.
- Select your active license.
- Optionally provide a Query ID or Request ID.
This structured approach, in theory, helps Supermetrics route your ticket to the right team and gives them immediate context, which could lead to faster resolution if all details are provided correctly.
The “RECORD MY SCREEN” is a standout positive.
The ability to record your screen to show the problem directly from the ticket form is a modern feature that can be incredibly helpful for explaining complex bugs or unexpected behavior much more clearly than text alone.
But for a busy agency pro staring at a broken client report and needing a fast fix, navigating multiple dropdowns and trying to categorize a complex or unfamiliar issue before explaining it can feel like an extra hurdle.
What are real users saying about their experience?
Some users note that once you do get a support rep, they’re helpful on a 1:1 level:
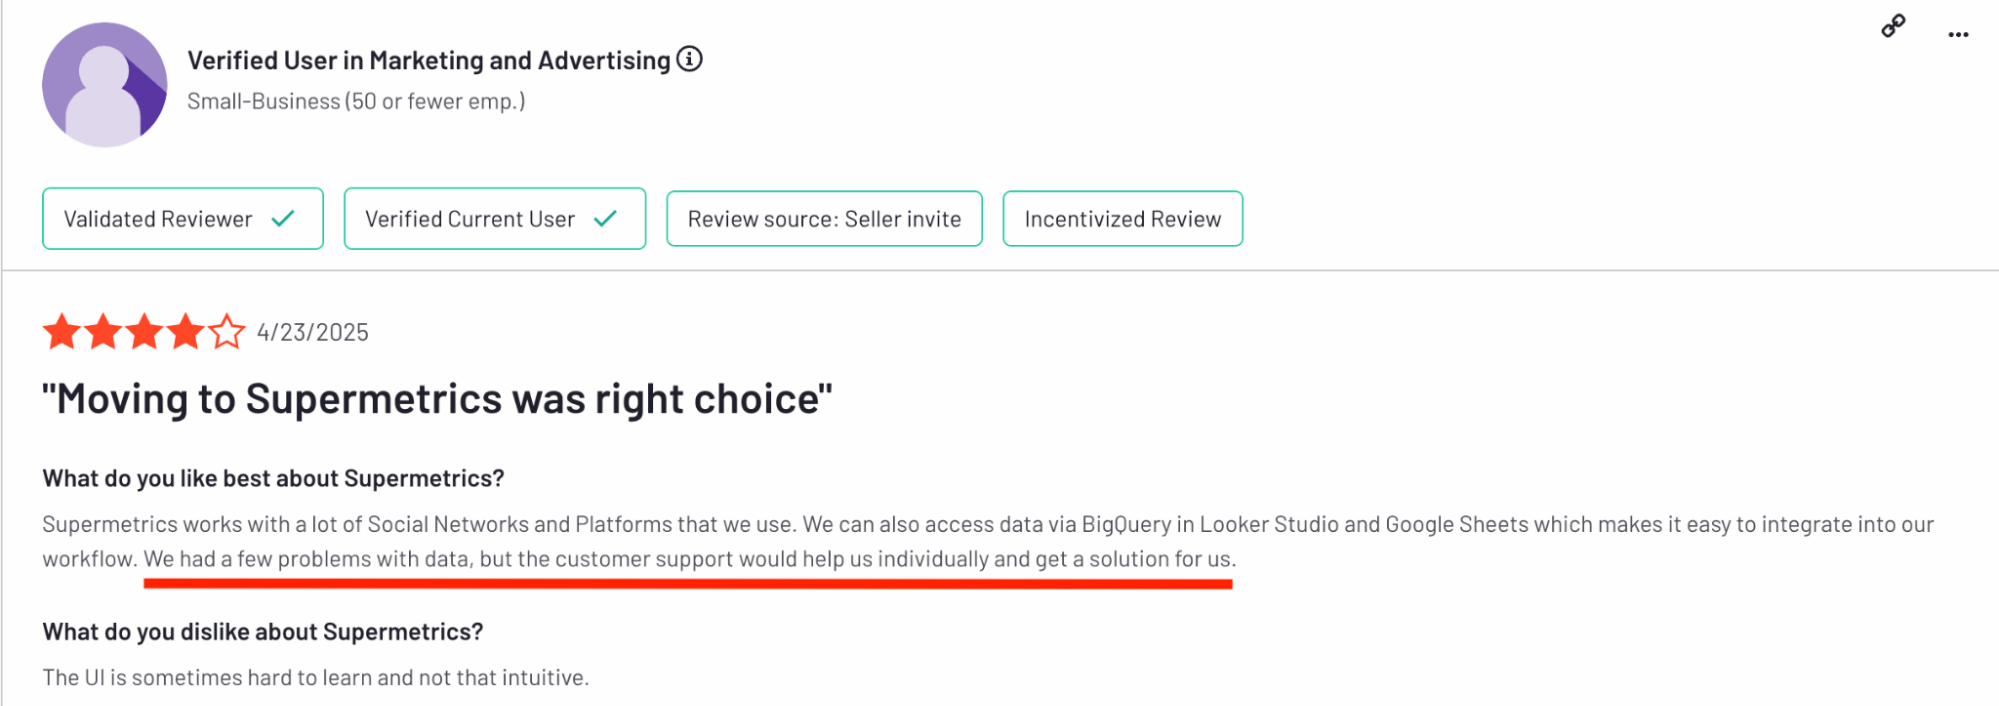
“We had a few problems with data, but the customer support would help us individually and get a solution for us.”
But even those faint praises are tempered with caution: the fix often depends on who you get and when.
While some users acknowledge Supermetrics’ potential, the overall sentiment ranges from frustrated to fully fed up.
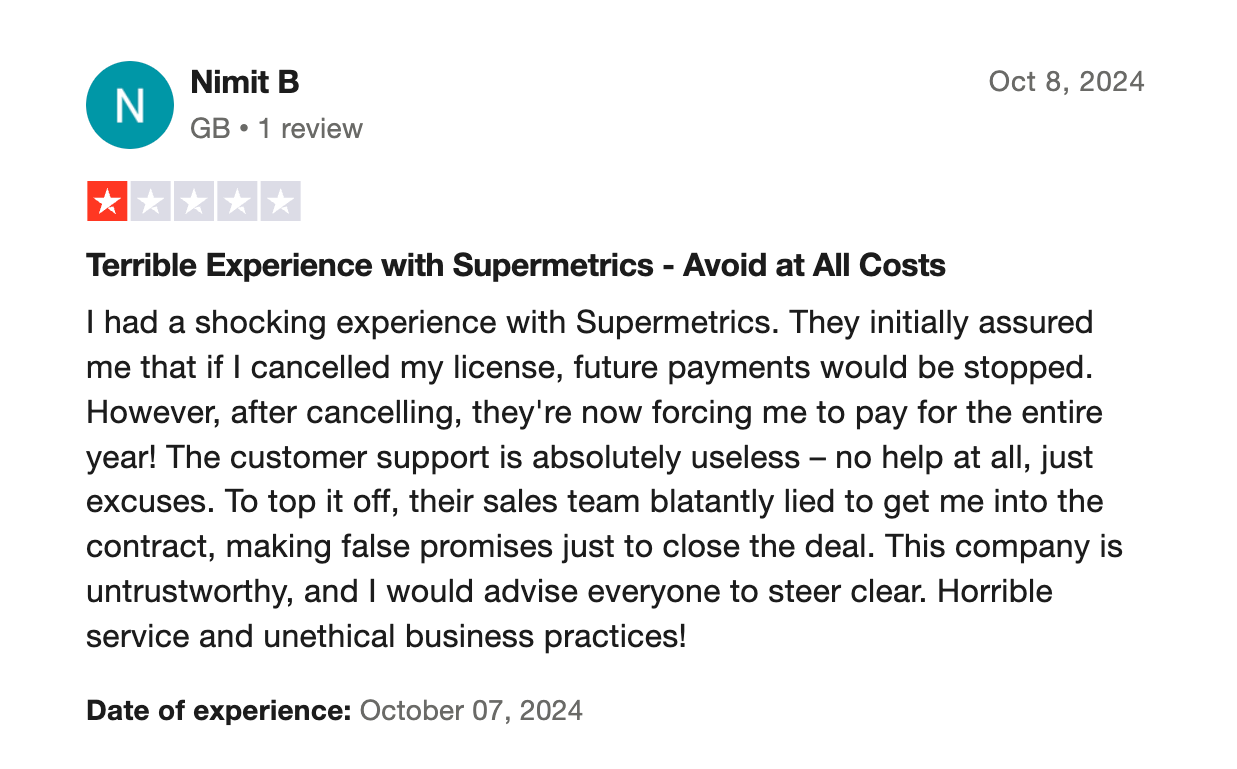
More than one user reported feeling blindsided by shifting terms—especially after committing to a contract.
Nimit B shares on Trustpilot: “They initially assured me that if I cancelled my license, future payments would be stopped. However, after cancelling, they're now forcing me to pay for the entire year! The customer support is absolutely useless – no help at all, just excuses.”
Some reviewers called the support team rude or unknowledgeable. Others said they were helpful—but only if you got the right person and at the right time. It's a bit of a roulette wheel.
And here’s what real, verified users say about Whatagraph’s customer support:
Apart from all the valuable things the tool has in itself, throughout the years we've chatted with their support for minor issues multiple times, and they were very quick to fix everything of even make improvements based on our feedback. Stellar group of people, these.
Customer support is exceptionally fast and knowledgeable—every question is answered professionally within minutes.
Whatagraph is always prompt and efficient in resolving any issues we encounter, ensuring that our workflow remains smooth and uninterrupted.
We’re pretty proud of these.
Supermetrics support can technically be helpful—if you’re lucky. But it’s often slow, confusing, or powerless to act. For agencies juggling deadlines and client expectations, that kind of inconsistency is a dealbreaker.
Final Verdict: When to Use Supermetrics and When to Switch
Choose Supermetrics if:
- You're a large enterprise or analytics-heavy team with a full BI setup already in place (think Looker Studio, Power BI, or Snowflake).
- Your main need is data movement, not reporting—you’ve got your visualization, client comms, and delivery handled elsewhere.
- You have the time and resources to manage two tools (Supermetrics + your BI tool) and the patience for occasional connector bugs or refresh delays.
- You’re okay with a complex, per-destination pricing model and reaching out to sales for every little upgrade or add-on.
- Your team is technically fluent and doesn’t mind building reports from scratch in a separate tool.
In short: Supermetrics works well if you’ve got infrastructure, experience, and internal buy-in to support a “data connector-only” workflow.
But if that’s not your reality…
- If you’re a growing marketing agency without a dedicated technical team.
- If your clients need reports that are on-brand, automated, and accurate—without you babysitting a flaky connector.
- If you’re tired of stitching two tools together just to get a single report out the door…
…it’s probably time to switch to something simpler.
Meet Whatagraph.
✅ Escape the “two-tool Frankenstein” for good
Whatagraph unites your entire reporting workflow—from seamless data connections to stunning, interactive client dashboards—all under one intuitive roof.
✅ Reporting power for your entire team
Whatagraph is built for marketers, by marketers. Empower everyone in your agency—from account managers to content specialists—to confidently create insightful, client-ready reports with an easy-to-use drag-and-drop interface.
✅ Agency-centric by design
Deliver reports that scream your brand, not ours or Google's, with comprehensive white-labeling and custom domain options. Effortlessly manage all your clients from a single, organized hub.
✅ Reclaim your hours
Most Whatagraph users reclaim a remarkable 30%-70% of their time.
If you want fewer tabs, faster reporting, and fewer headaches, it’s probably time to leave the middleman behind.
Book a call with us and get time back in your day, guaranteed.