


TL:DR
Funnel.io is a powerful data integration tool but unless you have a dedicated data team, it quickly becomes expensive, complex, and frustrating to manage. And as of 2026, Funnel.io no longer offers a free plan to new users. The Starter plan now starts at $400/month, with additional costs scaling based on usage. This makes Funnel a high-commitment tool from day one, especially for agencies and growing teams.
Who it’s best for:
Enterprises or data-savvy teams with in-house BI infrastructure who only need a pipeline, not visualization, automation, or client reporting.
Key features at a glance:
| Feature | Funnel.io |
| Integrations | 500+ connectors (varies by plan), but depth and reliability can be mixed |
| Stable connections | Some connectors fail or pull incomplete data, based on real user reviews |
| Ease of use | Steep learning curve; not beginner-friendly |
| Data blending | Available, but limited control compared to full-service platforms |
| Internal dashboards | Very basic; not client-ready or presentation-quality |
| Customizable reports | Native dashboards available, but you might want a BI tool like Looker Studio for client reporting |
| Report sharing & automation | Requires external tools for scheduling, formatting, and sharing reports |
| Security | ISO 27001, SOC 2 Type II, CSA STAR Level 1, GDPR- and CCPA-compliant, HTTPS encryption, MFA, SSO, role-based access |
Pros ✅
- Massive library of 500+ marketing data connectors
- Powerful data cleaning and transformation capabilities
- Flexible file import option for unsupported platforms
- Works well with popular BI tools like Looker Studio or Tableau
Cons ❌
- Can be expensive for small teams and agencies
- Native dashboards available for internal analysis but may not be customizable enough for client reporting
- Frequent complaints about missing or unreliable data
- Steep learning curve with minimal in-platform guidance
Why You Can Trust This Review
At Whatagraph, we live and breathe marketing data every day. That’s why this review is grounded in real use, real numbers, and real user pain points.
Here’s what we did:
- Fact-checked against live docs: Pricing, feature limits, and security claims are captured straight from the vendor’s public pages.
- Tracked real-world user discussions: Recent, verified G2, Capterra, and Trustpilot reviews; public forum threads, and help-center discussions are scanned for recurring themes—things that crop up more than once end up on our radar.
- Scored against agency must-haves: From stable integrations to client-ready reporting to quality of customer support.
We want you to walk away feeling informed and ready to make a smart, confident decision that benefits your team and your clients.
Funnel.io Pricing (Update 2026)
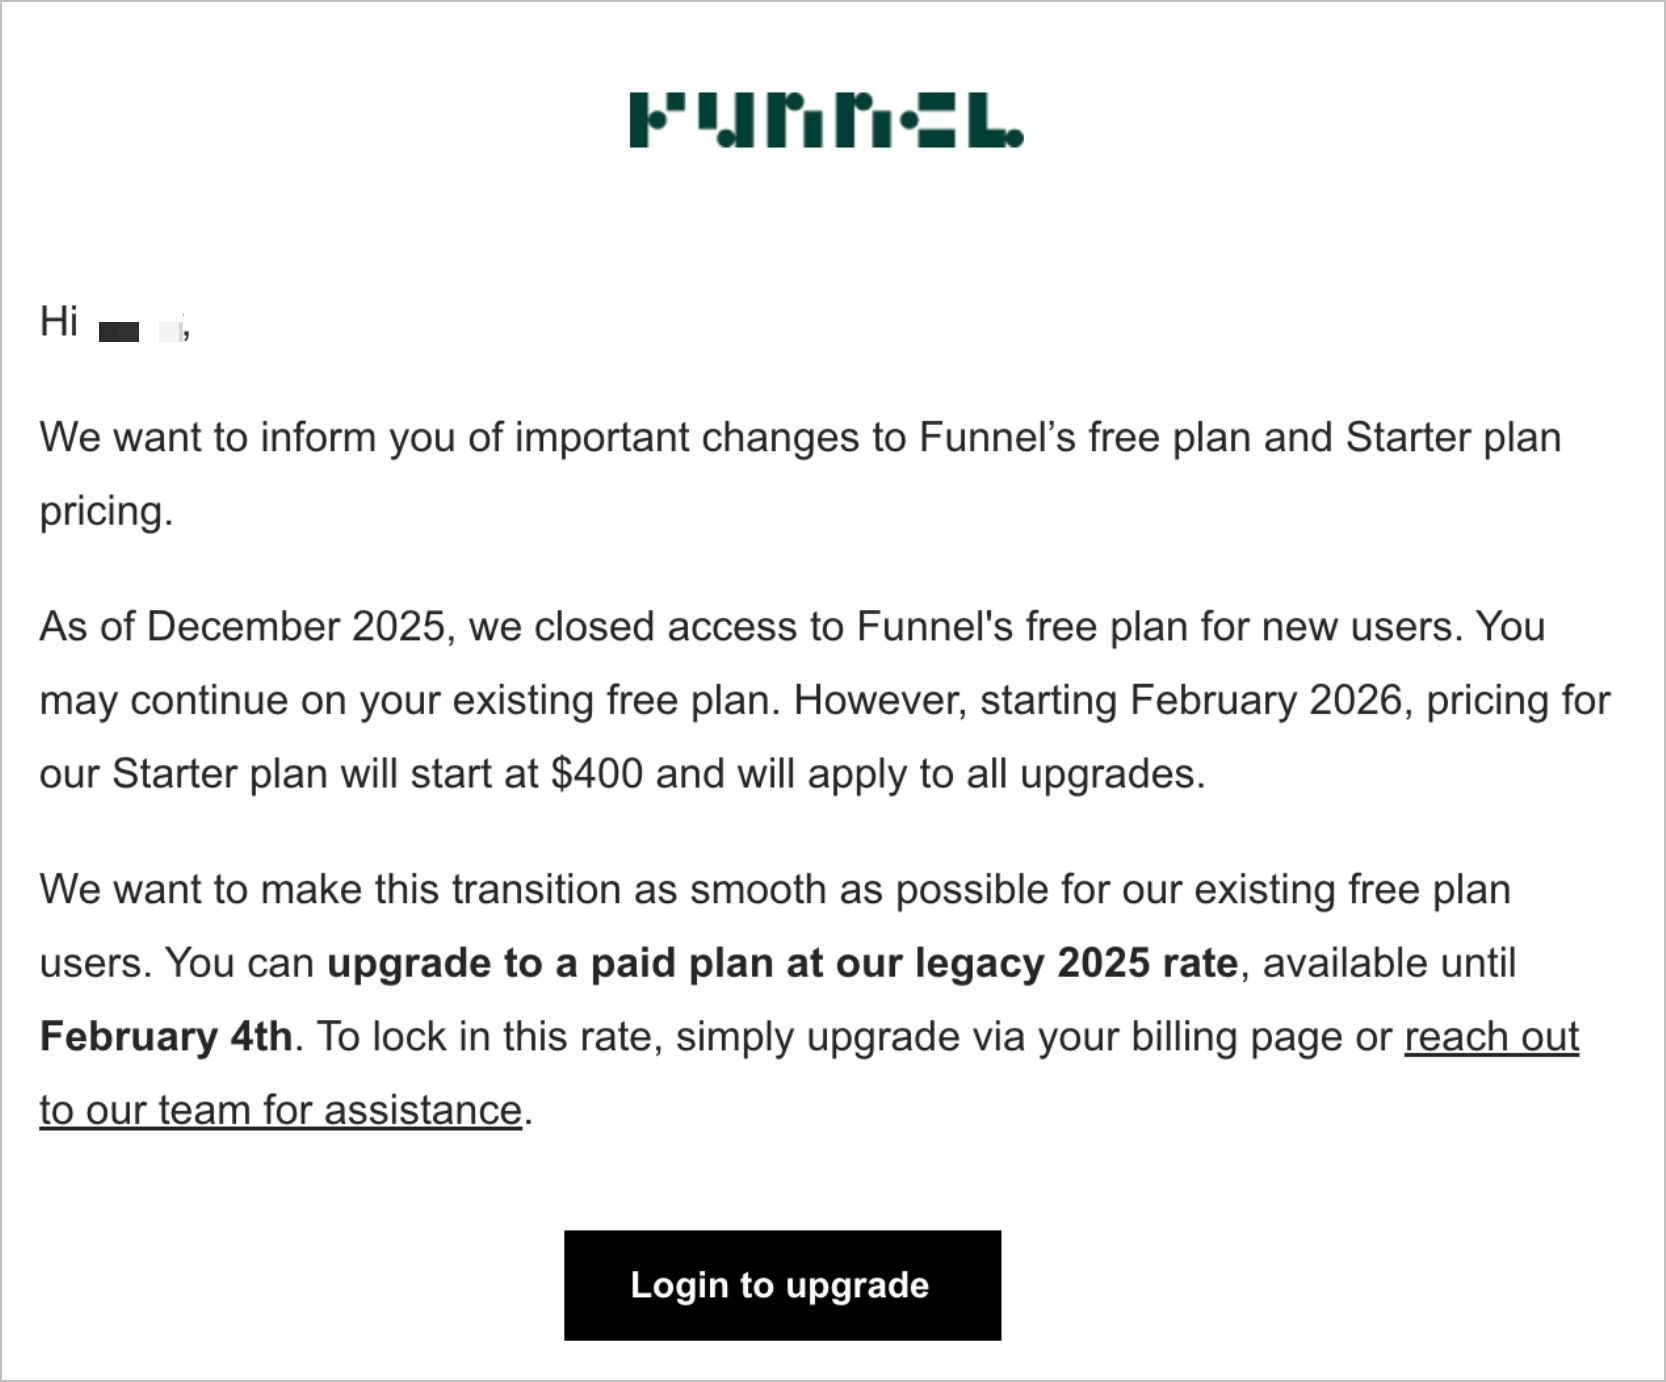
As of December 2025, Funnel.io closed its free plan to new users. This means:
- Existing free users can stay on their legacy plan
- New users cannot sign up for a free plan
- There’s no sandbox, trial, or lightweight way to test Funnel anymore
Starting February 2026, Funnel’s Starter plan now begins at $400/month, and this price applies to all new upgrades. A short window to lock in legacy 2025 pricing closed on February 4th, 2026.
 Beyond the higher entry point, Funnel’s pricing is based on flexpoints, meaning your monthly cost scales with connector usage, destinations, data volume, and reporting granularity. In practice, this makes total spend harder to predict—especially as clients, campaigns, or data needs grow.
This is how the new Funnel.io pricing plans look like in 2026:
| Plan | Who It’s For | Key Notes | Pricing (2026) |
| Free | Legacy users only | Closed to new signups | Not available |
| Starter | Teams needing basic data modeling | Flexpoint-based usage | Starts at $400/month |
| Business | Growing teams with advanced needs | More connectors, higher data volumes, flexpoints still apply | Usage-based |
| Enterprise | Large organizations | Custom setup, governance, enterprise security | Custom pricing |
Important: Plan tiers don’t cap your spend. Flexpoints do, which means costs increase as you add connectors, destinations, data volume, or reporting granularity.
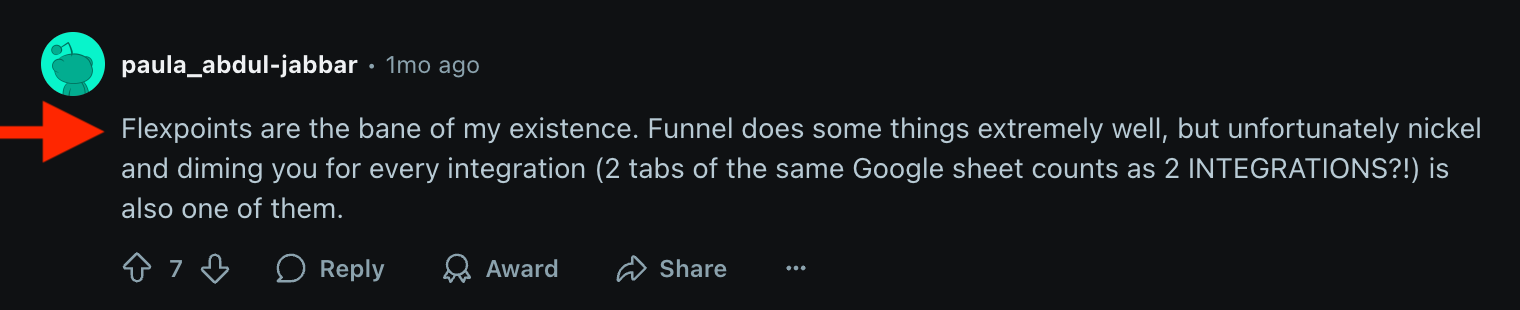
This user on Reddit calls flexpoints “the bane of my existence.”
This is a common complaint among users, who often feel penalized for using the platform's capabilities—because they ”nickel and dime” you for every integration.
This is a common complaint among users, who often feel penalized for using the platform's capabilities because they ”nickel and dime” you for every integration.
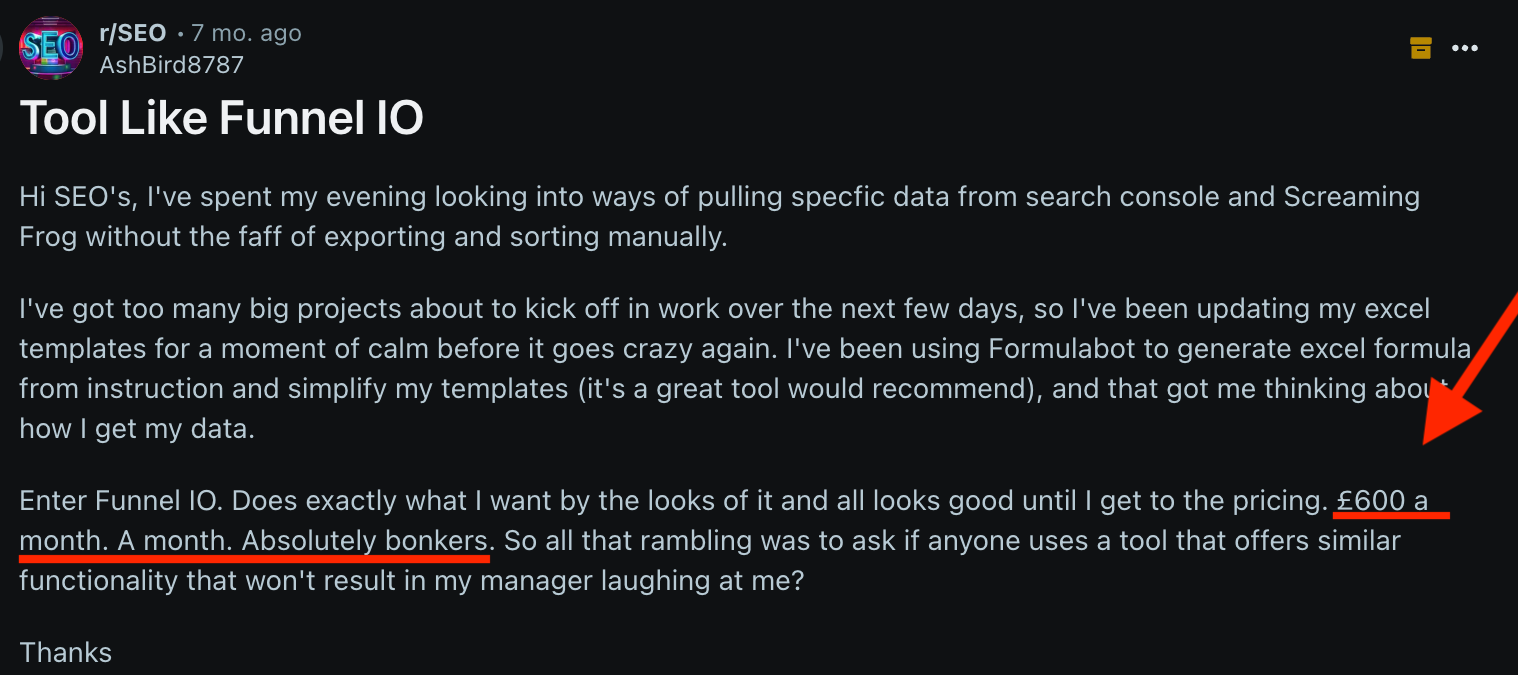
Another Reddit user in r/SEO calls Funnel’s pricing “absolutely bonkers.” They say it does exactly what they want, but at approximately $800/month, they need a Funnel.io alternative that their manager wouldn’t laugh at.
Plus, not all connectors are even available on the Starter plan. Some (like Tapjoy and Amplitude) are locked behind the Business plan or require custom setup—so you’re nudged up the pricing tiers fast.
But that’s all in “theory”. Let’s look at Funnel’s pricing in practice (and compare it to Whatagraph):
Funnel.io v.s. Whatagraph Pricing
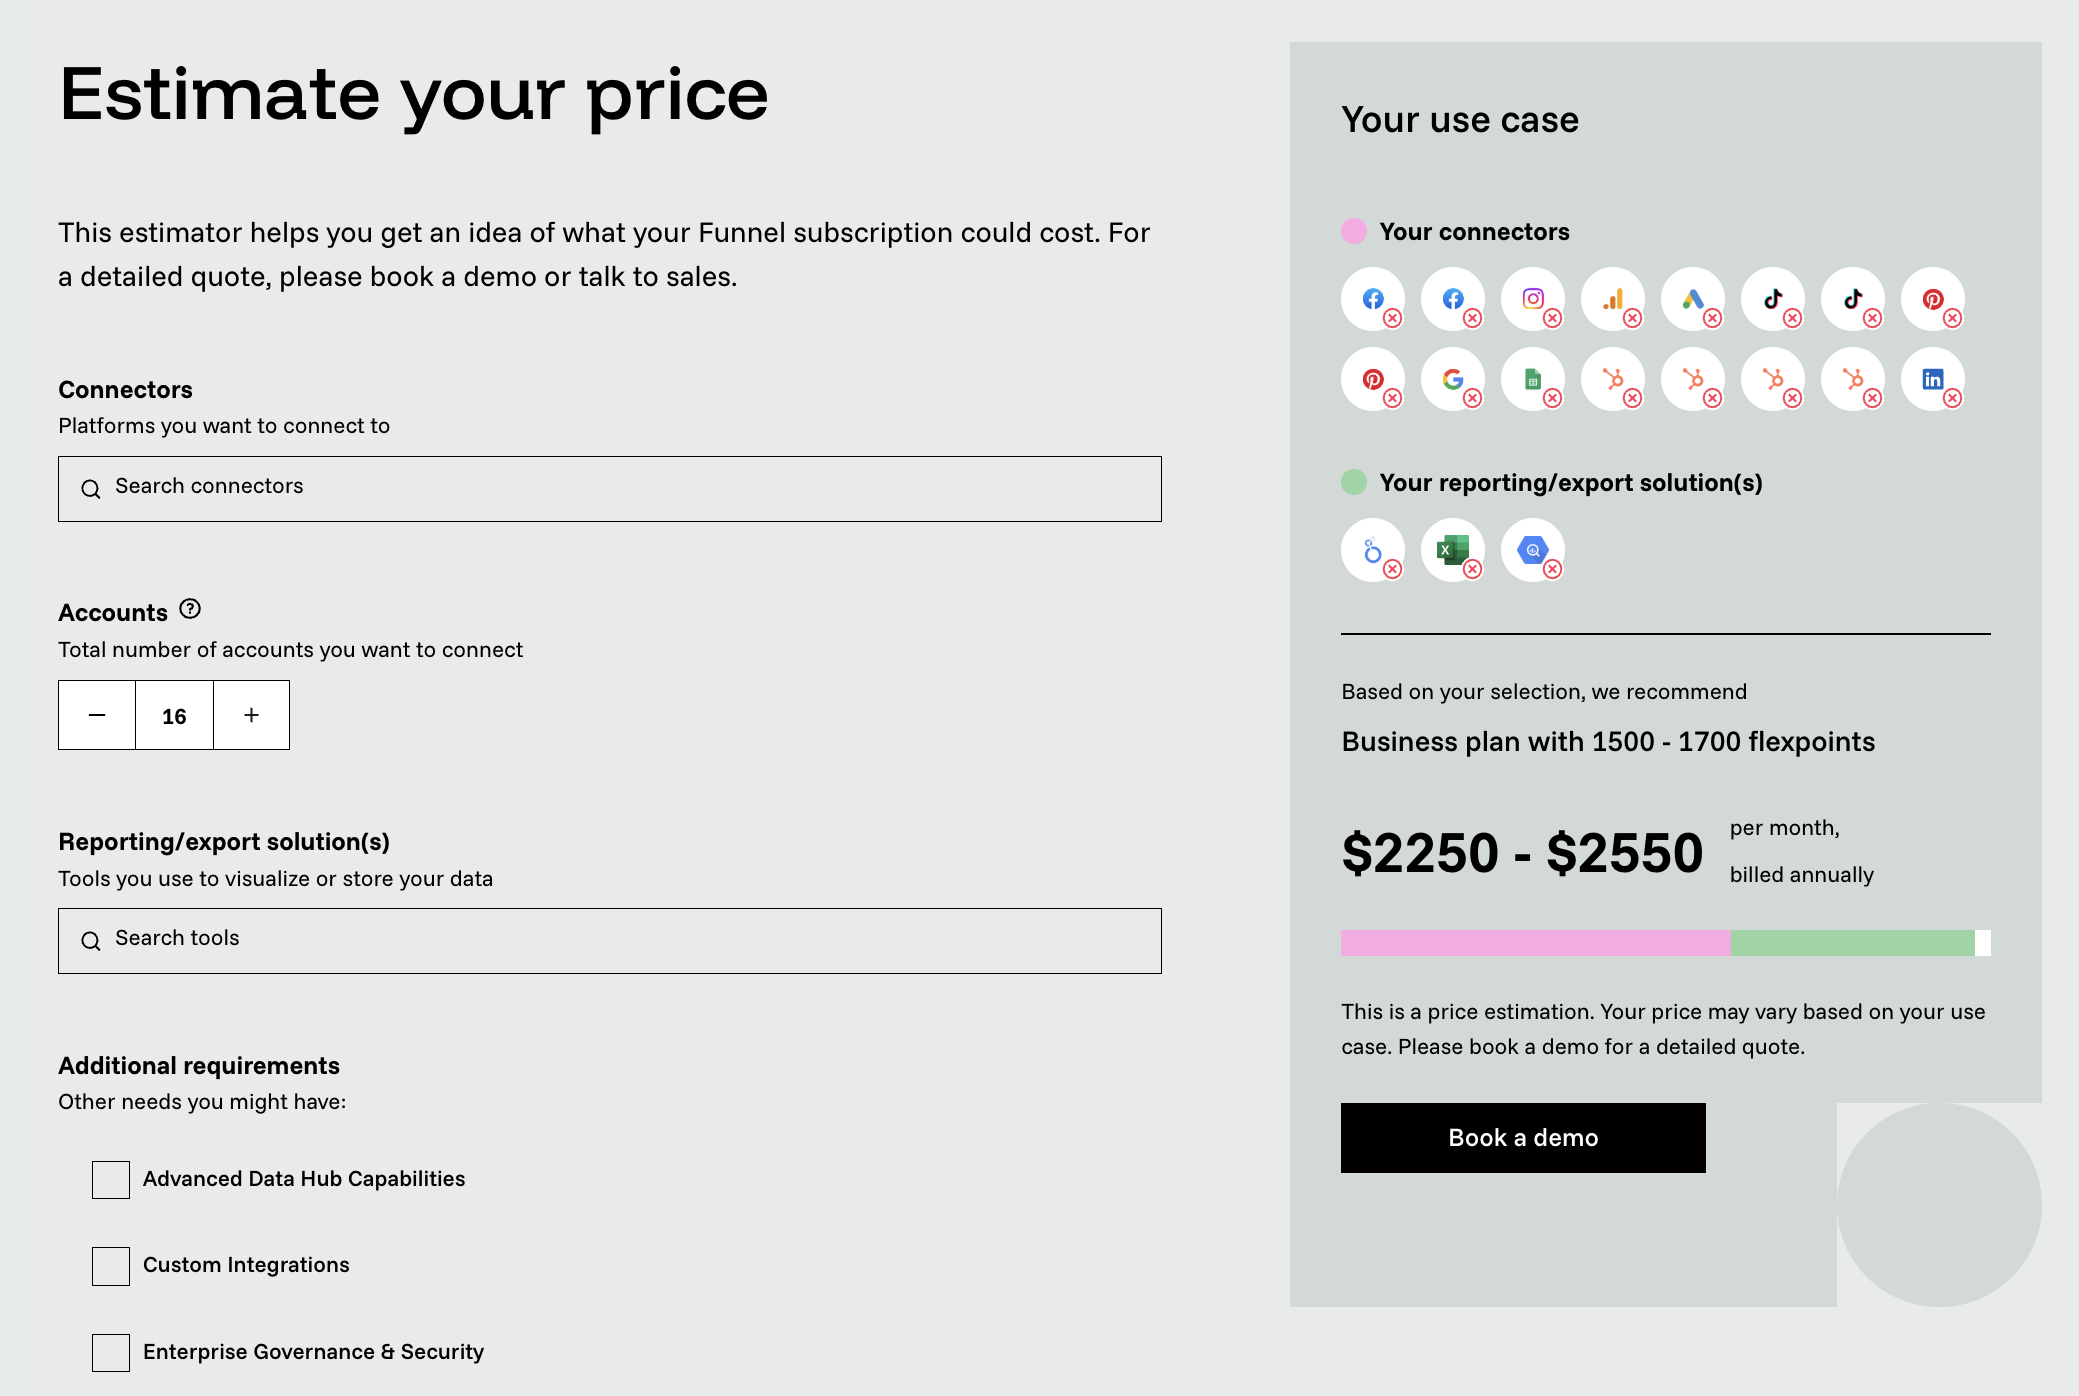
I ran a test using Funnel’s Price Estimator:
- 16 data connectors
- 3 export destinations (Looker Studio, Excel, and BigQuery)
The cost came down to $2250 - $2550 a month (billed monthly). And if you add a special feature like “Advanced measurement”, you’re prompted to “Talk to Sales” immediately.
Whereas, on Whatagraph:
- The same 16 connectors
- Native reports and dashboards (no need for Looker Studio)
- Data transfer to Excel included as standard, with BigQuery and Looker Studio transfer available depending on plan
…are all included in a single Whatagraph plan, with no per-connector or per-destination charges stacking on top.
This means:
Funnel is meaningfully more expensive than Whatagraph for the same setup, and still doesn't include native visualizations (except for a basic internal dashboard).
And according to our internal research, a company is spending 100K EUR for 1,000 data sources with Funnel.
Plus, Whatagraph gives you a free, full-access trial, not a locked-down demo, so you can build and send a real report before committing to anything. This means:
Your entry cost to Whatagraph is $0 upfront, while it's $400 at the minimum for Funnel.
Start a free trial with Whatagraph today and take it for a test-drive.
Key takeaways for your Funnel budget
- No free entry point anymore: Funnel.io’s free plan is closed to new users, so you can’t test or validate the tool without paying. Instead $400/month is the new baseline, making Funnel a high-commitment decision from day one.
- Factor in the cost of your visualization tool: Funnel gets the data to Looker Studio/Tableau/Power BI. You still need to pay for those tools if they have associated costs, or at least factor in the time/expertise to manage them.
- Best suited for teams with fixed budgets. Funnel.io makes the most sense if you already know your exact data needs and have budget approved upfront. For teams that need to experiment, scale gradually, or tightly control costs, the pricing model is far less forgiving in 2026.
Funnel.io's pricing plans prioritize usage-based billing over predictability. For agencies or growing businesses, this can be a significant financial and operational burden.
Real User Reviews: What are Customers Saying About Funnel.io?
We analyzed recent reviews and discussions from independent platforms like G2, Capterra, Trustpilot, and relevant Reddit communities (like r/PPC and r/Marketing) to identify the major themes—both positive and negative—in user feedback.
Funnel.io pros: What users love
✅ Easy to integrate with other tools
Lauren D. on G2 says that Funnel was “generally easy to integrate with our other already existing software.”
This means Funnel largely plays well with the rest of your stack. If you're already using BI tools like Looker or Tableau, Funnel acts as a smooth data pipeline—not a walled garden. This is especially useful for in-house data teams with pre-established workflows.
✅ Huge connector library + file import fallback
Chances are, if you run ads or email campaigns there, Funnel connects to it. And if it doesn’t, you can still bring in the data manually through their file import tool.
It’s not as elegant as a native integration, but it gets the job done.
This is what Chris G. likes best about Funnel: “Numerous connectors available for various platforms…Flexible File Import tool for platforms not available natively.”
✅ Helpful learning and quick analysis features
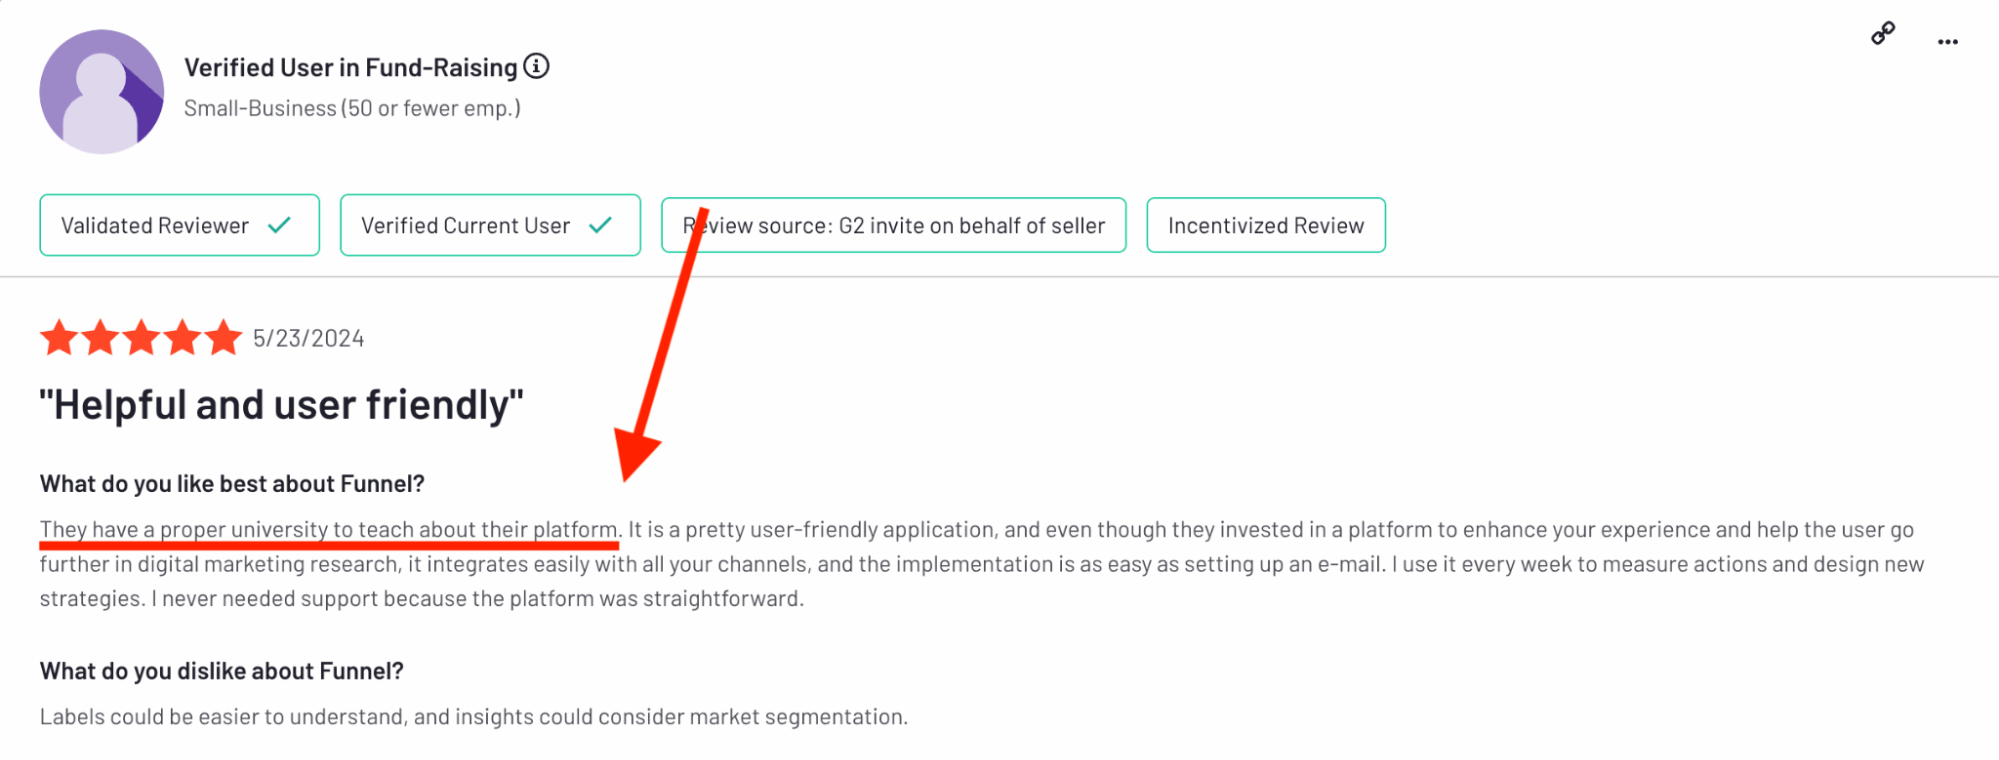
Learning and quick exploration features add another layer of value. The existence of a "proper university to teach about their platform" is a definite plus, and the "Data exploration tool works well for quick, ad hoc analysis."
Funnel.io cons: Where users get frustrated
❌ Cancellation policies feel rigid—and even “predatory”
The most recent review (March 2025) on Trustpilot from brett says: “If you’re considering signing up, be extremely cautious and read the fine print. There are plenty of companies out there with transparent and fair policies—this isn’t one of them.”
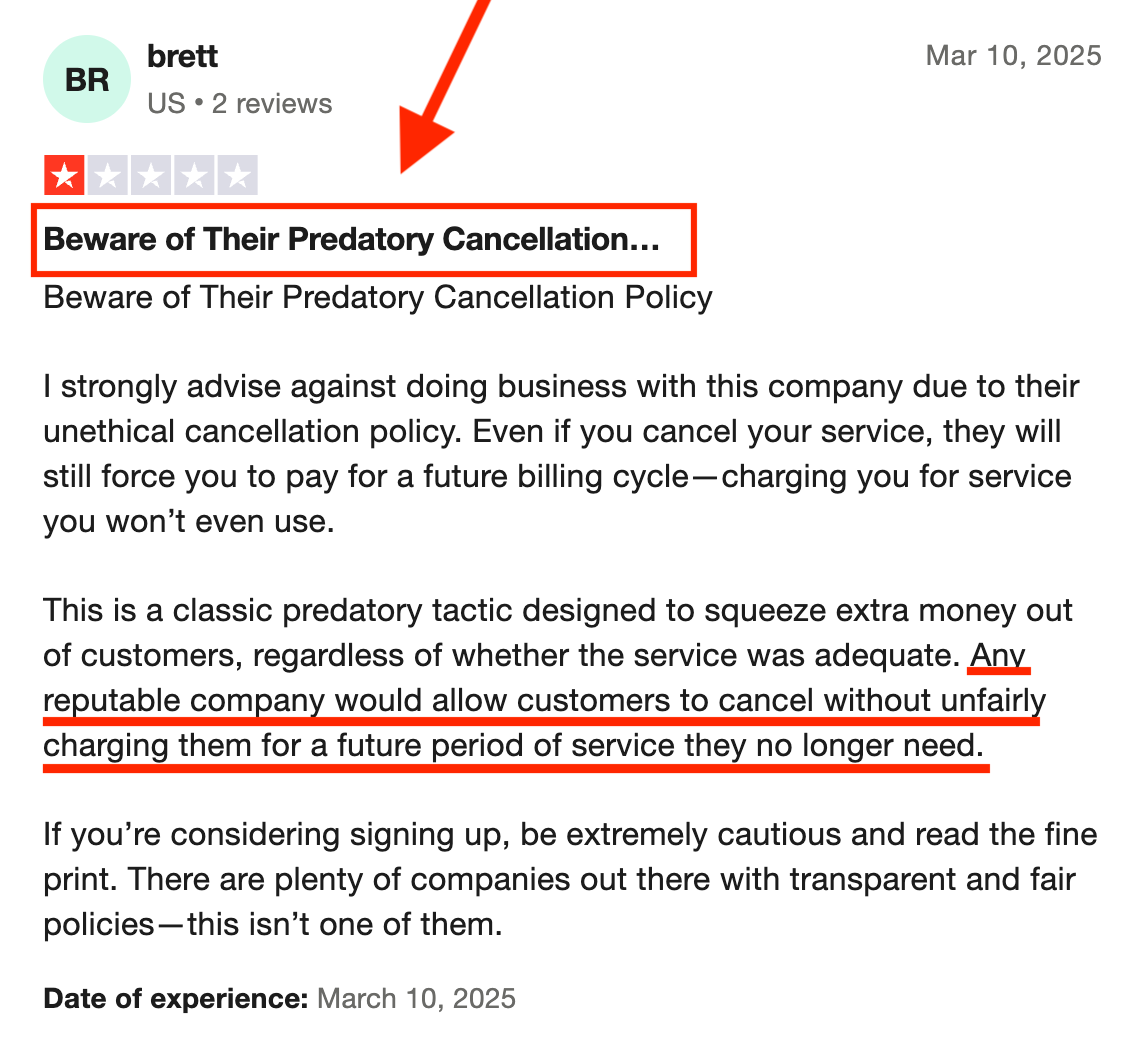
Multiple users flag the cancellation process as inflexible at best—and borderline exploitative at worst. Forget to cancel early, and you could be on the hook for another full billing cycle, even if you no longer need the service.
That’s a major red flag for budget-conscious teams or agencies managing multiple vendors.
❌ Data integrity issues from duplicate sources or missing KPIs
A verified user on G2 shares: “Missing some kpis and sometimes there are discrepancies that need to be investigated with the support team.”
Another verified user complains: “There are issues when sometimes a data source needs connected more than once and causes doublecounting of metrics.”
For a platform built around clean data, users report inconsistent results. Some integrations lead to duplicate metrics, while others lack key fields—forcing users to chase down answers with support.
For high-stakes client reports, that’s a problem.
❌ Constant need to micromanage usage to avoid flexpoint overages
Funnel’s flexpoint model sounds flexible—but in practice, it means constantly monitoring your syncs. Forget to pause a datasource, and you’re burning credits. If you want to pull historical data for one ad account? That’ll cost extra.
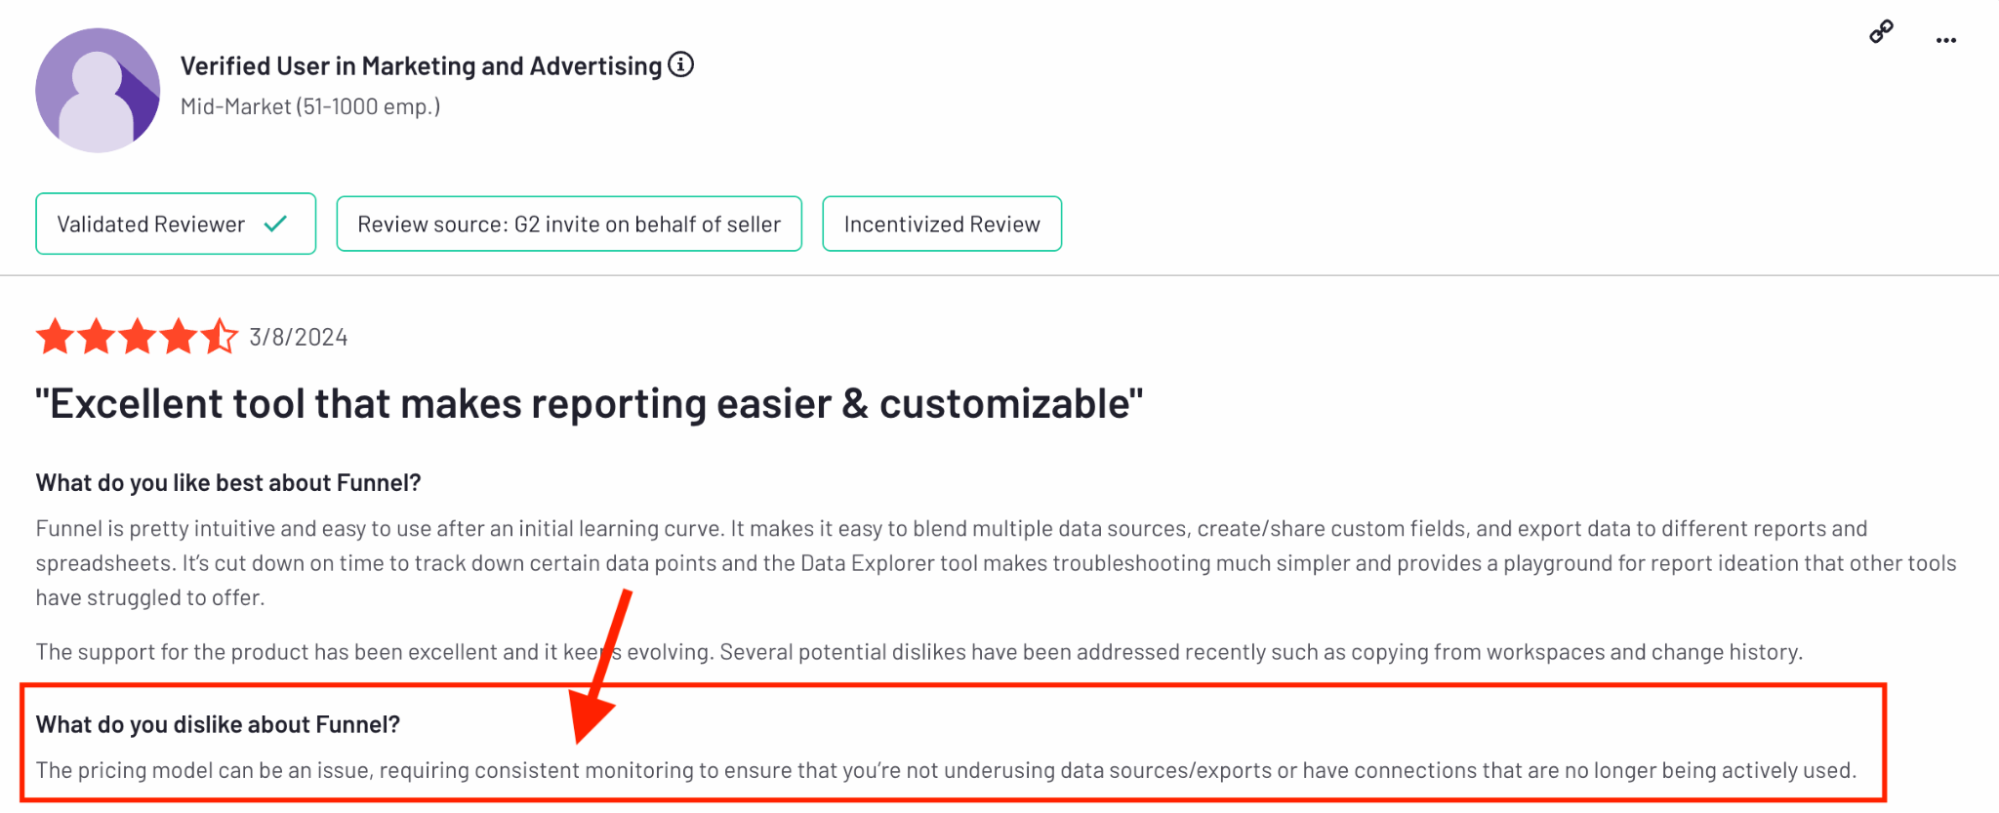
A verified user on G2 captures this pain point: “The pricing model can be an issue, requiring consistent monitoring to ensure that you’re not underusing data sources/exports or have connections that are no longer being actively used.”
 This makes budgeting harder, especially in larger teams with lots of active campaigns.
“Depending on size of agency of company, it is very easy to use up all of your flexpoints,” shares Chris G, a five-star reviewer.
❌ A steep learning curve and lack of in-platform guidance
Funnel is a technical tool first, marketing tool second. Even users who find it powerful wish there were more built-in prompts, templates, or walkthroughs—especially for data cleanup. For non-analysts or junior team members, the platform can feel opaque without strong onboarding support.
A verified user on G2 shares: “a useful added feature that would help less technical people is to have more guidance/suggestions on how the the data can be cleaned/mapped via funnel.”
What Does Funnel.io Genuinely Do Well?
Funnel.io positions itself as a "Marketing Data Hub." At its core, it's a sophisticated data integration and ETL (Extract, Transform, Load) tool designed for marketers.
- Extract: Funnel.io excels at connecting to a massive number of marketing data sources. This includes marketing platforms (Google, Meta, LinkedIn, TikTok, etc.), analytics tools (Google Analytics), CRM systems, ecommerce platforms, etc. It automates the laborious task of pulling data from these disparate systems.
- Transform: This is where Funnel.io's power for technical users shines. It allows you to clean, map, group, and harmonize your data. You can create custom dimensions and metrics, standardize naming conventions (so "campaign_X" from Facebook Ads aligns with "Campaign_X" from Google Ads), and apply currency conversions. This prepares the data for analysis, making it "analysis-ready."
- Load: Once transformed, Funnel.io sends this prepared data to various destinations. Typically, these are:
- Business Intelligence (BI) tools: Looker Studio (formerly Google Data Studio), Tableau, Microsoft Power BI.
- Data warehouses: Google BigQuery, Snowflake, Amazon Redshift.
- Spreadsheets: Google Sheets.
So, your data is in Funnel.io...now what?
If your pain is purely about getting diverse marketing data into your powerful, existing BI setup, Funnel.io is a contender.
But for many, that's only half the battle.
Funnel.io has collected and transformed your data. It's clean, harmonized, and "analysis-ready."
Fantastic.
But how do you actually use this data to:
- Create professional, visually appealing reports for your clients?
- Provide easy-to-understand dashboards for your C-suite?
- Automate the delivery of these reports?
- Allow non-technical team members (like Account Managers) to build or customize these reports?
Funnel.io itself doesn't do this—except offering very basic native dashboards.
So, the inevitable next step for almost all Funnel users who need to produce reports is to connect Funnel to a separate data visualization or BI tool.
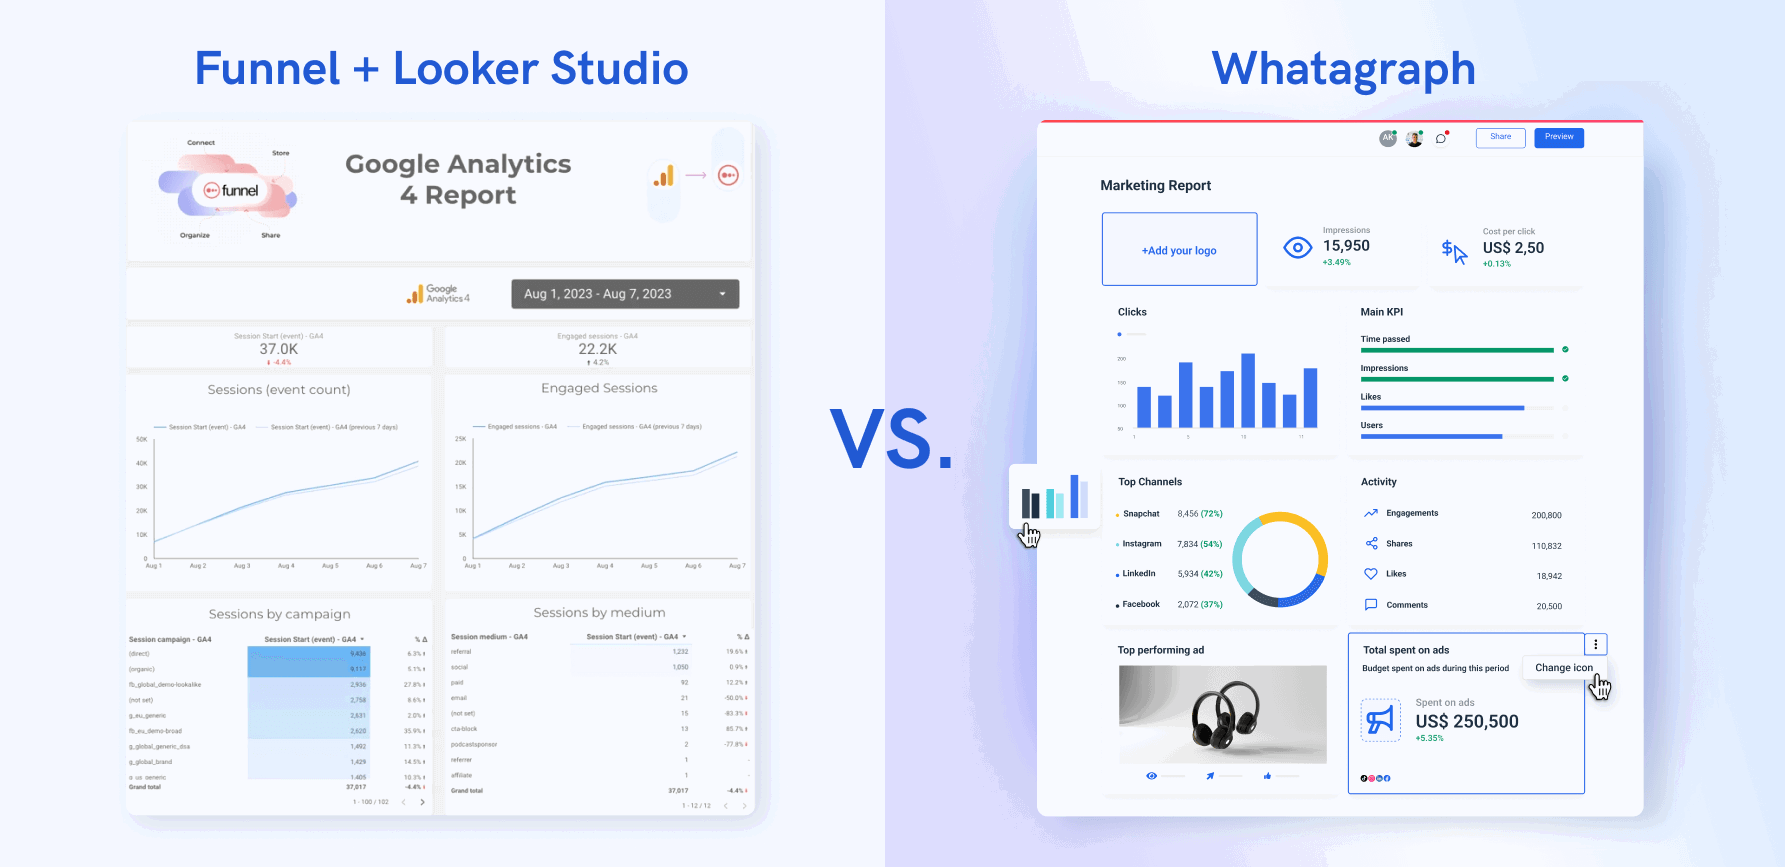
The most common choice, especially for its perceived low cost, is Looker Studio. (Which, if you’re a growing marketing agency, you’ll outgrow very soon.)
Spoiler alert: Funnel.io and Looker Studio often step on each other's toes.
This forced partnership, born out of Funnel’s connector-only nature, doesn't just add a couple of steps to your workflow; it breeds a host of new frustrations that anyone seriously considering Funnel needs to anticipate.
Real-life success story: How Peak Seven ditched the Funnel + Looker Studio struggle
Kim Strickland, a Digital Marketing Specialist at Peak Seven, used to spend 40+ hours per report in Looker Studio while using Funnel for data prep—and Supermetrics for connector gaps.
I call this the “two-tool Frankenstein.” Actually, make that three for Kim.
Kim constantly battled broken filters, mismatched fields, and client-facing errors that tanked trust.
Looker Studio was slow and always breaking. The data wouldn’t pull through, or it would pull through incorrectly. It was frustrating, time-consuming, and a constant guessing game.
After switching to Whatagraph, Kim saved 63 hours per month on reporting, which translated into $9K savings per client, per month. She now builds custom templates, uses drag-and-drop widgets, and confidently shares real-time dashboards with clients.
With Looker Studio, everything was muddled. But Whatagraph has opened up transparency and communication. Whatagraph is now our Bible—both for clients and internal teams.
What's the Real Story With Funnel.io?
If using Funnel with another tool always feels this messy, you might be thinking: why bother at all?
So, what is it about Funnel.io—its features, pricing, or reputation—that still draws people in?
And are the workflow headaches just part of the deal…or could they be avoided if you really knew how to work the system?
Let’s take a closer look and find out if Funnel.io is actually worth the effort. Or just adding more complexity to your tech stack.
Funnel.io Deep Dive #1: Data Pulling and Connectors
A data pipeline lives or dies by its ability to pull data. Reliably and completely.
Funnel.io boasts an impressive arsenal of connectors. But once you flip that switch and hit 'connect,' what really happens?
Let’s find out.
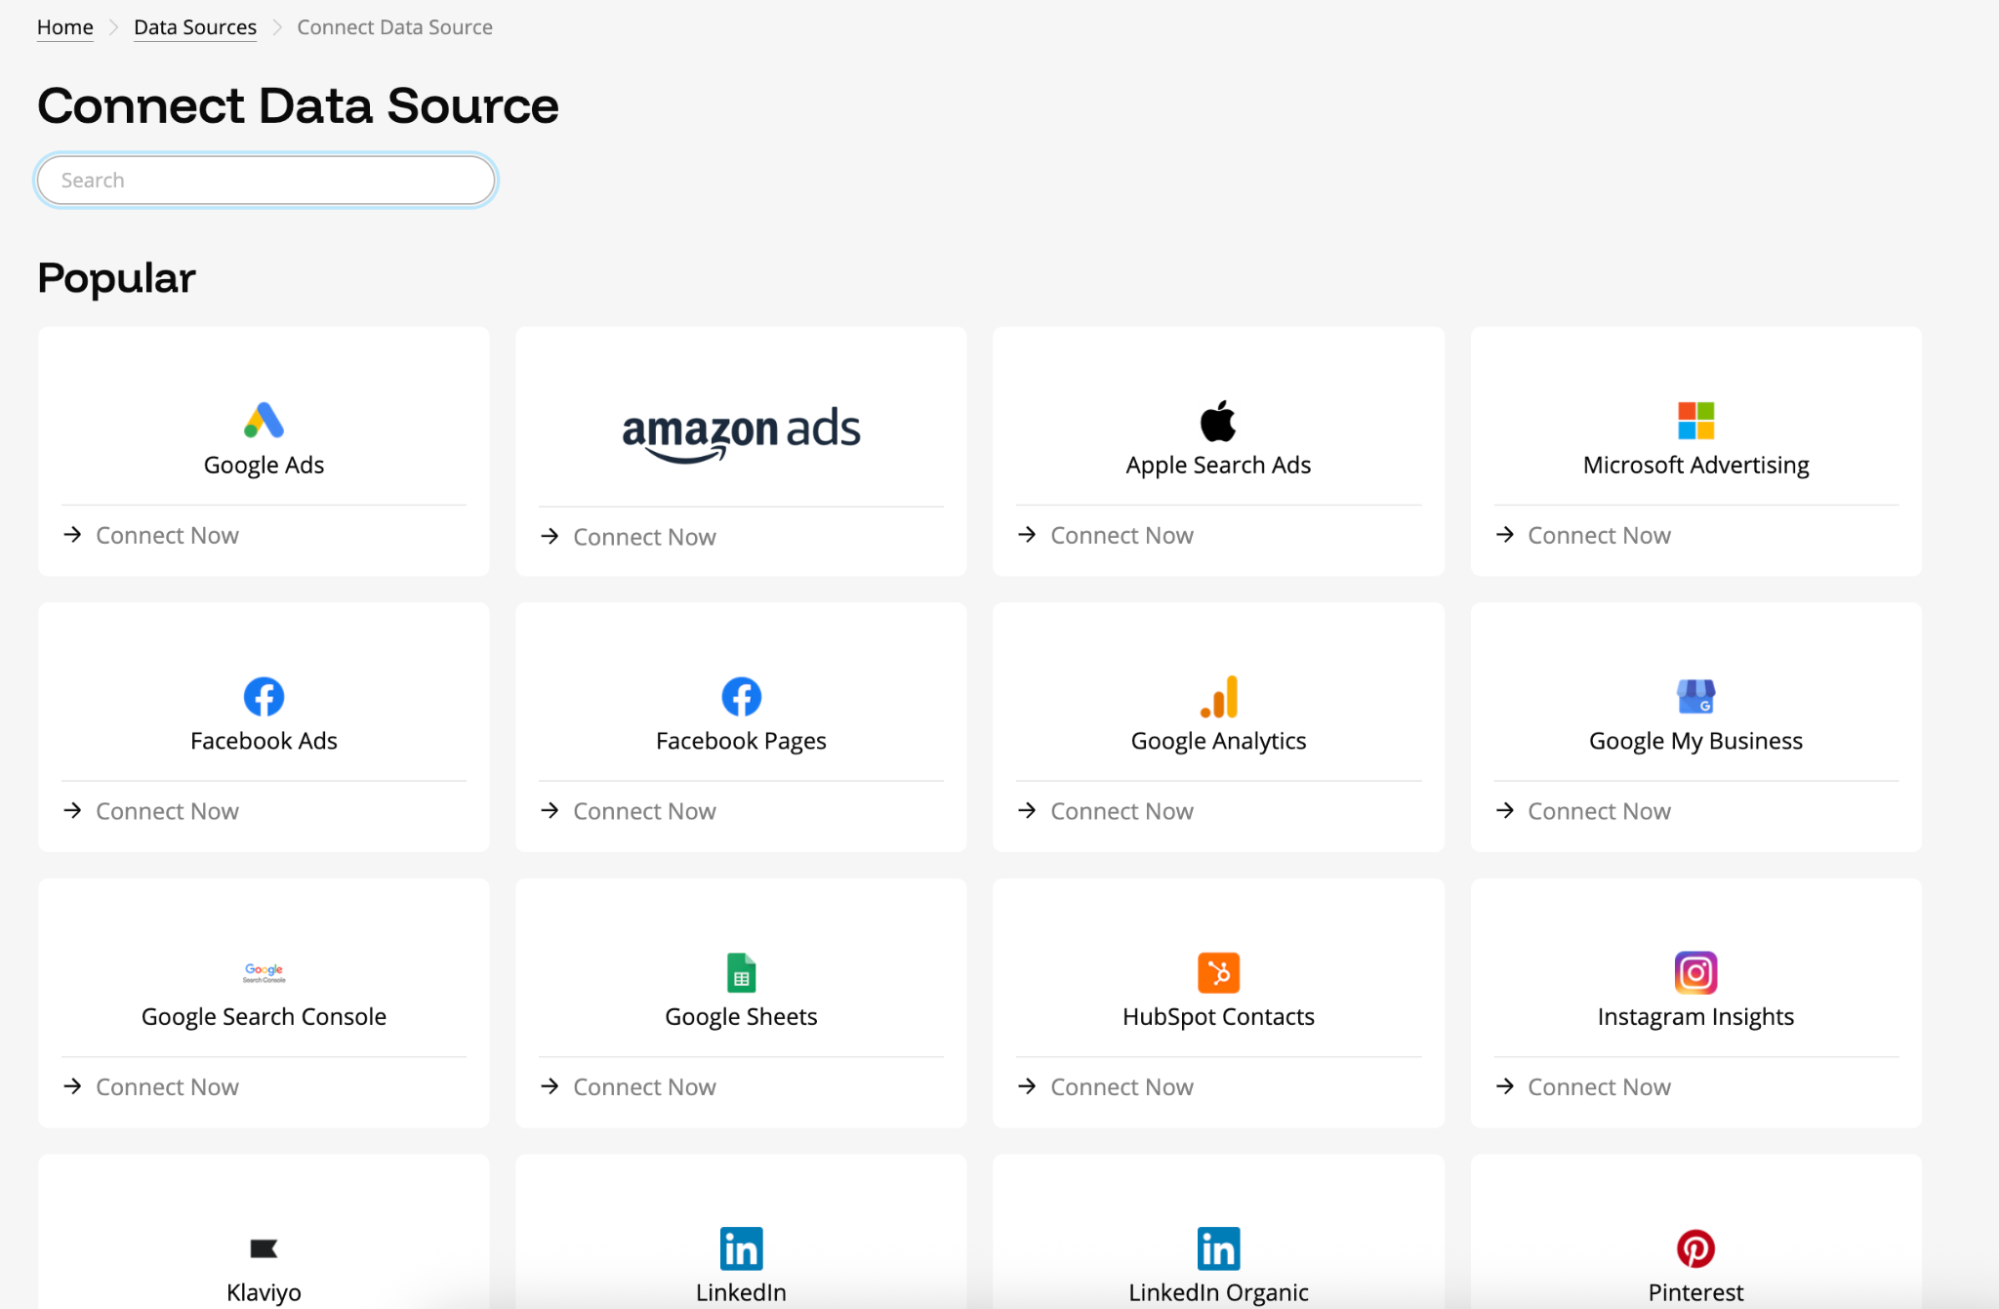
How many out-of-the-box integrations are there?
Funnel has a huge integration library—with over 500 connectors available in total—but the actual number you can use depends entirely on your pricing tier.
- Starter plan users get access to around 121 connectors.
- Business users can tap into 579 connectors.
- Enterprise tiers unlock up to 590+ connectors, including advanced and custom connectors.
 That’s a wide range—but not all integrations are created equal.
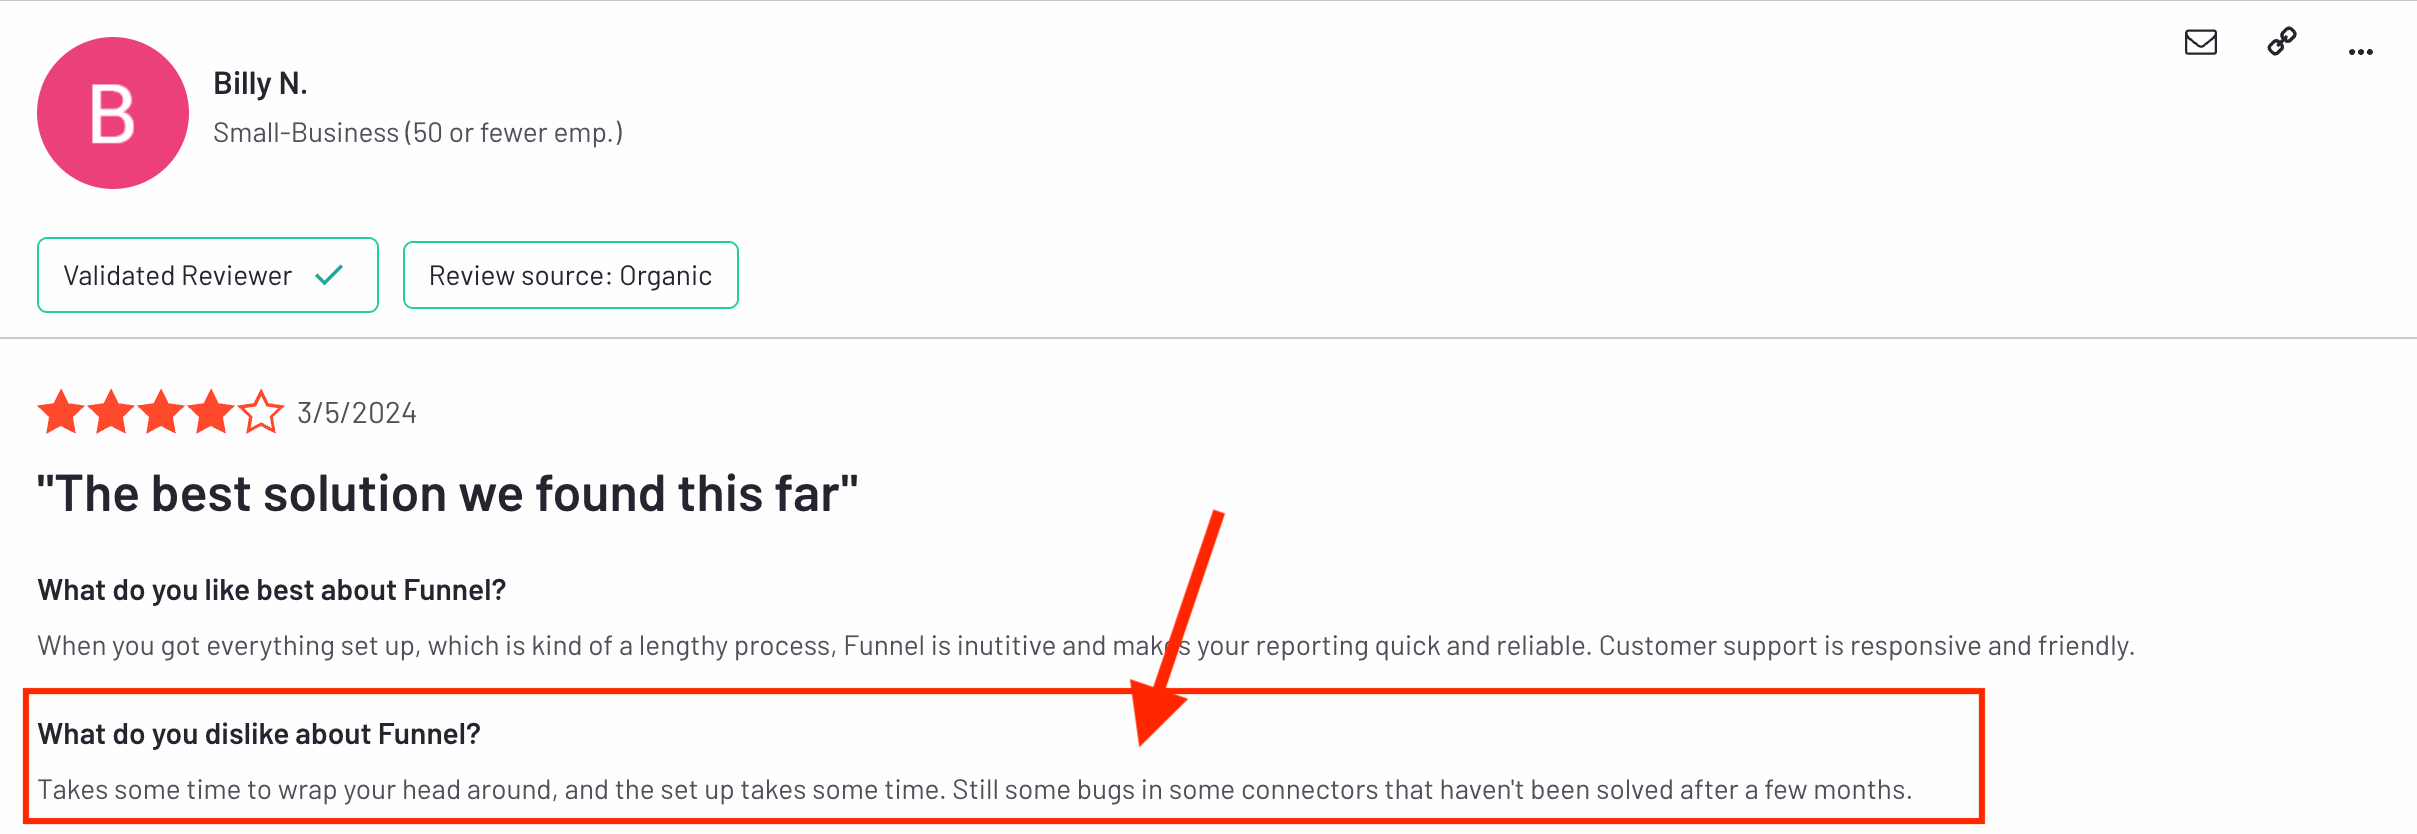
Some reviewers point out that certain connectors feel half-baked or incomplete, lacking key metrics or have “bugs…that haven’t been solved after a few months.”
How reliable are these connections day-to-day?
Does a high quantity of connectors always guarantee the quality and depth of data pulled from each and every one?
A Reddit user in r/PPC shares their disappointing experience with Funnel’s data pipeline: “Connections started failing repeatedly and the lack of reliability has become a real headache.”
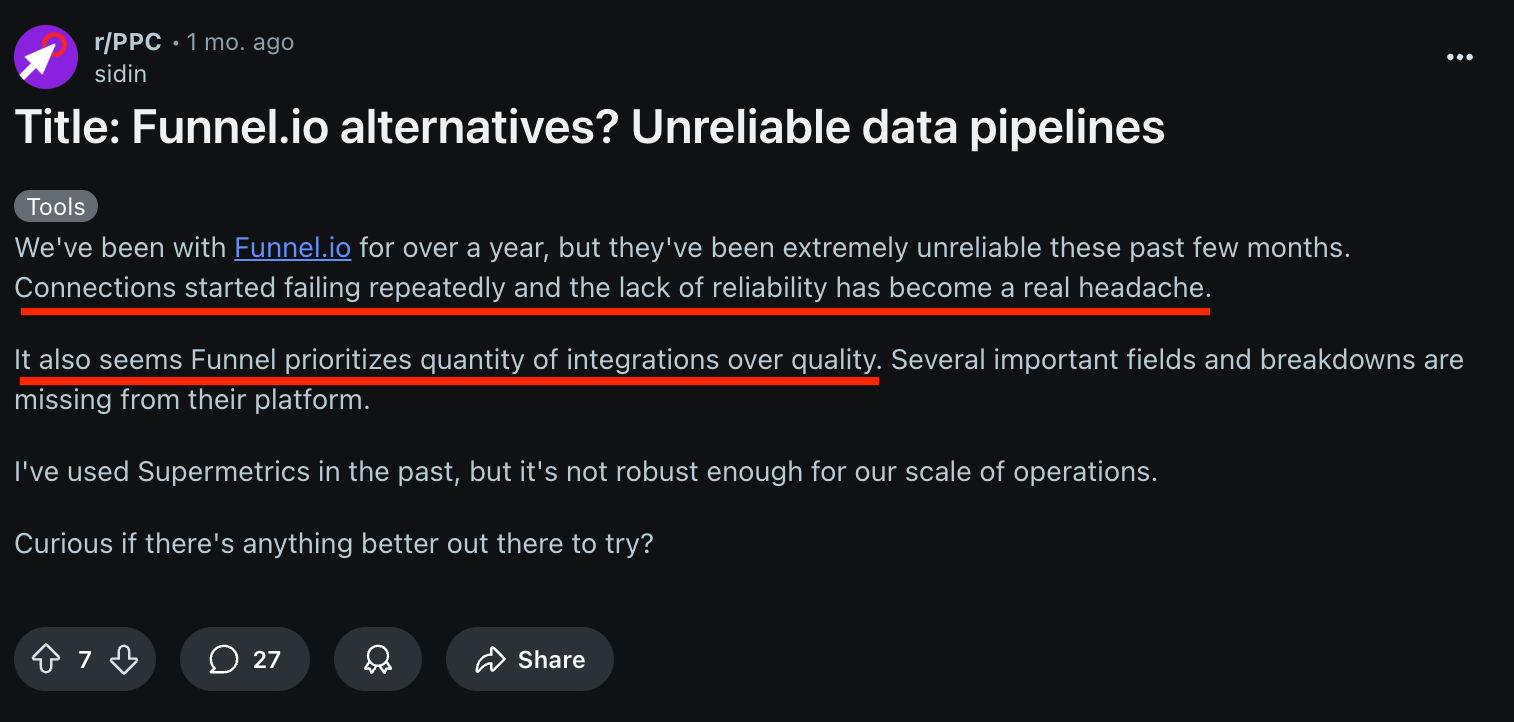 They also mention that Funnel seems to prioritize “quantity of integrations over quality.”
The Whatagraph advantage: We’re pretty proud of our 99.95% uptime guarantee. And if something does break, our Product Engineers get a Bat signal to fix it ASAP—even if it’s midnight where they are.
But what happens when a connection doesn't just falter, but disappears entirely, without warning? This takes the reliability concern to a whole new level.
In one instance, Funnel.io allegedly dismissed or deprecated essential connectors without any prior communication to its clients.
Imagine waking up one day to find a critical data feed for your business—or your client's business—simply gone. That’s what happened to David Cattaneo just last year:
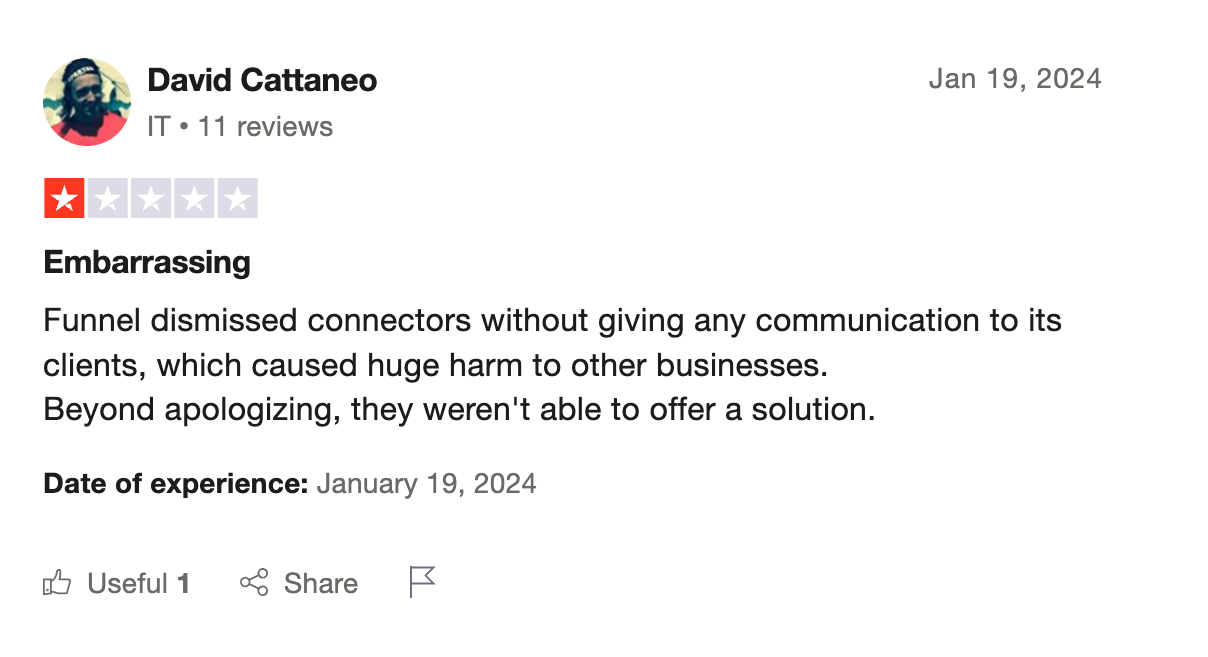
“Beyond apologizing, they weren't able to offer a solution.”
Can you really control your data flow?
Short answer: not really.
You can’t specify exactly how much historical data you want to import. Funnel often pulls two years of data by default, especially when you first connect a source, according to their documentation. That might sound convenient, but for larger clients with high data volumes, it’s a killer.
Especially because it takes a few minutes—not seconds, for even one data source to pull data.
 One agency reported syncs that took days to complete because Funnel was trying to ingest two years of Facebook Ads data all at once.
And even worse—you’re paying for all that excess. Because of Funnel’s "flexpoints," each excessive pull burns through your credits. No toggle, no filter, no easy fix.
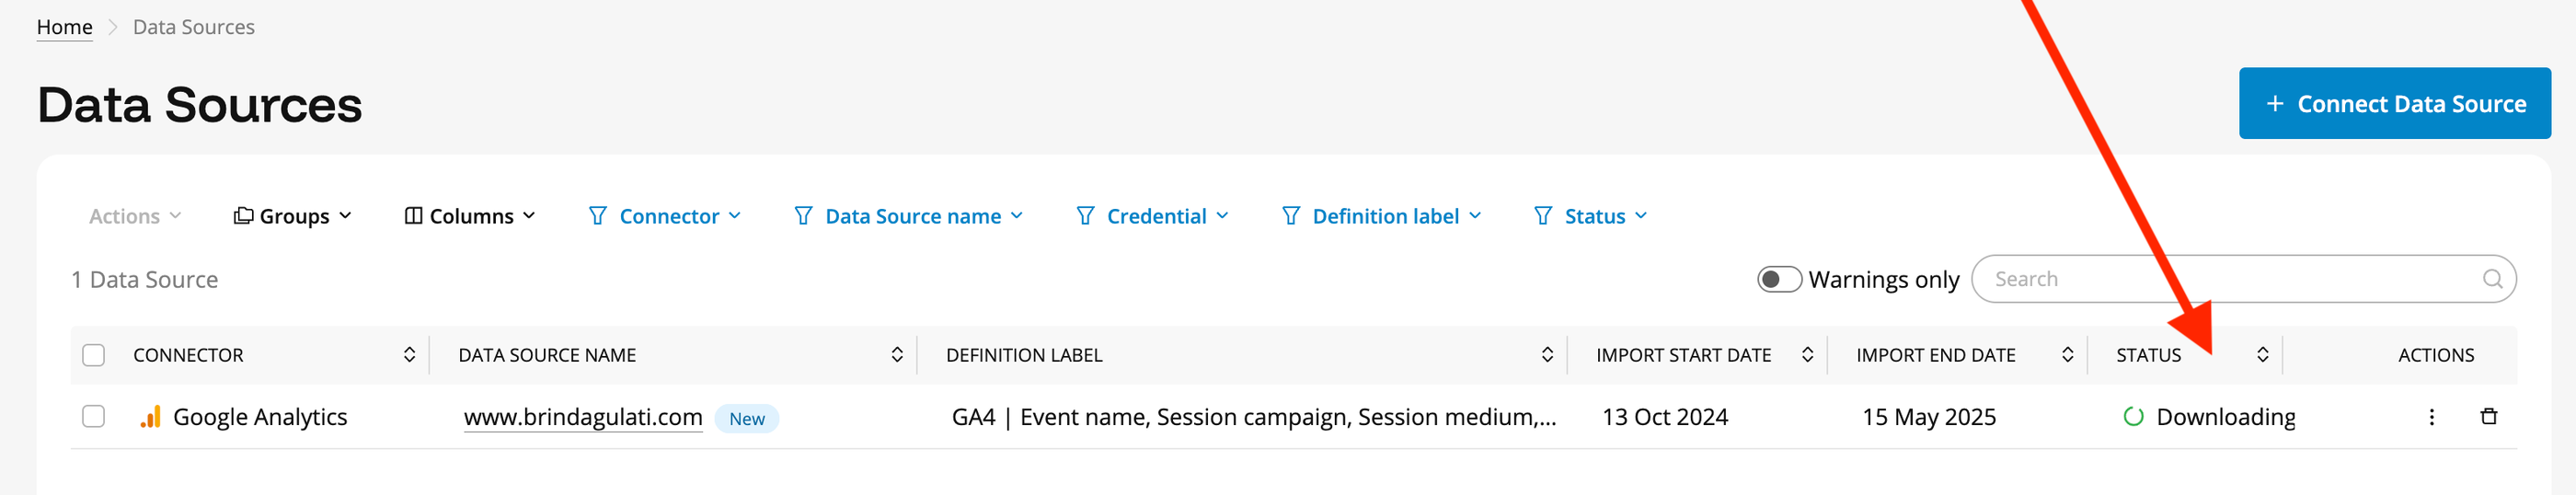
For example, I connected just one data source (Google Analytics) and it used up 205 out of 400 of my flexpoints on the free plan.
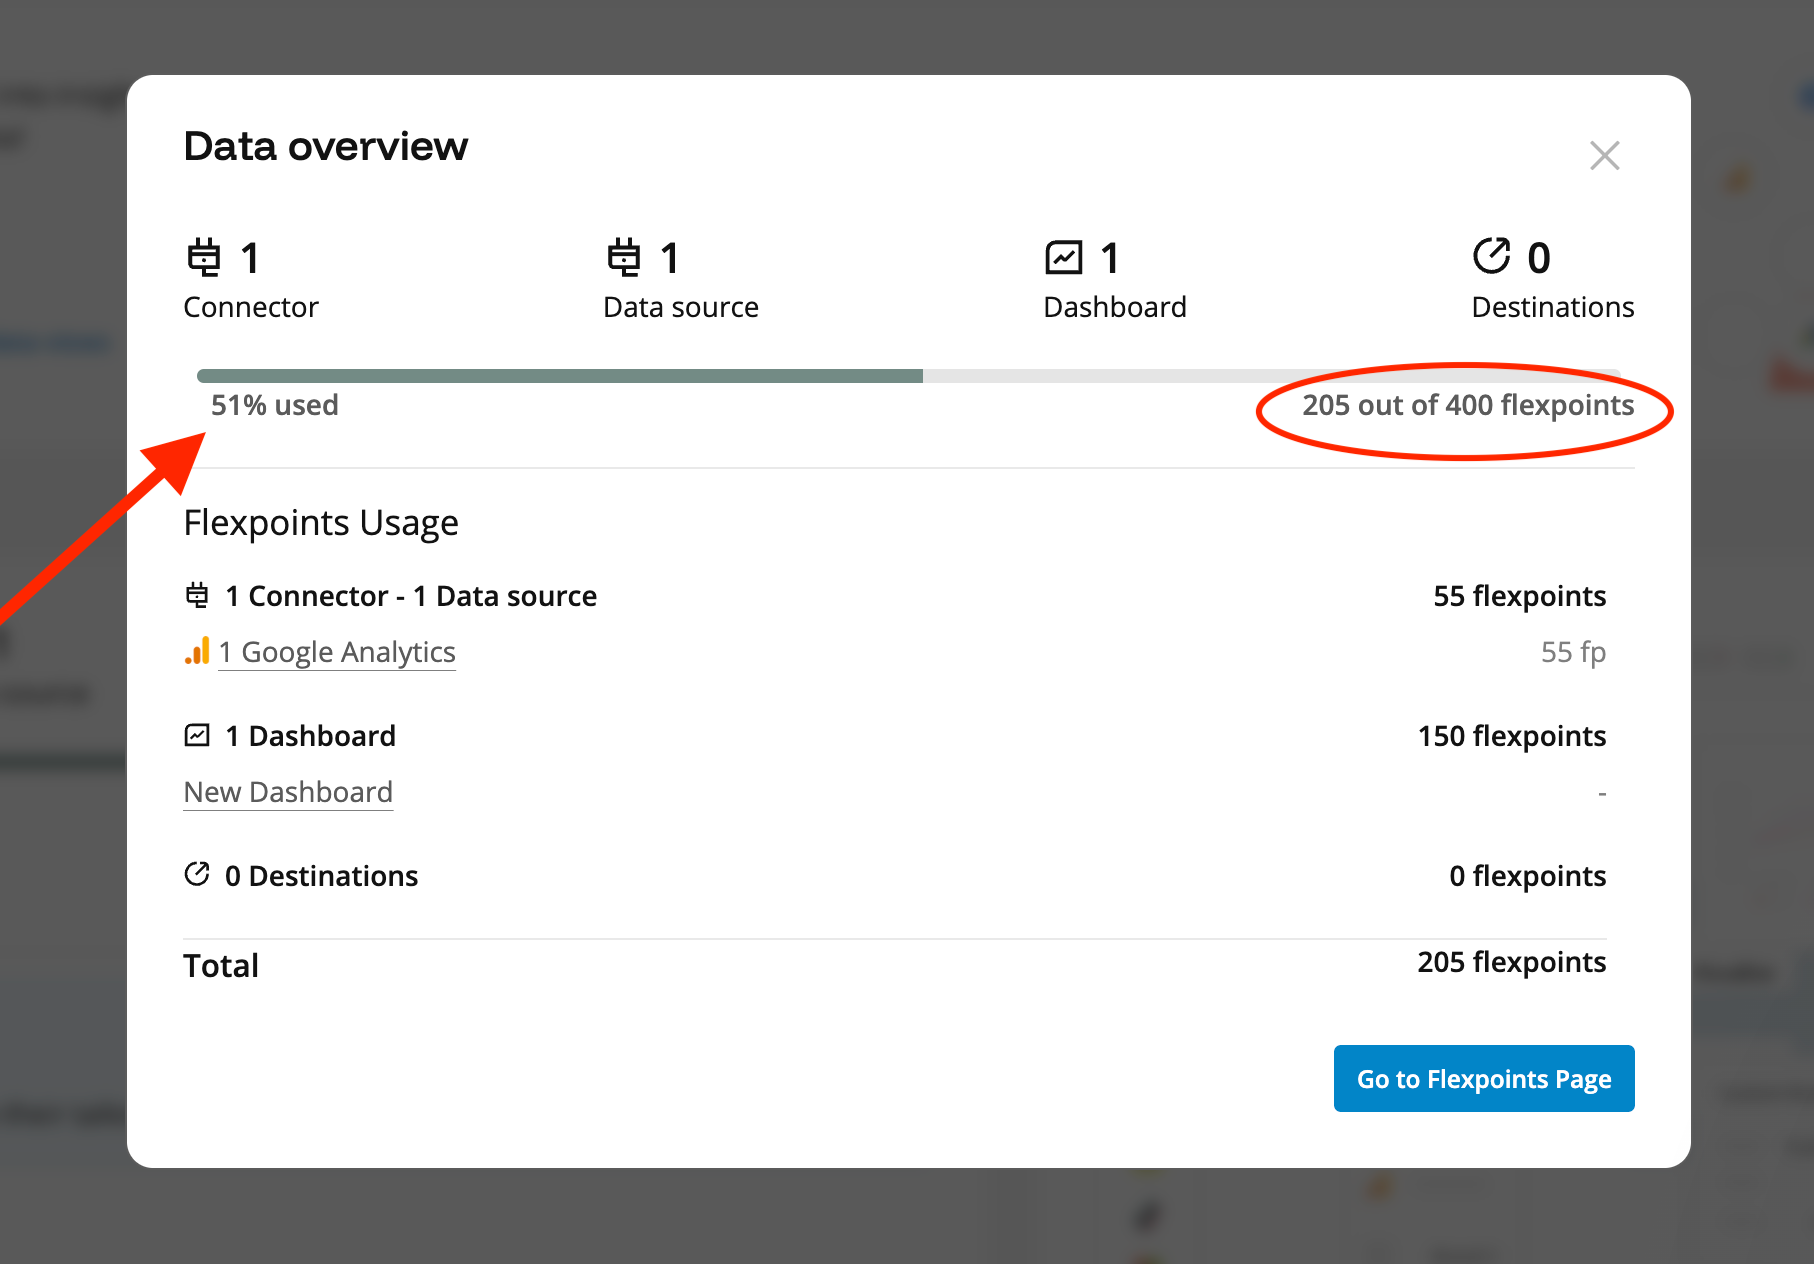
That’s one data source and one dashboard. Imagine how quickly a full-fledged marketing agency with multiple clients and potentially hundreds of data sources would burn through these.
Plus, they mention a “Flexpoint Rate Card” in their documentation, but nowhere do I see dollar signs to give me an indication as to what they might actually cost. Basically, you need to be on your toes, or your bill will give you sticker shock.
As Raphael V. on G2 notes: “...the incremental price increase makes it a bit harder to sell to our executives, and we need to continuously pause datasources if we no longer use them to save previous flexpoints.”
What about hitting platform quotas?
If you're pulling granular campaign-level data across multiple accounts, especially on platforms like Facebook, you can hit API quotas fast. Some users even reported ad account lockouts from over-pulling data, which stops campaigns in their tracks.
That’s not something Funnel advertises, but it’s definitely something users have had to work around.
For any marketing agency or marketer, an ad account lockout during a critical campaign is a full-blown catastrophe. Campaigns grind to a halt. Client trust evaporates.
Is all your critical data actually making it through?
Not always. Some key metrics—like "View Content" for Facebook Ads—simply don’t show up. Funnel pulls what it pulls, and it’s not always documented what’s missing.
That means you either:
- Revert to manual exports and uploads (which defeats the purpose of automation).
- Or accept incomplete reports and hope no one notices.
This brings us back to data completeness. When essential data is missing from the get-go, a cascade of problems follows, impacting everyone from the analyst in the trenches to the client signing the checks:
- Can you truly trust your reports? If you know certain key metrics are AWOL, or if there's a lingering doubt about what Funnel.io didn't pull, how much faith can you really place in the dashboards and reports generated downstream?
- What's the real cost to your team's time and agency's credibility? Your analysts, instead of focusing on high-value strategic analysis, are now burdened with detective work: identifying data gaps, patching reports with manual exports, or trying to explain to stakeholders why certain numbers just aren't there.
For agencies, presenting reports based on known (or suspected) incomplete data is a risk to your reputation as data-driven experts.
When your needs shift or grow, how transparent and adaptable is Funnel.io's data model?
Funnel’s data model is rigid.
Fields are mapped as-is, with limited ability to blend, rename, or standardize across sources. Unlike tools that offer custom dimensions and metric formulas, Funnel expects you to take the data as it comes—or fix it elsewhere.
This "fix it elsewhere" approach translates directly into a mountain of extra work. Imagine your Facebook Ads campaign names are “FB_Campaign_SummerSale_2025” and your Google Ads names are “Google_Summer_Sale_Campaign_25.”
If you can't easily standardize these to a single "Summer Sale 2025" dimension within Funnel.io, your analysts are now forced to perform this painstaking data janitorial work manually in Looker Studio, Tableau, or spreadsheets.
And the ripple effects are significant.
That extra downstream work for analysts means reports take longer to arrive, potentially missing crucial decision-making windows. The increased risk of manual errors in the BI tool due to complex transformations means you might be looking at reports you can't fully trust.
What an all-in-one alternative can offer instead:
With a platform like Whatagraph, you can:
- Stop wrestling with data pulls: Get pinpoint control over data date ranges and filters from the get-go, eliminating costly overages and frustrating sync delays before they even start.
- Access all your critical data, reliably: Lean on fully managed, native connectors for deep, comprehensive data from every major platform, with the flexibility to incorporate custom metrics when standard fields aren't enough.
- Keep your ad accounts safe and marketing campaigns live: Benefit from expertly maintained, in-house connectors proactively designed to respect platform API quotas and shield you from account lockouts.
- Get data that’s instantly report-ready, no "fixing it elsewhere": Effortlessly create unlimited custom dimensions and sophisticated data blends directly within the platform, guaranteeing your information is clean, complete, and perfectly structured for immediate insights.
Funnel.io boasts many connectors, but beware: full access costs more, and users often struggle with unreliable data and key information going missing.
Funnel.io Deep Dive #2: UX and Usability
For a tool that handles something as complex as data transformation, how does Funnel.io actually feel to use day-to-day?
Does it empower your whole team, or just a select few data experts?
Is the interface intuitive and modern?
While Funnel.io's marketing often highlights ease of use, and some technical users find it straightforward for specific data ingestion tasks, a significant portion of user feedback points elsewhere.
Lauren D. on G2 says: “There is a decent learning curve to using Funnel. I wish it were more intuitive to just pick up.”
In my one week of trialling the platform, I had to keep going back to help documentation to verify if I’m actually using it correctly.
I found the lack of contextual, in-platform guidance really frustrating especially for pages like “Views,” where you see a lot of nested menus. Information overload.
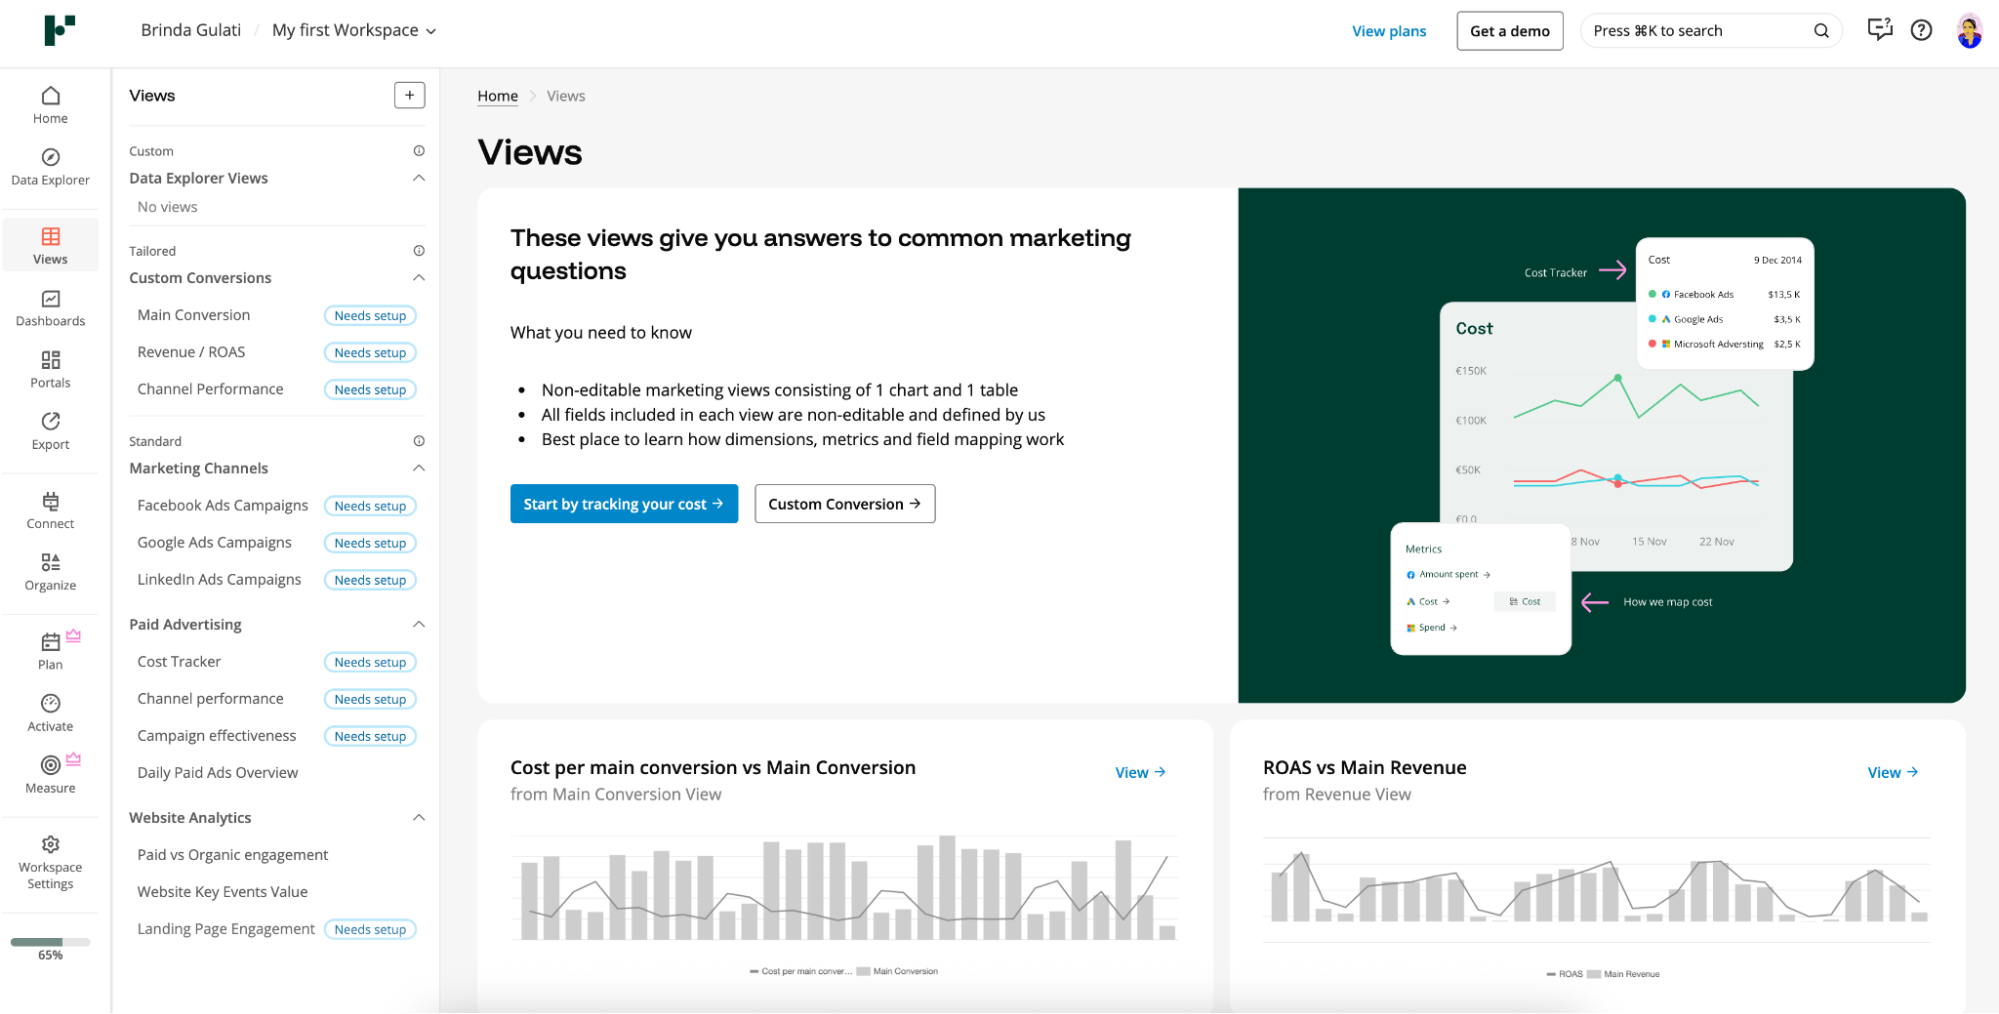
This becomes especially problematic for agencies, where cross-functional teams need to be able to jump in and out of the platform. A junior account manager won’t survive five minutes in Funnel without help.
The interface isn’t exactly “modern” as well—especially if you compare it to a tool like Whatagraph.
Funnel’s UI hasn’t seen significant usability upgrades in years, and it shows. Button placements, menu logic, and overall dashboard layout feel dated. For users accustomed to cleaner, more intuitive software experiences, Funnel can feel clunky—rigid, even.
And that visual clunkiness adds friction.
When you’re already dealing with a complex data flow, the last thing your team needs is to waste time figuring out how to navigate the tool itself.
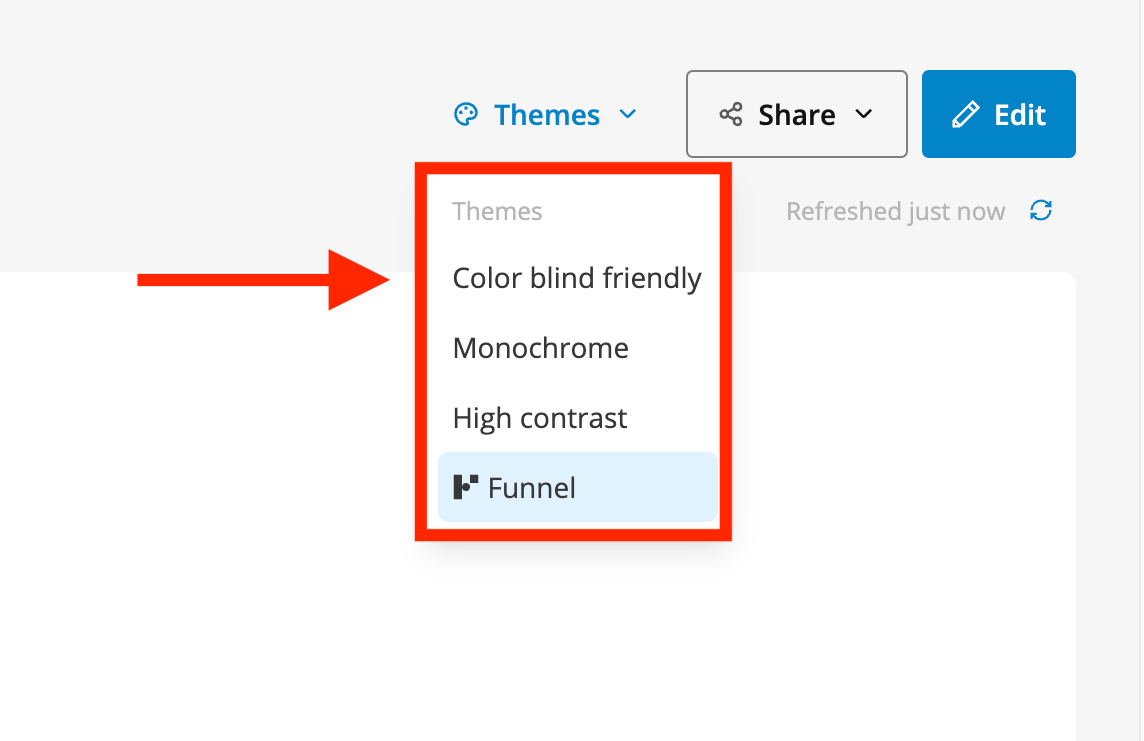
I do, however, appreciate that it includes “color blind friendly” and “high contrast” options to make it more accessible to visually-impaired users.
Is it truly beginner-friendly for everyone on your team?
We aren’t talking about general hand-holding. Specific, everyday data tasks can become surprisingly complex.
Take joining data from different ad accounts or platforms into one unified table—a fundamental step for seeing the full marketing picture.
A verified user on G2 flags this as a key hurdle, noting you ”can’t really join different source and create a single data table, making it somewhat confusing.”
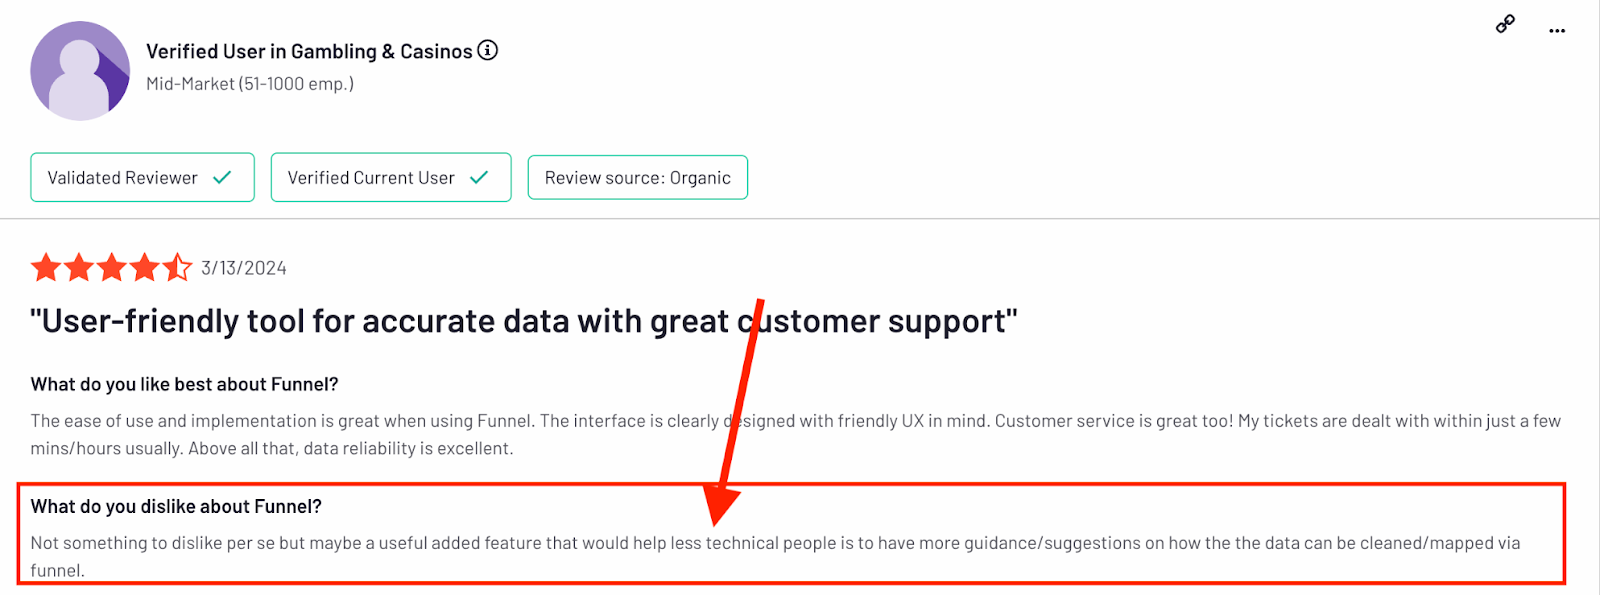
Another verified user, who although praises Funnel.io for being user-friendly still says: “maybe a useful added feature that would help less technical people is to have more guidance/suggestions on how the the data can be cleaned/mapped via funnel.”
This effectively puts comprehensive analysis out of reach for anyone who hasn't climbed Funnel.io's steep learning curve or doesn't have a data engineering background.
What you won’t need to worry about with an all-in-one platform like Whatagraph:
- Fighting with an outdated or confusing interface: You'll get a genuinely modern, clean, and intuitive platform that’s regularly updated with marketers like you in mind. Think clear menus, easy-to-find features, and an experience designed to make your workday simpler, not more complicated. It’s built for marketing teams, not just data engineers.
- A massive learning curve: Whatagraph is built so your entire marketing team can actually use it from day one. You can get your first report looking great in just a few minutes, not weeks of training. You don’t need advanced coding skills or a data science degree—just your marketing know-how.
- Reporting bottlenecks: Imagine your account managers quickly tweaking a client's report, or a new intern confidently adding a new chart to a dashboard. With simple, intuitive tools like drag-and-drop, everyone on your team can easily create and edit reports, making data accessible to all.
This G2 user attests to how easy to use Whatagraph is:
Whatagraph is an extremely user-friendly reporting tool that helps us communicate the key aspects of our clients' digital marketing in practically real-time. It is quick to use, and building new reports is effortless.
Here’s how easy it is to build your first report with Whatagraph:
Funnel might be fine if you have a dedicated data team. But if you’re hoping for a tool that the entire team can use confidently—from interns to client leads—this isn’t it.
Funnel.io Deep Dive #3: Visualization and Reporting
Funnel doesn’t do reporting. It prepares data for reporting. And that gap creates a cascade of new challenges.
Can funnel dashboards actually impress your clients?
As they've acknowledged, their own native "Funnel Dashboards" are basic and "aren’t some kind of Tableau or Looker Studio killer—at least not yet.”
While their internal dashboards might serve for quick data checks by those already deep in Funnel's backend, they're rarely the polished end-product you'd proudly present externally.
I echo that it’s basic because it prioritizes function over communication—and that’s often the difference between a data tool you use and one you rely on to prove value.
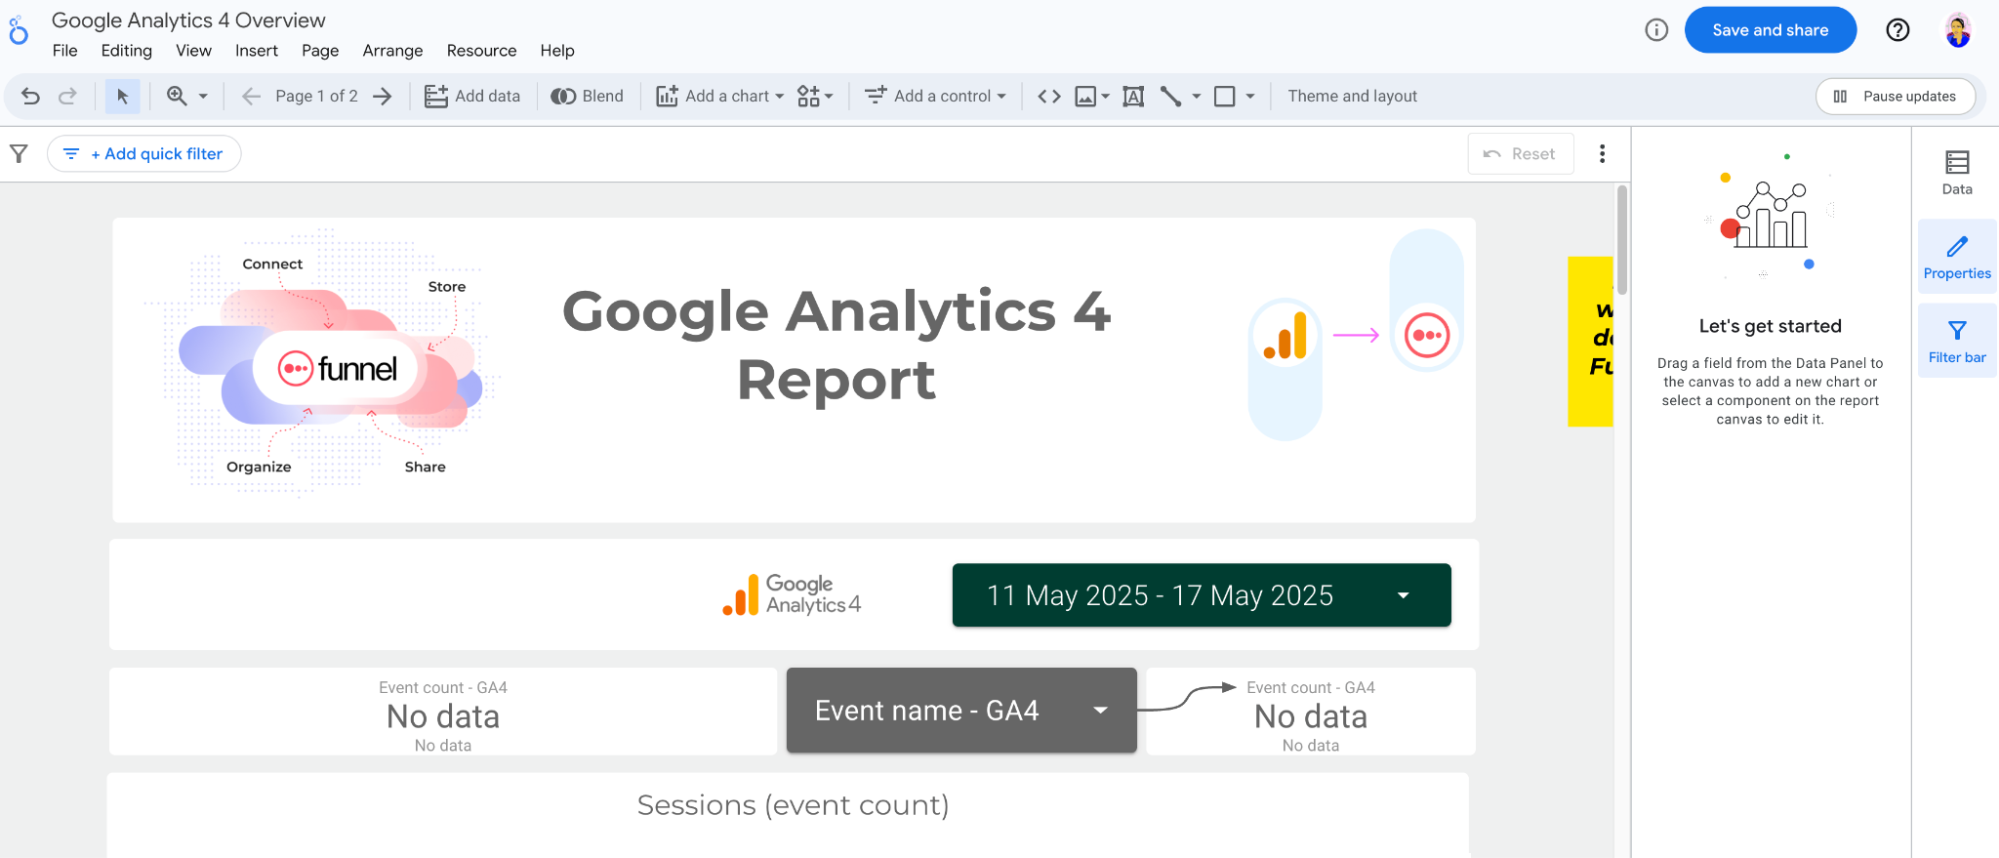
Let me show you what I mean:
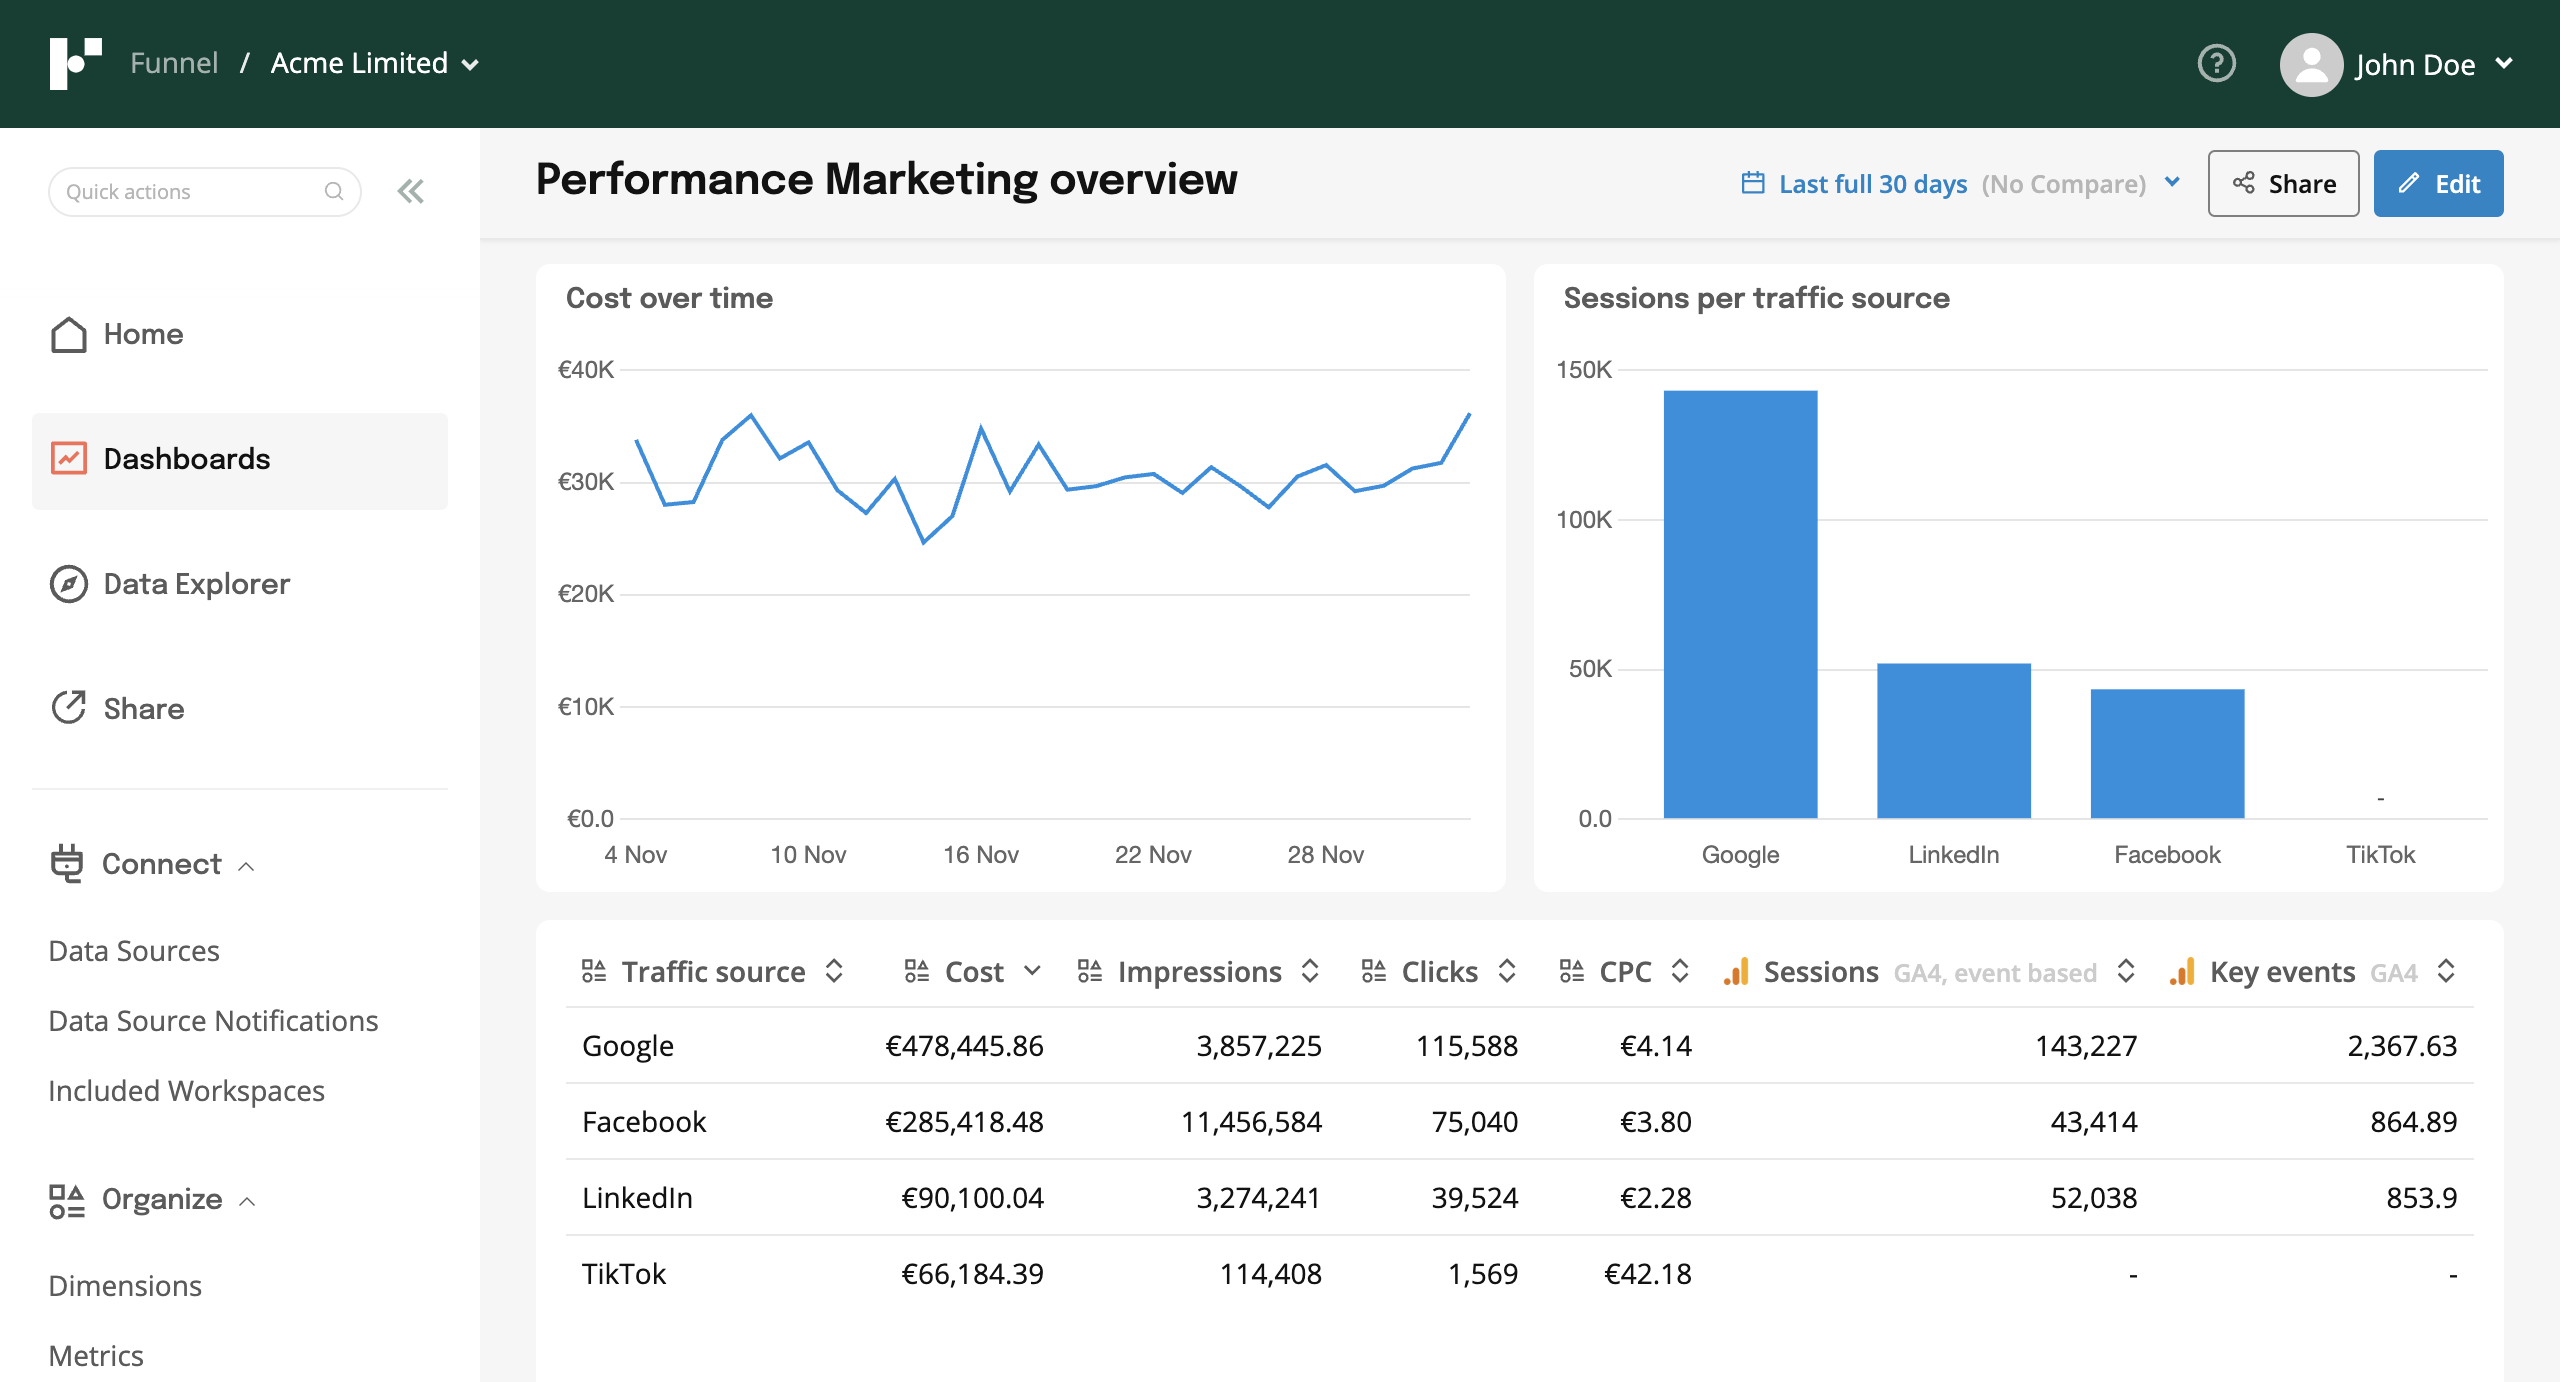
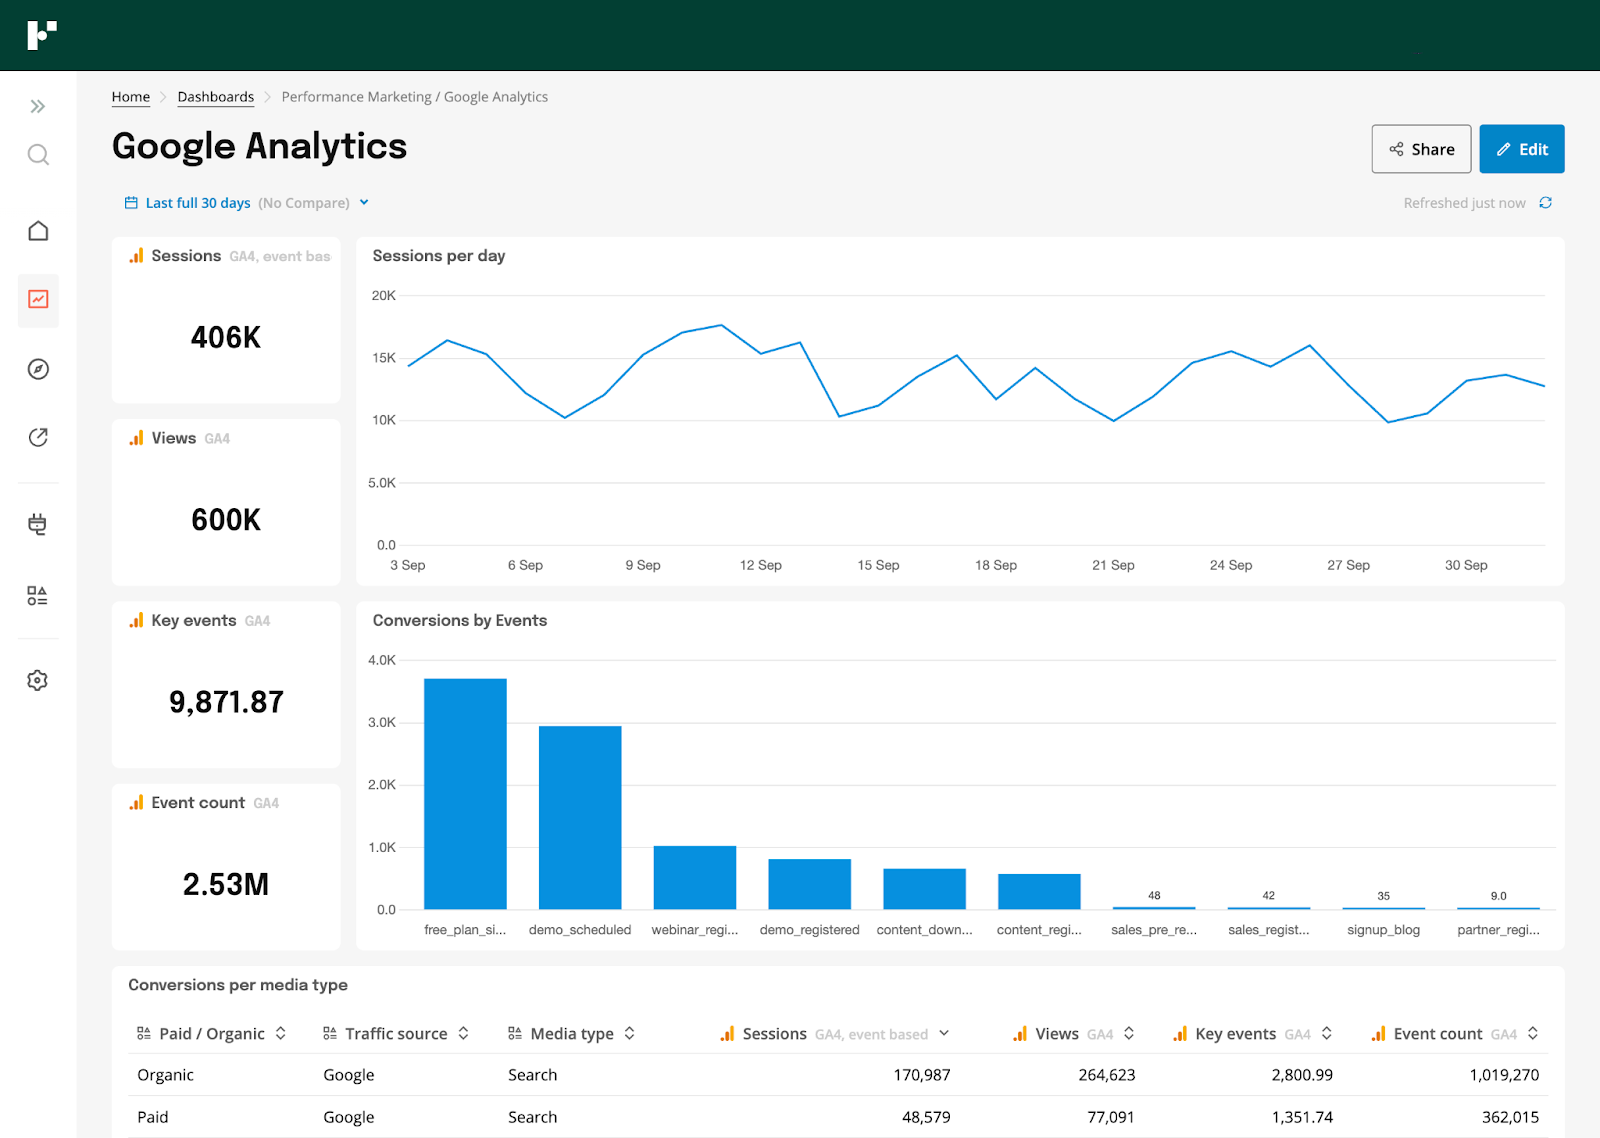
With the Funnel Dashboard, you've got your KPIs—Sessions, Views, Key Events—a trendline for sessions, a bar chart for conversions by event, and a data table. It displays key numbers.
Clear enough for a daily check-in.
But let's put on our "C-Suite presentation" hat. Suddenly, "functional" isn't enough.
This is where the "basic" label sticks, and here’s why:
1. Where's the story, the "so what?" The Funnel dashboard presents data points. But client reports need a narrative. They need insights, explanations for why numbers are up or down, and clear recommendations. There’s no room here for that crucial qualitative layer, the strategic thinking that turns data into actionable intelligence.
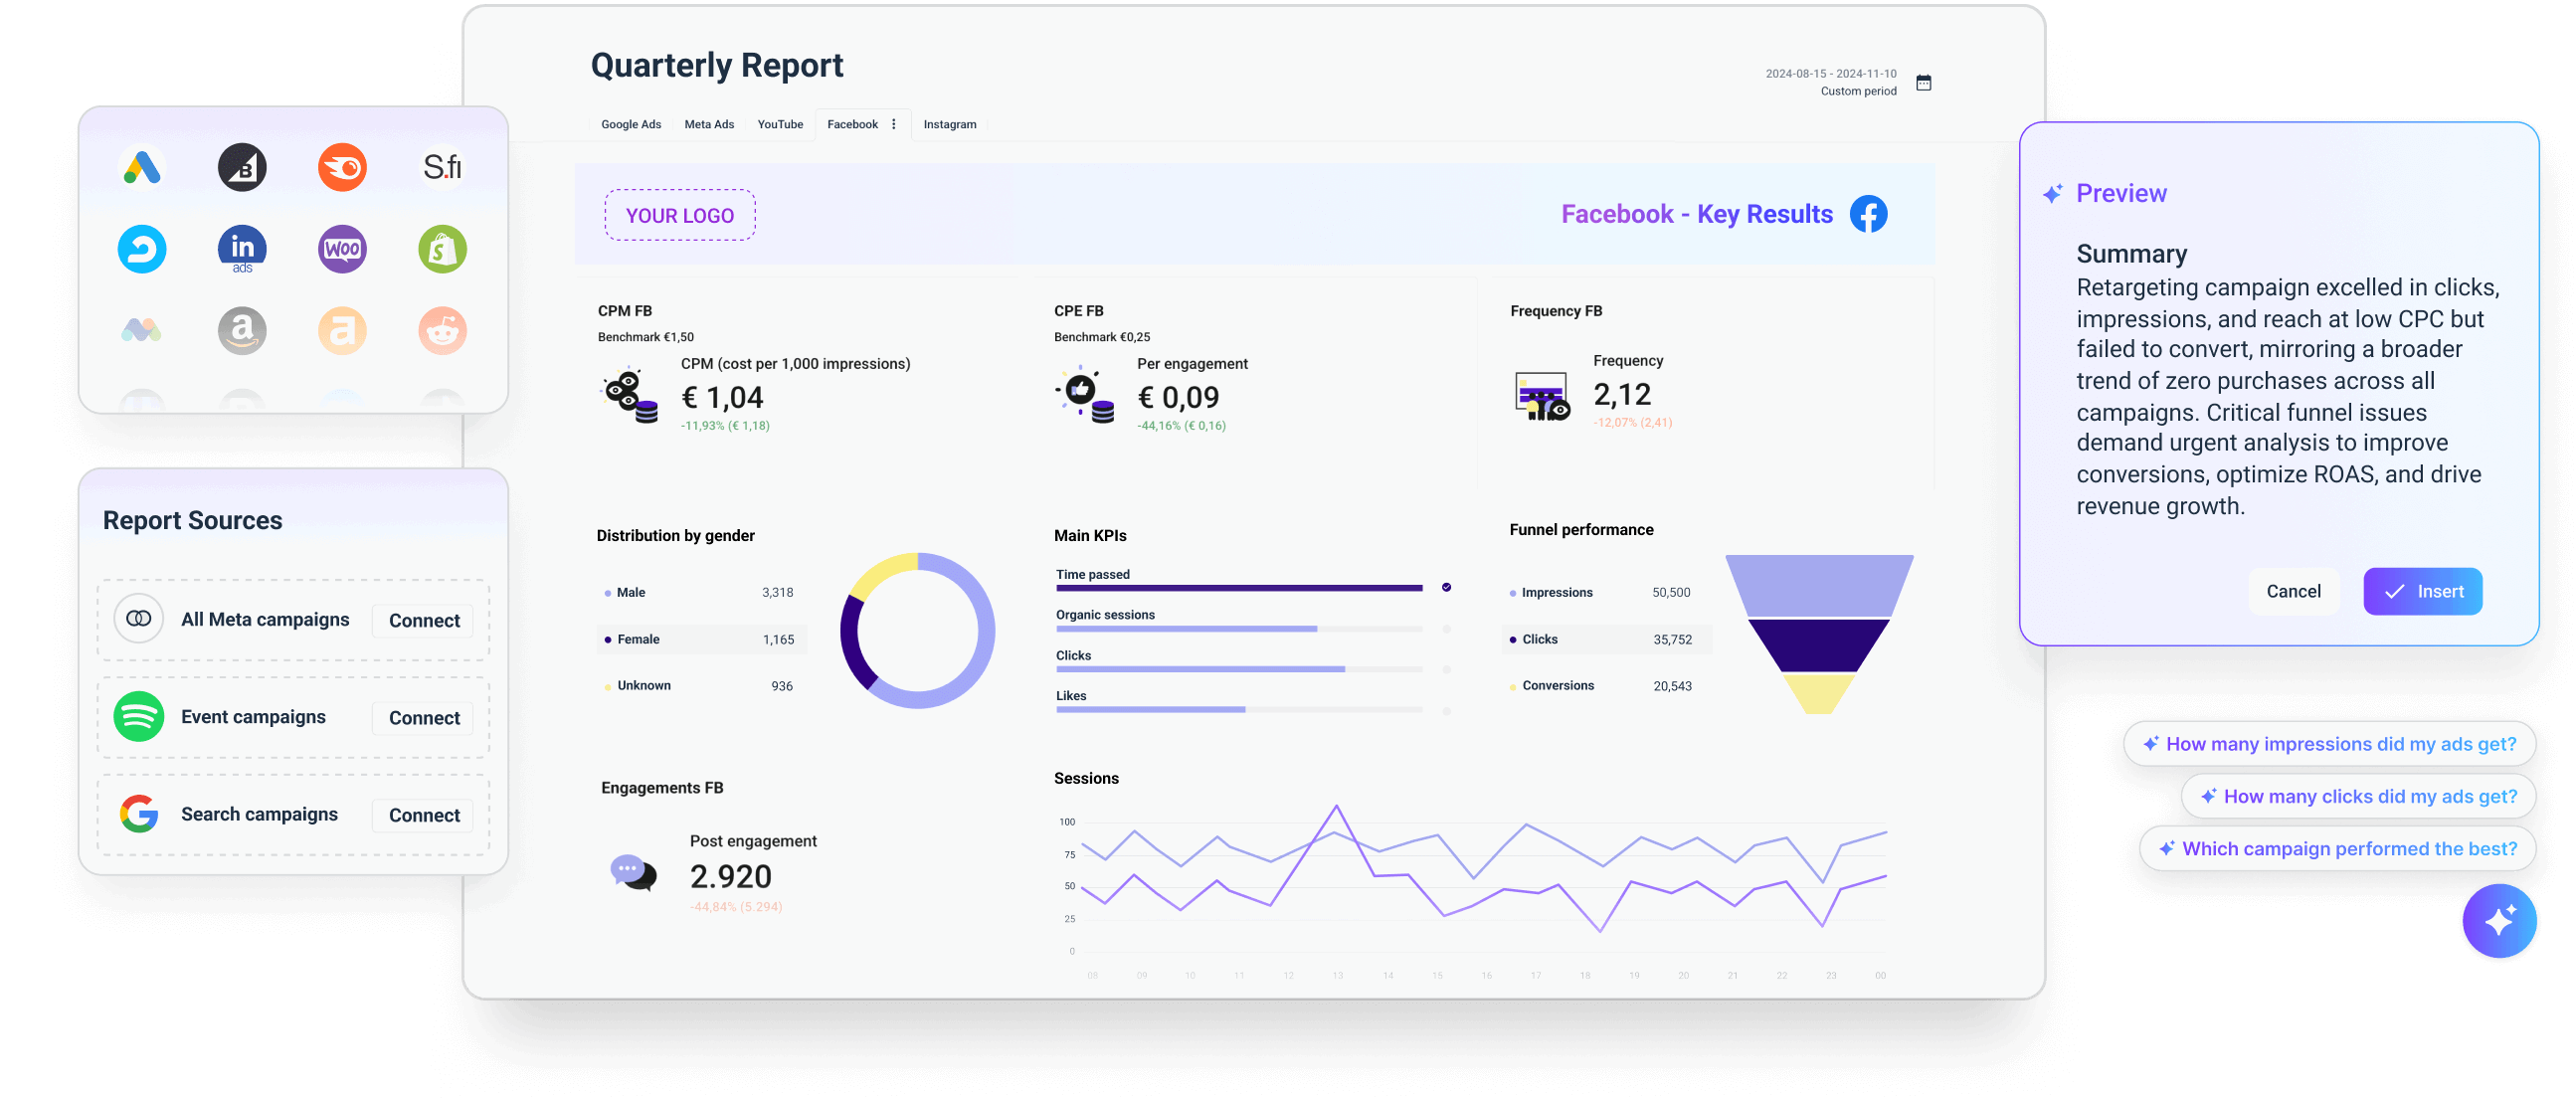
The Whatagraph advantage: Whatagraph empowers you to move beyond just presenting numbers to actually explaining the "why" behind them.
You can:
- Use flexible text box widgets directly on your reports to explain what the data really means—summarize key results, spotlight emerging trends, or flag critical changes that demand client attention.
- Generate AI summaries so you have a strong starting point, helping you turn raw numbers into a clear story your clients will actually understand.
 2. Is it visually compelling or just...data on a screen? The charts and layout are very standard in the Funnel dashboard—they do the job, but they don't look special. Can you control all the small design details like colors, fonts, and placement to create a unique brand style? Not really.
The Whatagraph advantage: Instead of just functional, you get finesse:
- An easy drag-and-drop way to design, using lots of modern charts and tables. For example, you can style tables with helpful features like summary rows for totals or zebra stripes for easy reading.
- Resize and reposition every single widget—charts, tables, text boxes, images. Need to make that crucial KPI scorecard bigger? Want to fit three key charts side-by-side? You decide.
- Choose your perfect view—Portrait mode for PDF-friendly reports or Landscape for screen presentations with minimal scrolling. Switch layouts anytime.
Can you customize and white-label reports without jumping to another tool?
Can you fully brand those outputs with your agency's distinct identity—your logo, your exact brand colors, custom domains for shared links—in a way that looks effortlessly professional?
Generally, no.
Unless you shell out top dollar on the Business or Enterprise plan, according to Funnel. If you’re on their Free or Starter plan, your reports will show their branding by default, not yours.
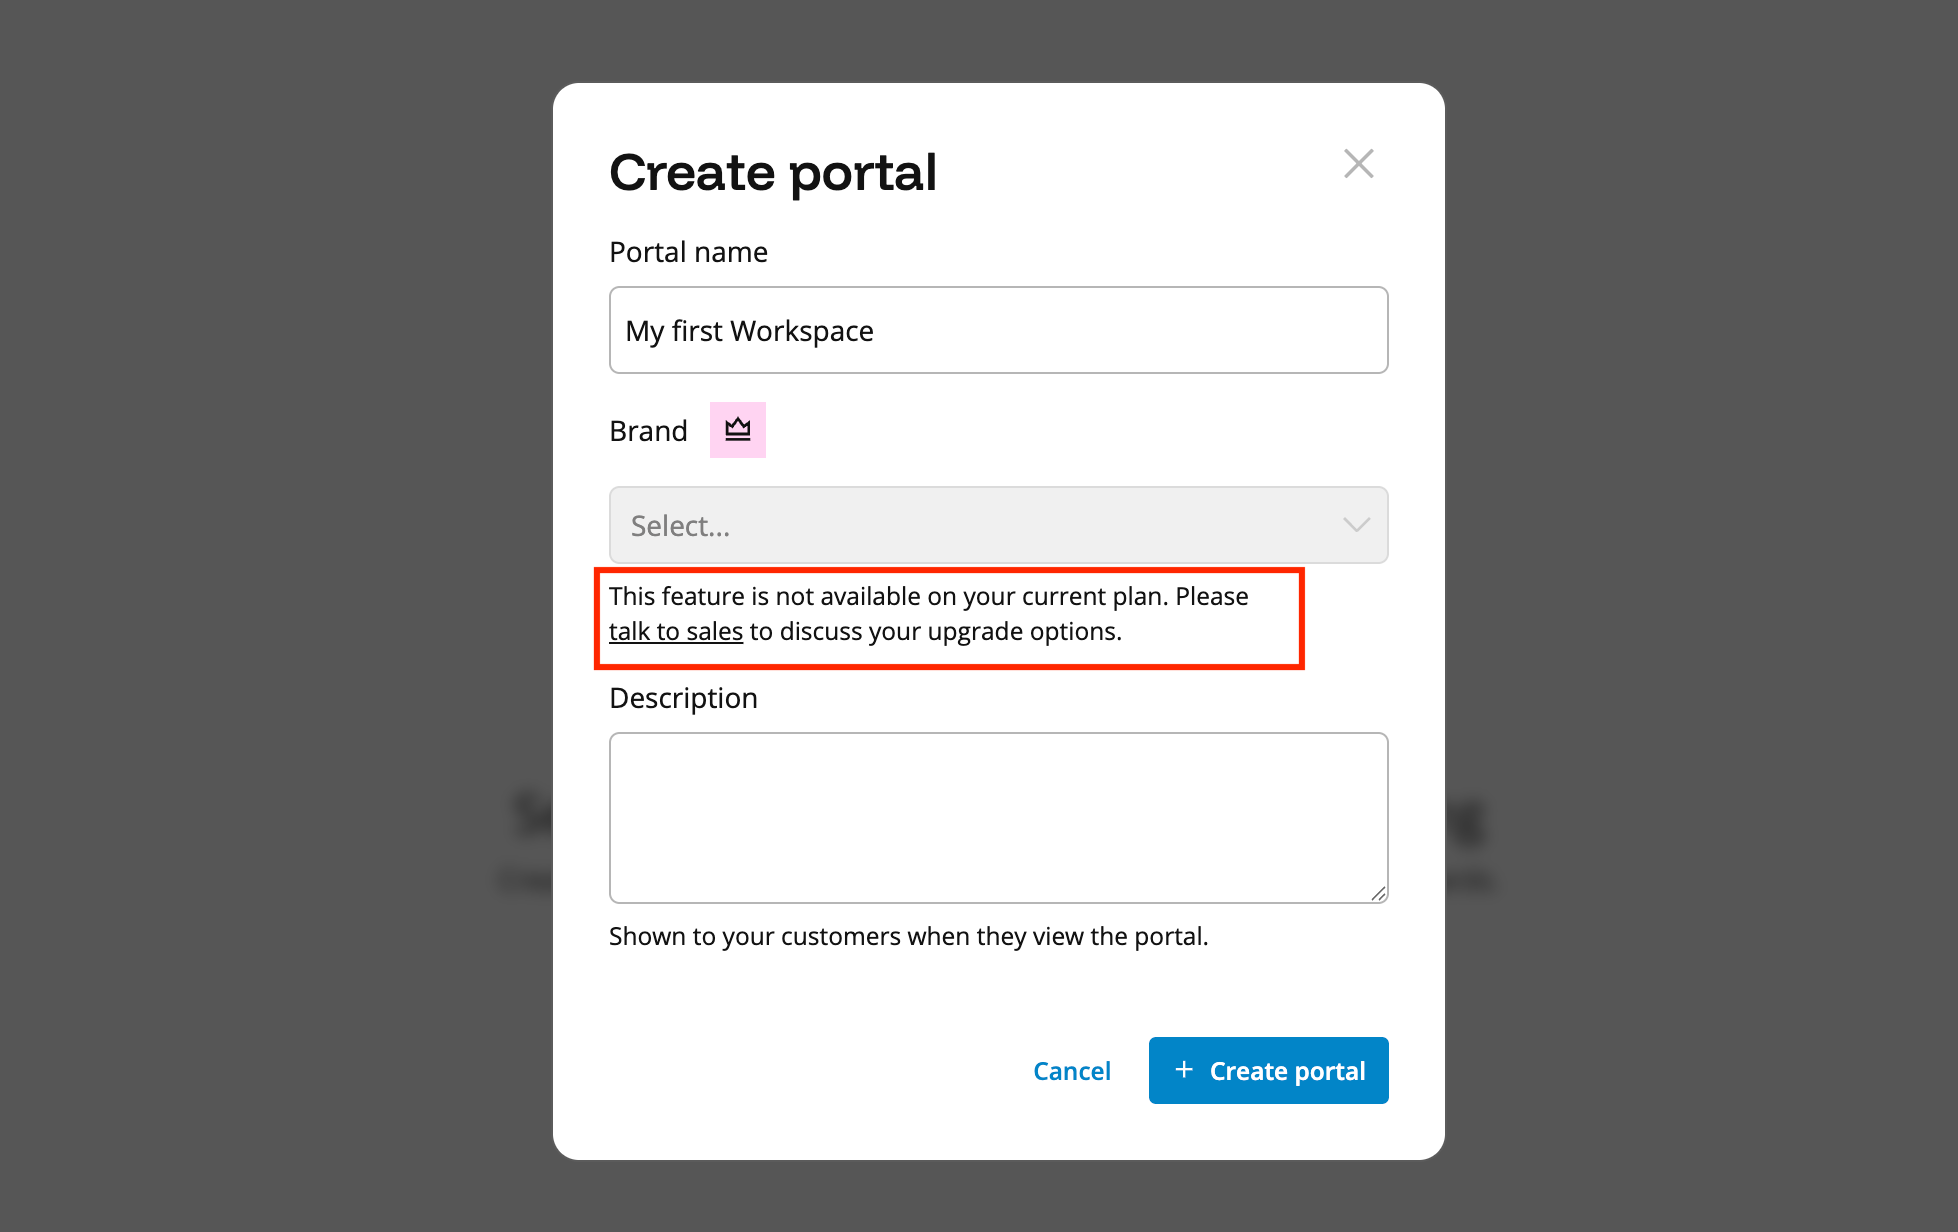 This stark reality forces most teams to rely entirely on their external BI tools for any meaningful visualization and report branding.
You're right back in that often unstable, invariably more costly, fragmented "two-tool Frankenstein.”
The Whatagraph advantage: We know how important it is for your reports to look like yours—so we don’t gatekeep white-label features behind expensive plans:
- Set up your global branding theme once—your agency’s exact colors, logos, and preferred style—and Whatagraph makes sure all new reports automatically inherit these settings.
- Apply your main branding at the global team level for consistency, make specific tweaks at the individual report level for unique client needs, or even fine-tune details down to the widget level for that extra touch of polish.
- Dig into the "Custom Branding" settings to easily edit color palettes, upload logos, and even style your automated report emails. Whatagraph's custom domain feature means instead of clients seeing a whatagraph.com URL, they’ll see your reports on a link like reports.youragency.com.
Funnel gets your data in but doesn’t help you get it out in a way clients will love. You’ll need a second tool to build, brand, and send reports. That means more work, more cost, and more room for errors.
Funnel.io Deep Dive #4: Daily Workflows and Customer Support
This is your daily reality. Your workflow is split:
- Configure and manage data connections and transformations in Funnel.io.
- Build, customize, and manage your actual reports and dashboards in Looker Studio (or other BI tool).
That means more moving parts, more time spent troubleshooting, and more things to go wrong.
So, what kind of safety net does Funnel.io offer, especially when it's only one piece of your reporting puzzle?
Can you do end-to-end marketing analysis in a unified workspace within Funnel.io?
Spoiler: No.
Funnel.io doesn’t offer native, full-featured reporting or dashboarding built for strategic insight. You’ll need a second tool for that.
And this is where it gets annoying.
I configured Looker Studio as my dataset destination, and now I have two different tools in two tabs open in front of me—when really, I just wanted to create one report.
Now imagine this workflow mushrooming across several clients and several dashboards. Daily.
You're then dealing with two platforms: two learning curves, two sets of potential bugs or limitations, and often two subscription costs (Funnel.io + any premium BI tool licenses, or the "cost" of developer time for open-source BI tools).
Welcome back to the “two-tool Frankenstein.”
That constant context-switching, that mental gear-shift between Funnel.io’s data logic and your BI tool’s visualization logic, chips away at focus and adds friction where you want flow.
So, the question is: how much time are you spending coordinating tools vs. creating insights?
When two systems don't talk to each other natively, every task becomes a mini project:
- Sync a field in Funnel.
- Validate it in Looker.
- Explain to the client why a widget looks “off.”
- Chase support on two platforms when something breaks.
This overhead adds up—fast.
What’s the alternative?
Meet Whatagraph. (Again—properly this time.)
Whatagraph is an all-in-one solution: ETL (Extract, Transform, Load), visualization, automation, and sharing—everything lives in one platform.
Here's how Whatagraph works to simplify your data:
- Connect: In just a few clicks, hook up all your disparate marketing channels and data sources. Then, watch your data flow in automatically, consistently, and reliably.
- Organize: Effortlessly blend data from multiple sources, create powerful custom metrics that reflect your unique business logic, and define clear dimensions—all without writing a single line of code.
- Visualize: Use Whatagraph's intuitive drag-and-drop widgets or choose from a gallery of professionally designed, pre-built templates to craft beautiful, fully white-labeled reports.
- Monitor: Easily break down—or even aggregate—your data by client, campaign, specific ad creative, or even account manager. Spot emerging trends, compare performance across different segments, and get to the actionable insights faster. Plus, our AI-powered chatbot can cut through the KPI clutter to deliver smart, bite-sized summaries when you need a quick understanding.
- Share: Send reports as live, interactive links, downloadable PDFs, or even versatile Excel files. Automate email delivery on any schedule you choose. If you need to integrate with BigQuery for data warehousing or even send data to Looker Studio for specific use cases, Whatagraph’s got you covered there too—giving you the best of both an all-in-one platform and an open data pipeline when required.
 All this on one marketing data platform means:
✅ Slash reporting time: Free up dozens of hours each month (like Peak Seven's 63!) for strategy, not just report building.
✅ Get a crystal-clear performance view: All your marketing data, organized and understandable in one central hub.
✅ Your whole team aligned, optimizing faster: One source of truth means smarter collaboration and quicker campaign wins.
✅ Data you can actually trust: Dramatically reduce frustrating inconsistencies, broken connections, and mismatched numbers.
✅ Prove your agency's value, loud and clear: Deliver professional, transparent reports that make your impact undeniable to clients and the C-Suite.
Hear from Kim of Peak Seven herself—why she ditched the the Funnel + Looker Studio combination in favor of Whatagraph:
Who do you call when something breaks?
If you're hoping for a dedicated expert to help optimize your setup and be your go-to person, you might need to temper expectations with Funnel.io.
Dedicated success help isn't standard; it's typically reserved for those on their pricier higher-tier plans.
This means you're often relying more on general support channels and your own initiative to maximize the platform's value.
Plus, Funnel.io doesn’t own the full data-to-visualization stack, so bugs or issues can get "bounced around."
The Whatagraph advantage: Every plan comes with a dedicated partner—your own Customer Success Manager. And because Whatagraph owns the ETL, reporting, and automation layers, issues get resolved faster—with no blame-shifting between third-party tools.
When something breaks, there’s one platform to fix it—and our team has your back.
Our support is why customers like Stef Oosterik, Quality Manager at Dtch. Digitals, LOVE us—and often switch over from Looker Studio:
The support team is very responsive. This makes it easy for us to give feedback, think of solutions, and get the right data visible for clients quickly. And most issues are fixed in a day!
Plus, we take feature requests VERY seriously. If you put in one, chances are, we’ll add it!
I’d say 80 to 90% of the necessary features we’ve requested have been implemented.
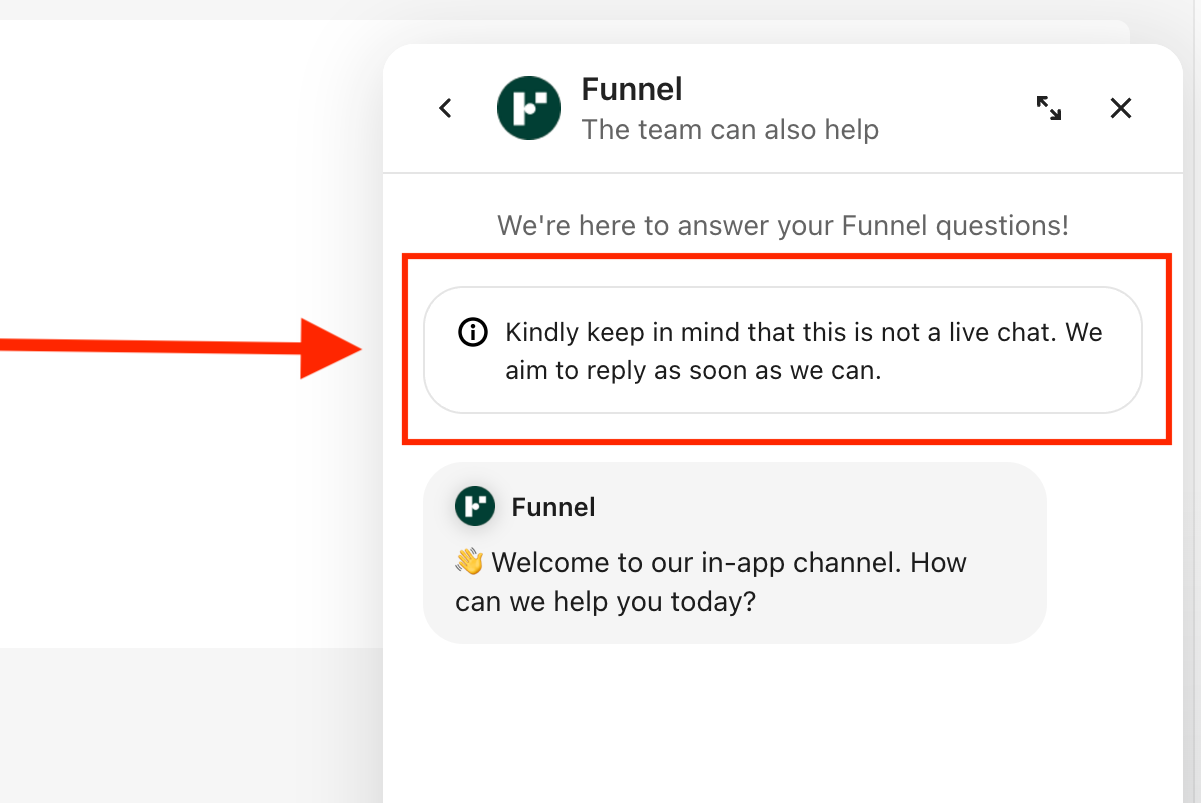
Also, Funnel doesn’t have a live chat feature. So, if you’re hoping for a quick answer, you could be hoping for a long time.
Their AI chatbot aims to answer some questions in the absence of a human, but more often than not, I was redirected to an actual person—long after I’d left my workstation.
The Whatagraph advantage: Live chat support with response times under 4 minutes—no bouncing between vendors, no finger-pointing. And most importantly—no excruciating waiting.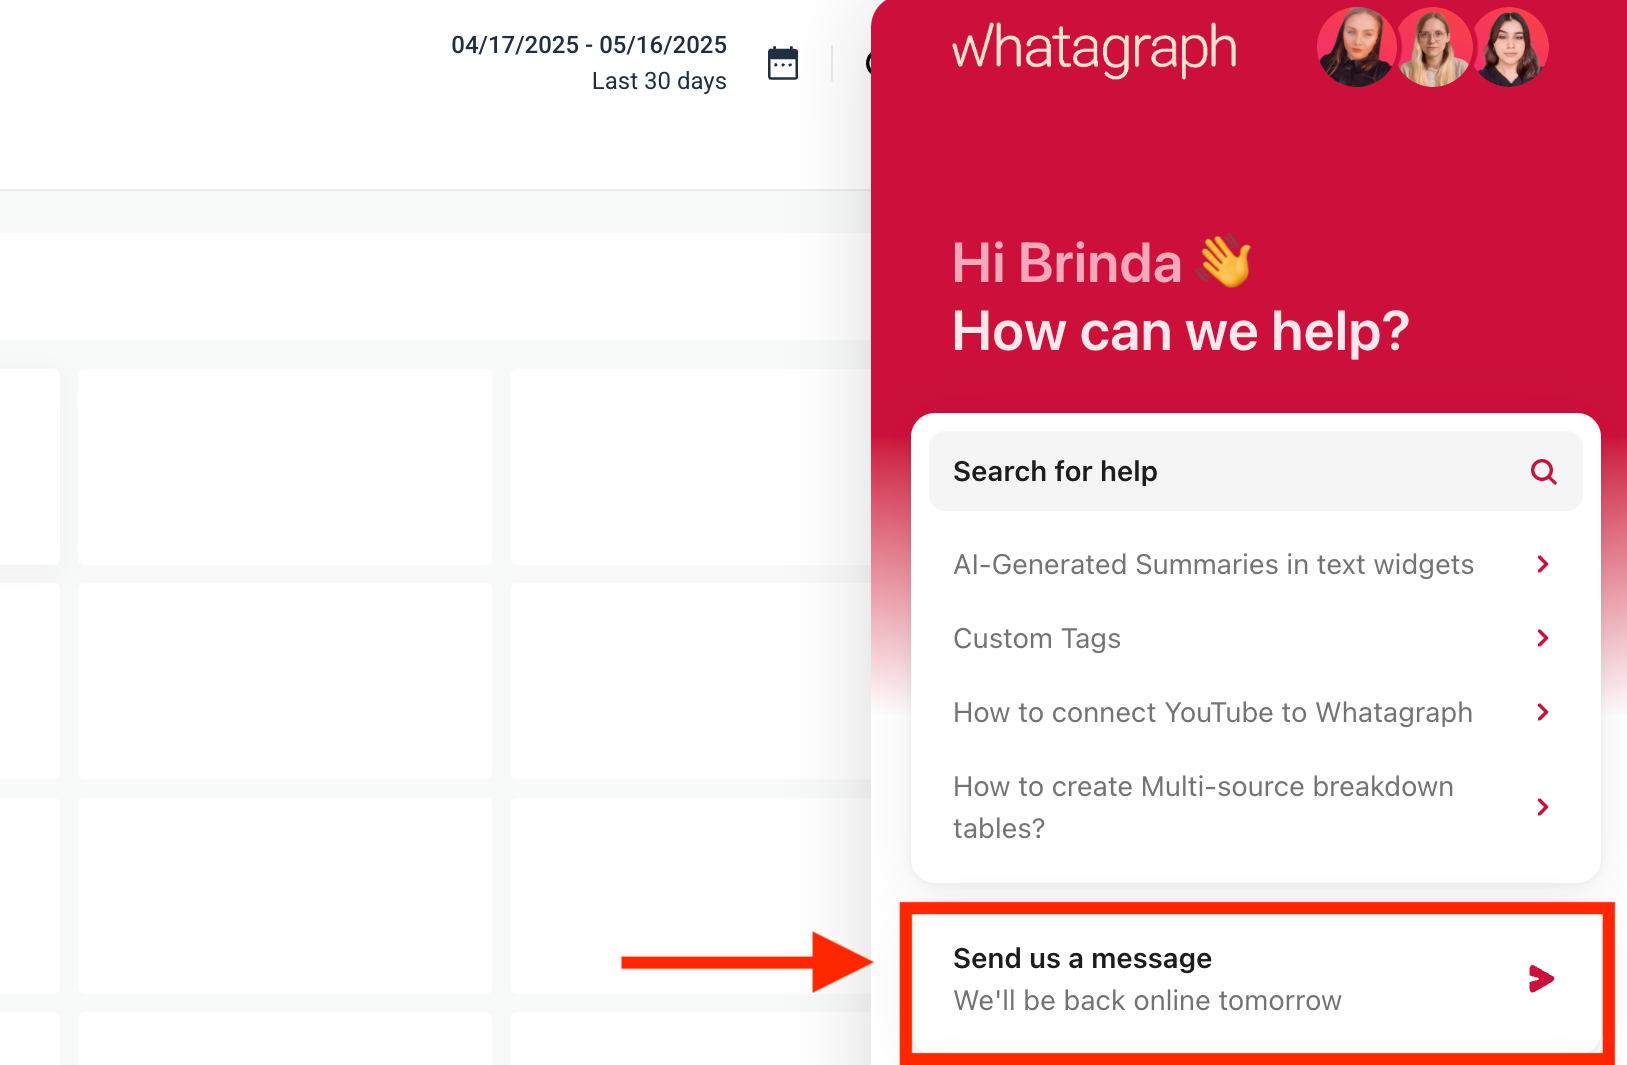
What are the other ways to get help?
Funnel.io offers several self-service and asynchronous support channels:
- Knowledge Base: This is usually your first port of call. Funnel.io has an extensive online Help Center filled with articles, how-to guides, troubleshooting steps, and FAQs.
- Email support/Ticket system: For issues that aren't resolved by the Help Center or for more complex problems, Funnel.io offers a way to submit support requests, usually via email or a ticketing system.
What are real users saying about their experience?
One recent G2 review from 2025 praises Funnel’s support team for being responsive and helpful—credit where it’s due.
“The support team have been amazing, they come back with answers to any problems I have had within the same day normally.”
But that review seems to be the exception, not the rule.
Statistically, 3 out of 4 public customer support reviews from 2025 paint a far less flattering picture.
On Trustpilot, users report being ghosted after reaching out, locked into contracts they no longer want, and frustrated by a lack of basic courtesy—like returning a phone call.
I called this company many times to find out about their services but I never received the call back they are very irresponsible and do not know how to run a business if they can't even make a phone call back who needs them deal with someone else.
But a truly disheartening review comes from Javier Figorla who had been a loyal Funnel.io customer for 10 years.
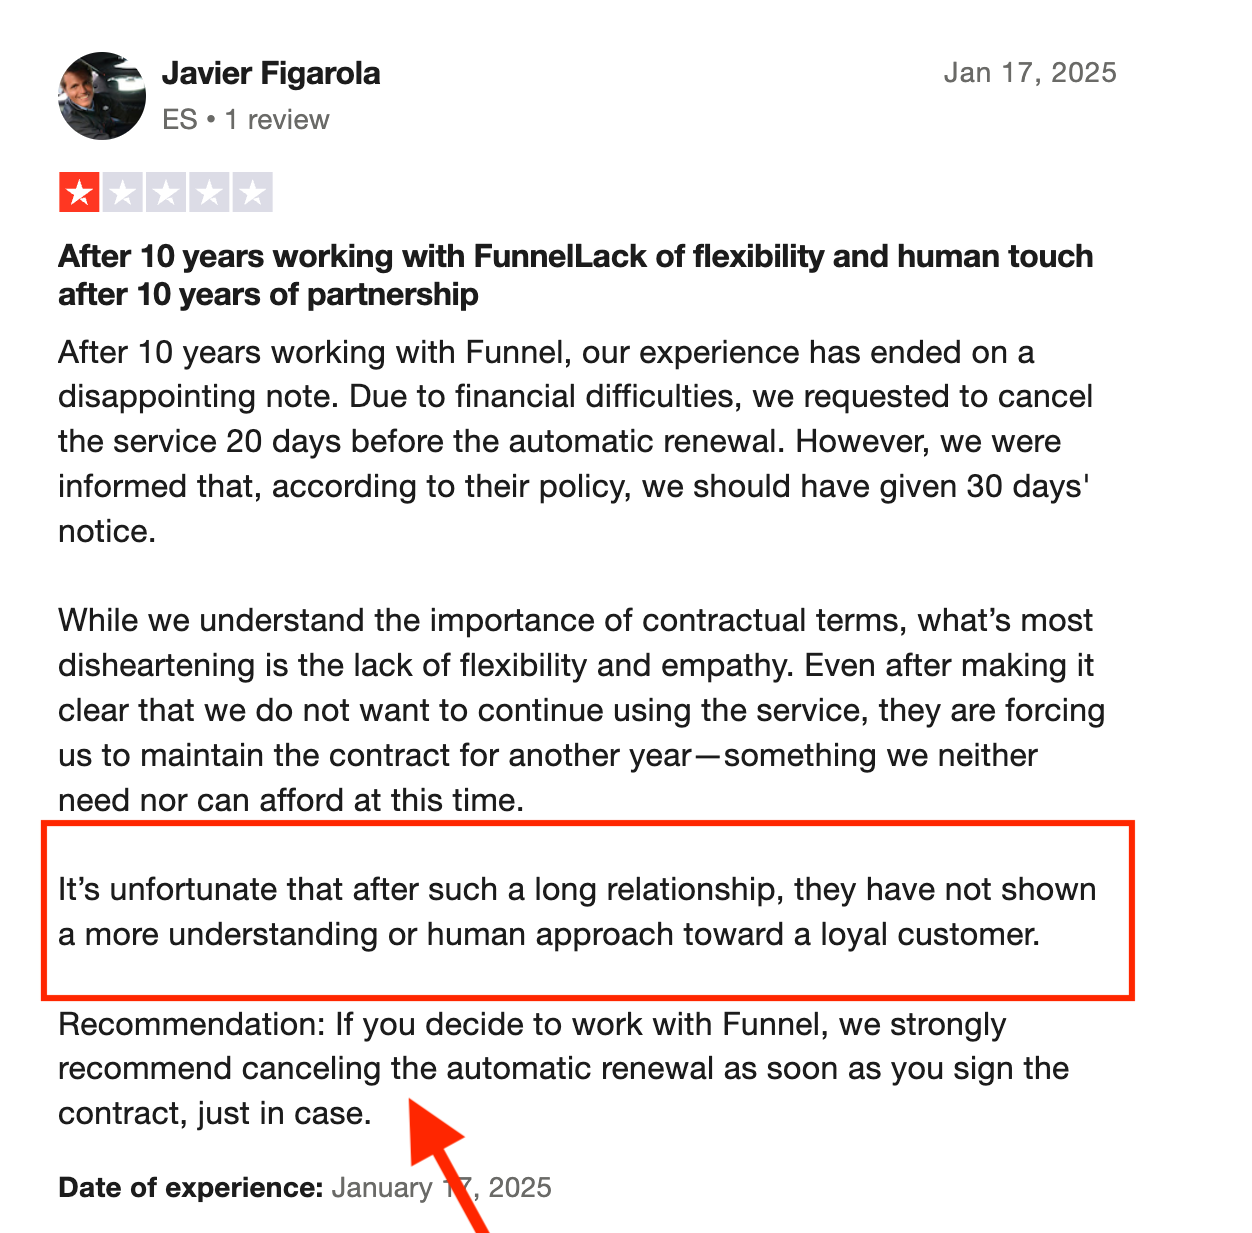
Facing genuine financial difficulties, they tried to cancel their service just 20 days before the automatic renewal. The response was a rigid enforcement of a 30-day notice policy, effectively forcing them to pay for another entire year of a service they neither wanted nor could afford.
When your reporting pipeline breaks mid-sync or your campaign dashboards suddenly look wrong, you don’t want a game of support ping-pong.
You want answers. Fast.
And that’s where Funnel’s split-stack approach hurts the most: one team owns the ETL. Another owns the visualization. And your support ticket just fell into the gap between them…
Meanwhile, real users have left Whatagraph glowing reviews for our dogged commitment to customer support excellence:
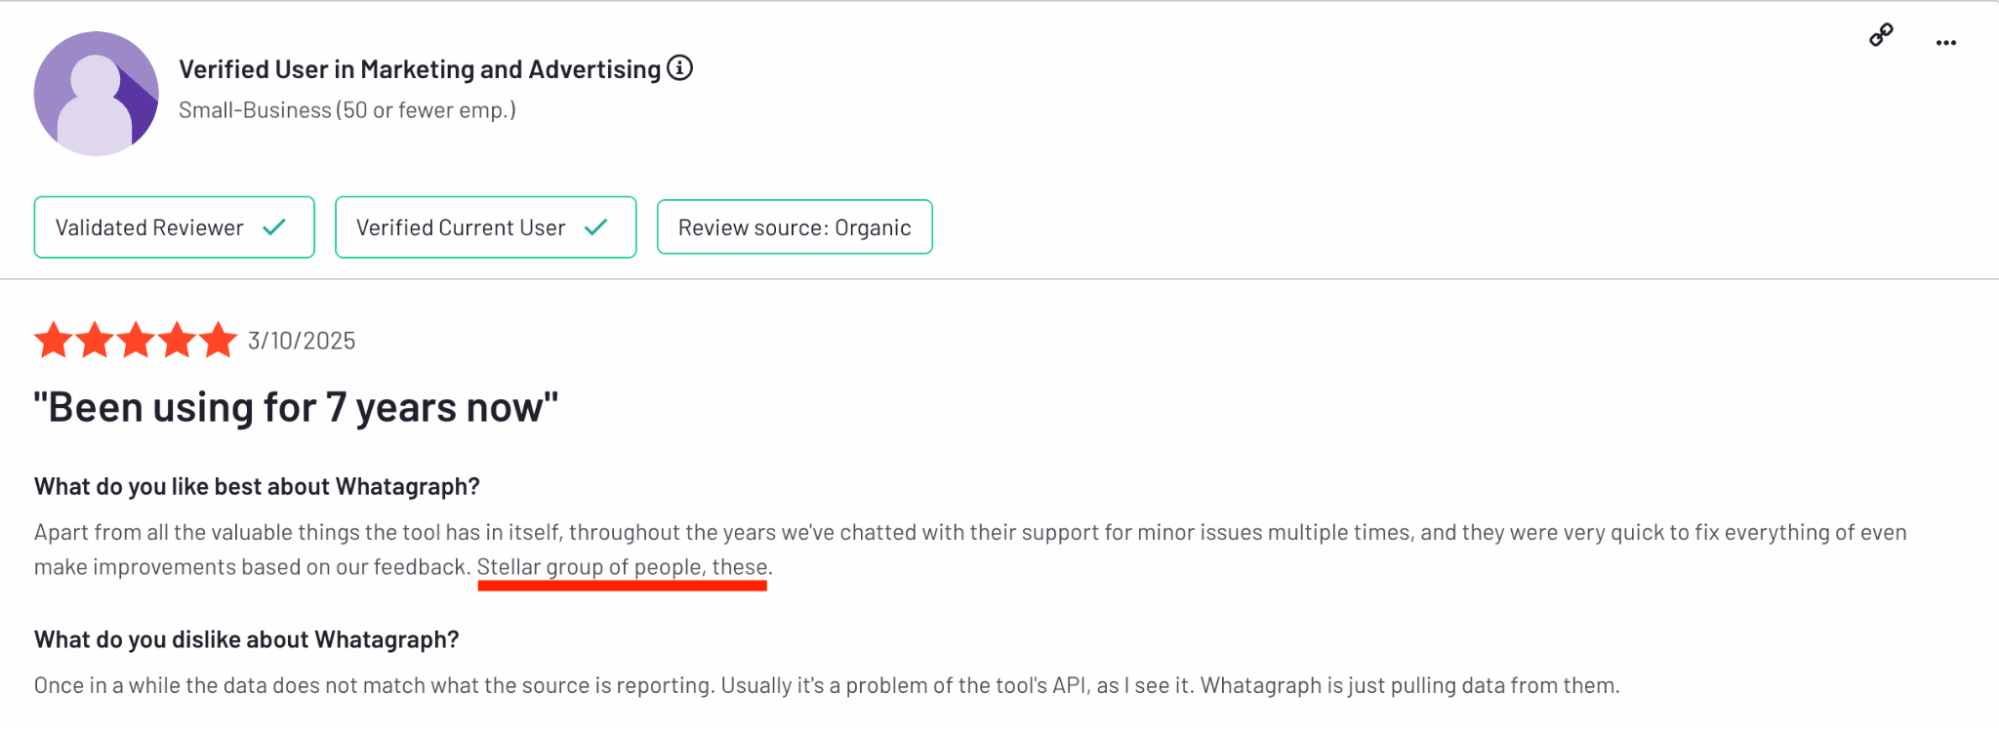
A verified user who’s been with us for seven years says we’ve been “very quick to fix everything” and “even make improvements based on feedback.”
“Stellar group of people, these.” (One of our favorite reviews, really.)
Another user says: “I have found their support to be exceptionally helpful whenever a problem arises.”
Funnel’s support can be a coin toss—great if you get lucky, infuriating if you don’t. And if you’re not on a premium plan, your odds don’t improve.
Final Verdict: When to Use Funnel.io and When to Switch
Choose Funnel.io if:
- You're a large enterprise or a company: You have a dedicated data engineering team already managing a sophisticated BI setup (think Tableau, Power BI, or a custom data warehouse like BigQuery or Snowflake).
- Your primary goal is to automate the extraction and complex transformation of diverse marketing data: Client-facing reporting happens much further downstream, handled by separate tools and teams.
- You have a substantial budget: You're comfortable with a $400+/month starting cost, can comfortably absorb Funnel.io's usage-based Flexpoint pricing, plus the ongoing costs (licenses, developer time, maintenance) of your separate, advanced visualization and BI platforms.
- You need to control every tiny, technical detail of your data preparation (ETL): Possibly with code, AND you have true tech experts on your team who can manage that complexity.
- You see your ETL tool strictly as a data pipeline: Its job is to prepare and deliver data, meaning you don't need the ETL tool itself to offer any significant native reporting, dashboarding, or client-ready visualization features.
But what if you're not a massive enterprise with deep pockets and a dedicated data engineering squad?
What if you do need polished, client-facing reports without the headache of a separate BI tool?
If that's your reality, then you're likely looking for an end-to-end solution like Whatagraph.
✅ One simple platform, not a two-tool headache: Forget the Funnel.io + Looker Studio + internal tools juggling act. Whatagraph brings everything you need for powerful reporting under one, easy-to-manage roof.
✅ So easy, your entire team can use it: From junior staff and account managers to your newest interns, anyone can confidently create, customize, and share professional reports.
✅ Built from the ground up for agencies: Add your branding to impress clients, manage multiple accounts in one view, export to BigQuery when needed, and use ready-made templates to create impactful reports quickly.
✅ You get time back in your day—guaranteed: Most Whatagraph users reclaim a remarkable 30%-70% of the time. That means more time for what truly matters: strategy and happy clients.
✅ Pricing that scales with you, not against you: Try it free, upgrade only when your reporting needs grow, and keep costs predictable with all-in-one pricing. No usage penalties, no surprise overages, and no need to pay separately for reporting tools.