Data Blending: Clear Insights for Data-Driven Marketing
Decision-makers across industries increasingly depend on data-driven marketing insights. As data volume and complexity grow, agencies and their clients struggle to get more accurate insights. The good news is that data analytics is evolving, too. Thanks to quick and versatile applications of data blending, actionable, organized data is now within your grasp, without enlisting data specialists or complicated data integration tools.

Mar 25 2024●7 min read


Let’s consider an example. You’re a strategist in a PPC agency running a multi-level campaign that has seen a drop in conversions against the campaign KPIs. To make things worse, the contract review is due soon.
What can you do to pinpoint the problem?
You can pull resources from your agency’s data team and crunch the numbers, or in the worst-case scenario — do it yourself.
Luckily, you now have access to powerful data-blending solutions that let you analyze the performance of different marketing channels much more effectively.
In this article, you’ll learn more about data blending and how it works. On top of it, we’ll explore several real-world scenarios through different data blending use cases.
What is data blending?
Data blending is an operation of bringing together two or more data sets to visualize and analyze results in a way that doesn’t physically combine or alter the original data sets.
The blended sources use external code and formulas, provided by the data analytics platform to query data sources separately and combine the read-only data into visualizations available in that platform.
This approach blends data with much more flexibility and speed than other methods of combining data for analysis.
Data blending types
Although there is little difference between data blending types, there are different approaches depending on how you instruct your data blending tool to join data.
A join is an operation through which the combined data sources are positioned one against another in your blend.
When considering join types, think of data as two separate tables.
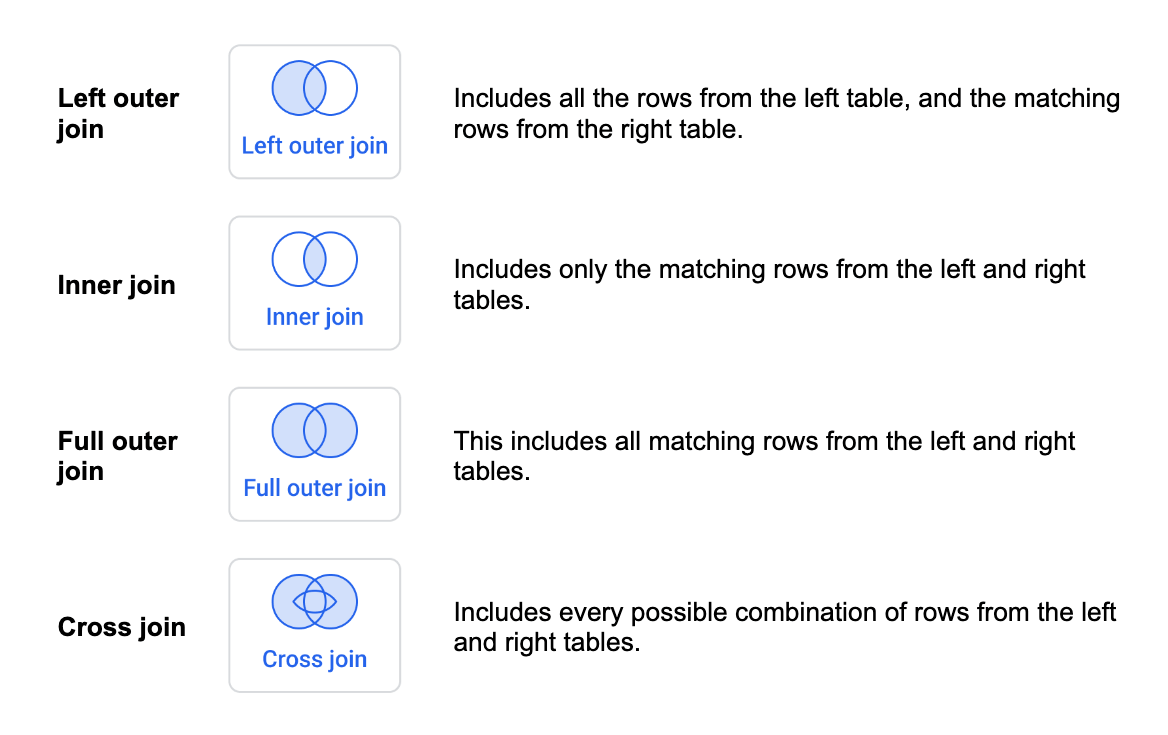
For example, you will use the inner join to match rows from two tables based on the common values and visualize them side by side in a table. Let’s say you want to combine sales data from Amazon Pay with an email address and a matching row from HubSpot with the same email address. An inner join matches this data based on the same email.
On the other hand, an outer join combines data sets even if they don’t have matching values in a common key column. For example, you can combine two data sets with web traffic data — even if many of the URLs have changed over time as you publish new blog posts, product pages, etc.
The left join is useful when you have one primary data source and multiple secondary data sources. Your primary data source will be on the left side of your data blend. In the case of data blending in Tableau, this layout allows you to perform a data analysis with different levels of granularity.
How does the data blending process work?
If you already feel overwhelmed after reading the previous section, you’ll be happy to hear that the kind of blending described above will be done by your data blending tool.
Once you start using data blending tools, all the data blending processes will be intuitive and straightforward. However, it’s important for you to understand what output you’re looking for.
Step 1: Connect the sources you want to blend. In Whatagraph, your job is easy, as you have direct native integrations to 45+ popular marketing platforms.
Step 2: Create a blend of two or more sources. Keep in mind that you may run into limits here, depending on the tool you choose. With Looker Studio, for example, you can't add more than five sources in one blend. Learn more about the limitations of data blending in Looker Studio and how to overcome them.
Step 3: Analyze the results in multi-source tables or other data visualization types. Whatagraph, for example, also allows you to apply a custom formula on the blended source level.
Data blending use cases and scenarios
Now we will explore the two most common use cases of how to blend data in Whatagraph followed by two real-world examples. Whatagraph has developed a user-friendly Organize feature that allows you to blend, aggregate, unify, and group data in the same environment where you connect sources and visualize insights.
Thanks to this intuitive and scalable feature, any marketer can learn how to make a blend of sources without any specialized training or coding.
We’ll start with a basic case first.
Create a cross-channel table overview
Goal: To create a cross-channel overview table where each metric column belongs to a different source.
- Challenge 1: This is not possible with a standard table widget as it only supports one source.
- Challenge 2: This is not possible with a multi-source breakdown table either, as the source is always used as a dimension.
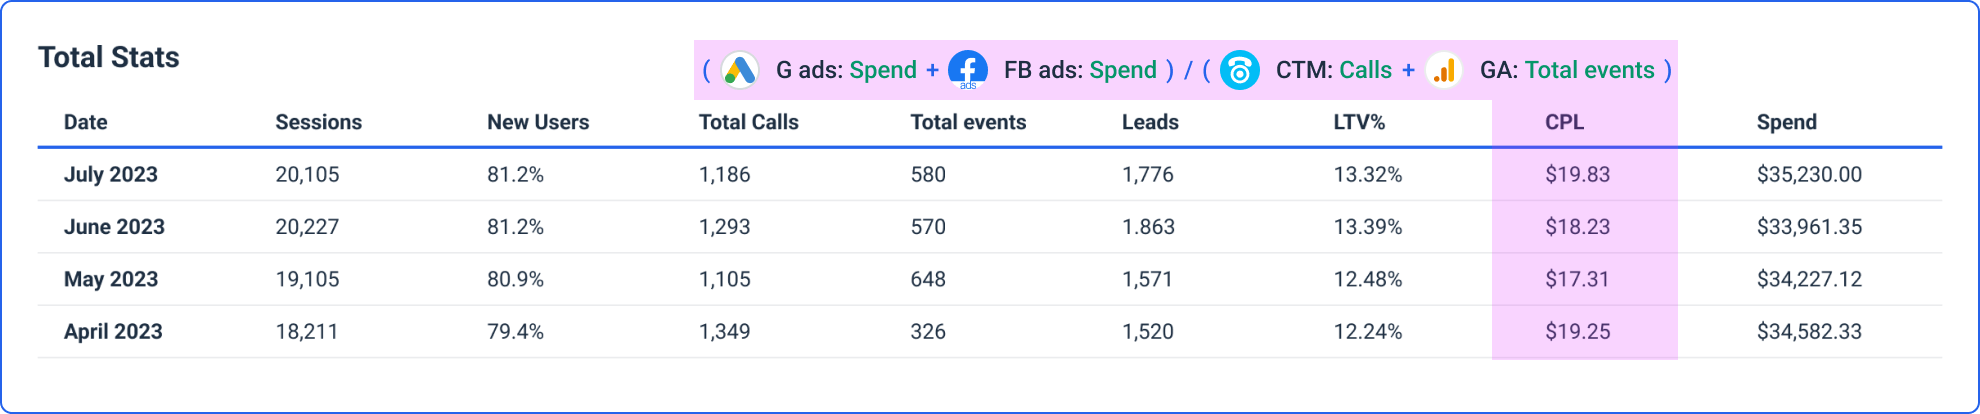
For this table, we want each column to represent different metrics from different sources.
How data blending helps:
With data blending, we can create a single source that contains all the metrics from all the sources we’d like to include in our table. In other words, we’d use a standard table widget with the blended source and select the metrics we need.
Steps we need to take:
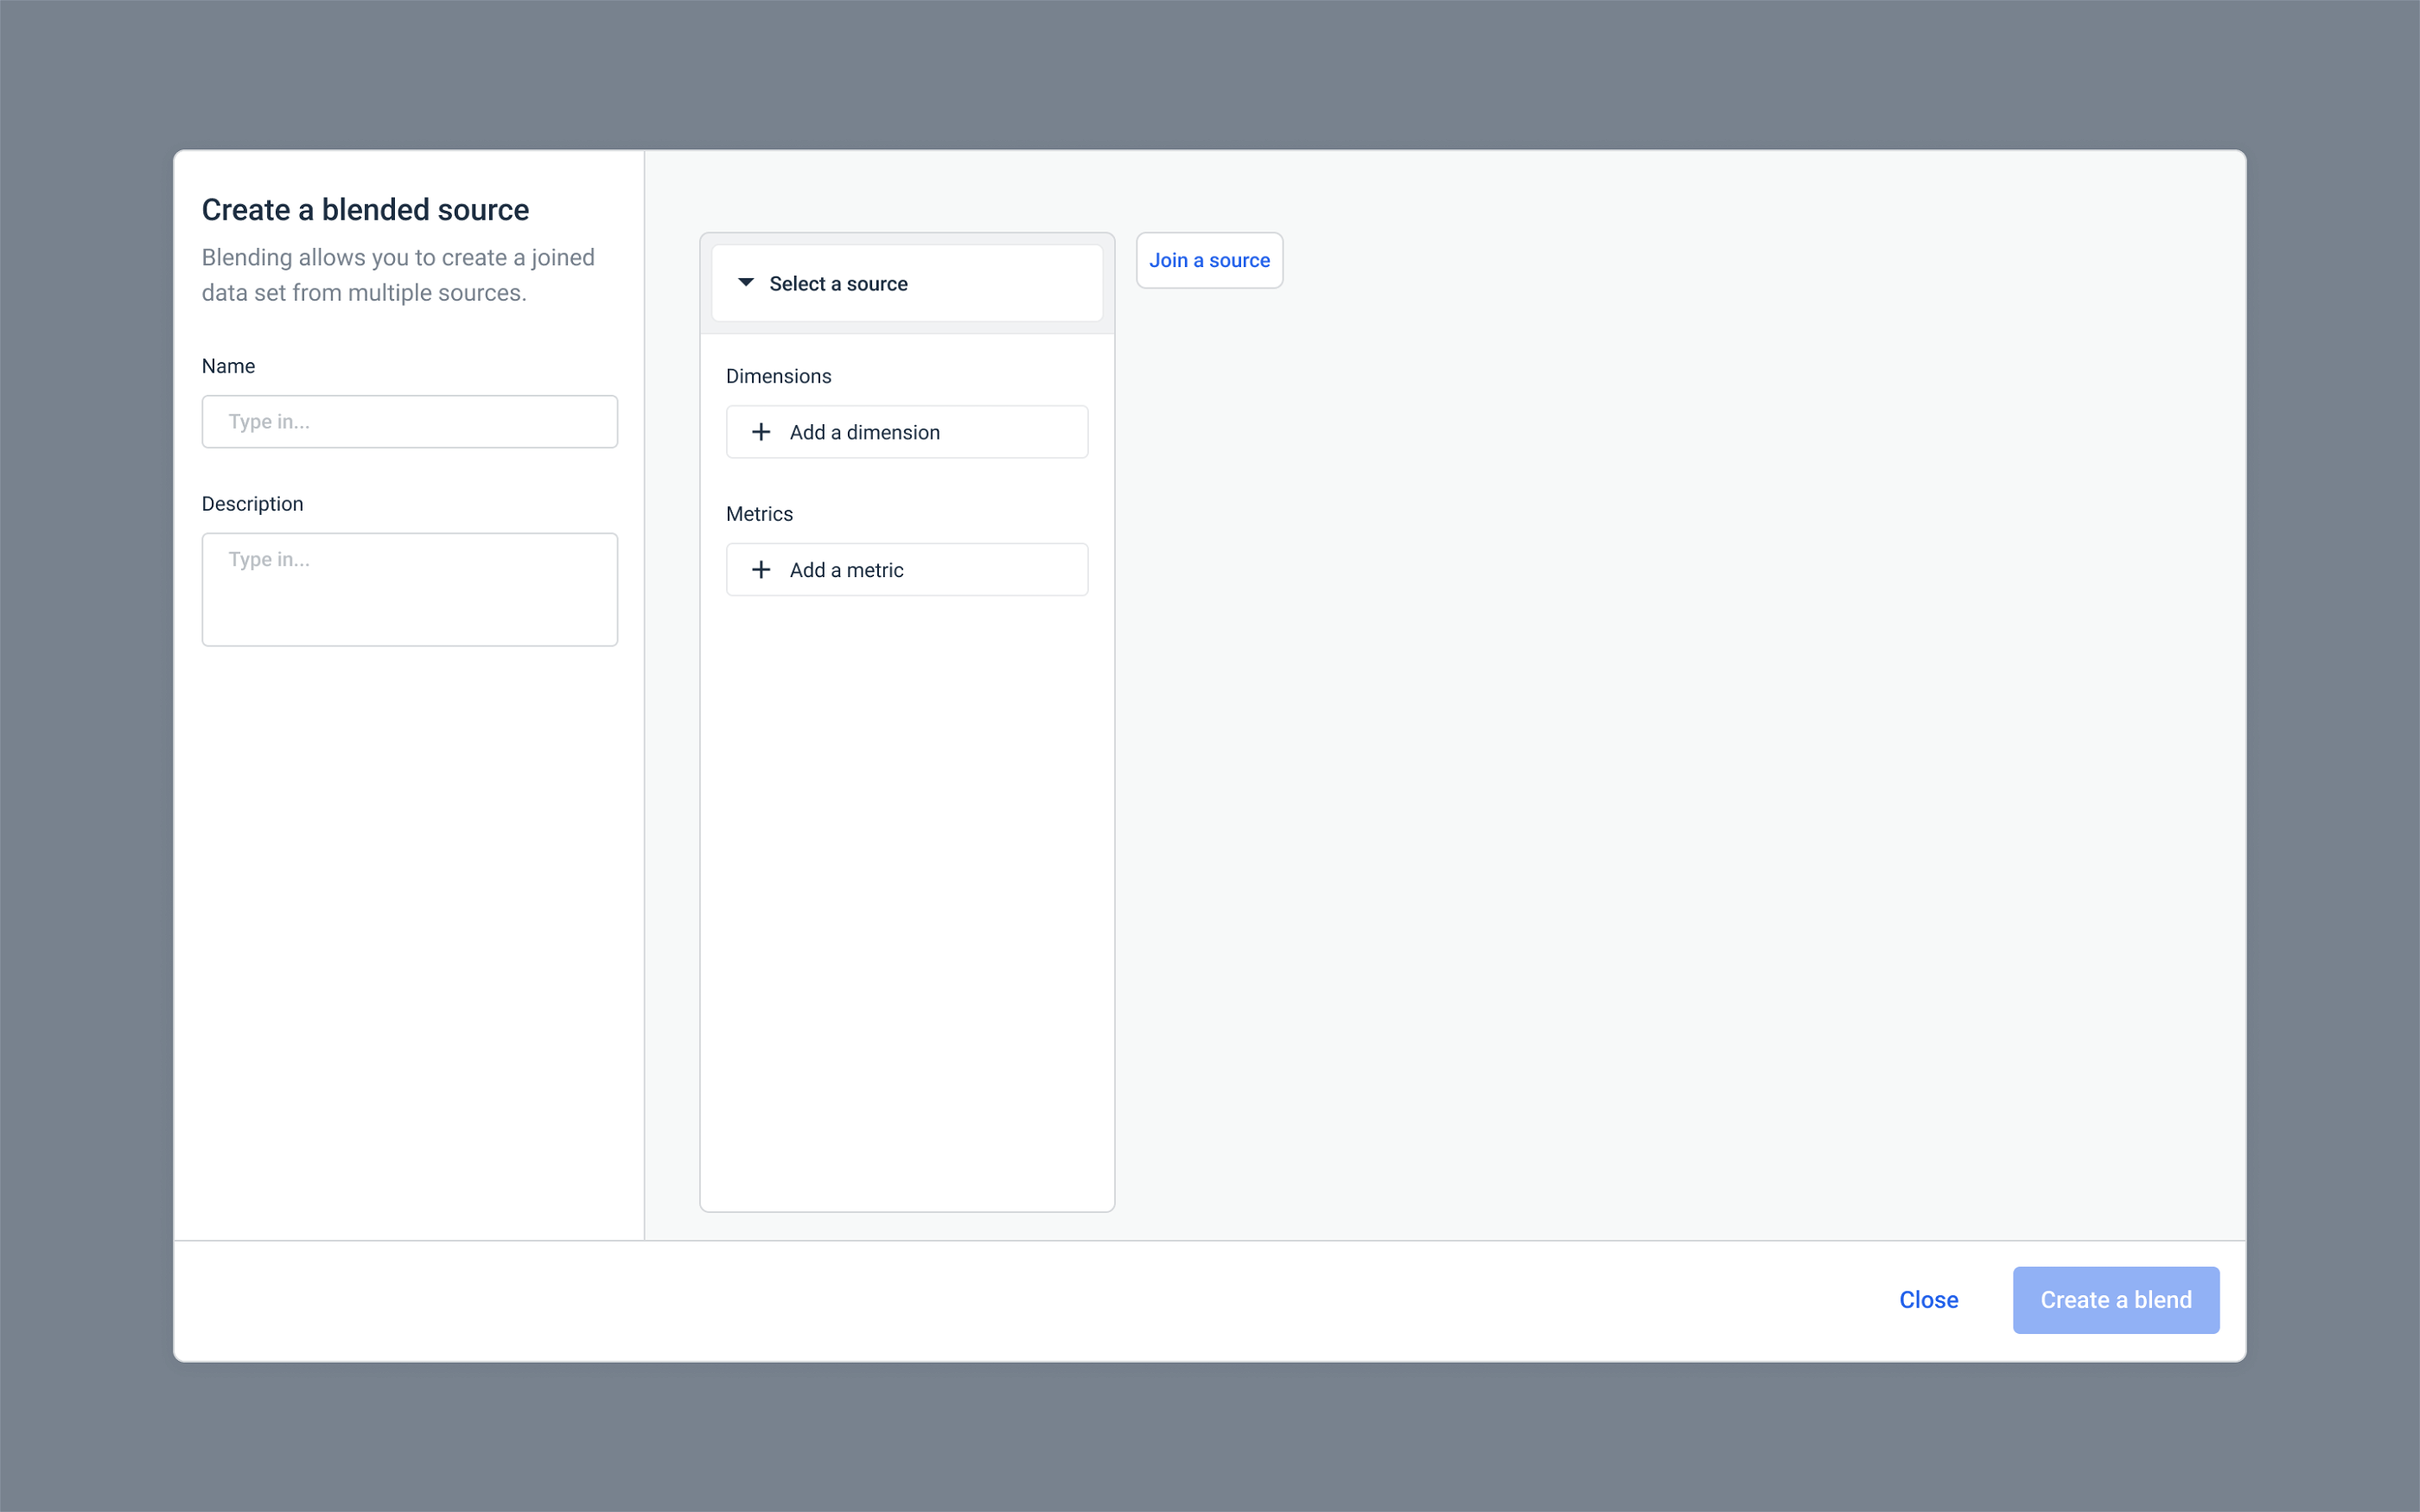
1. Create a blended source
From the Organize environment click on Create new > Blended source.
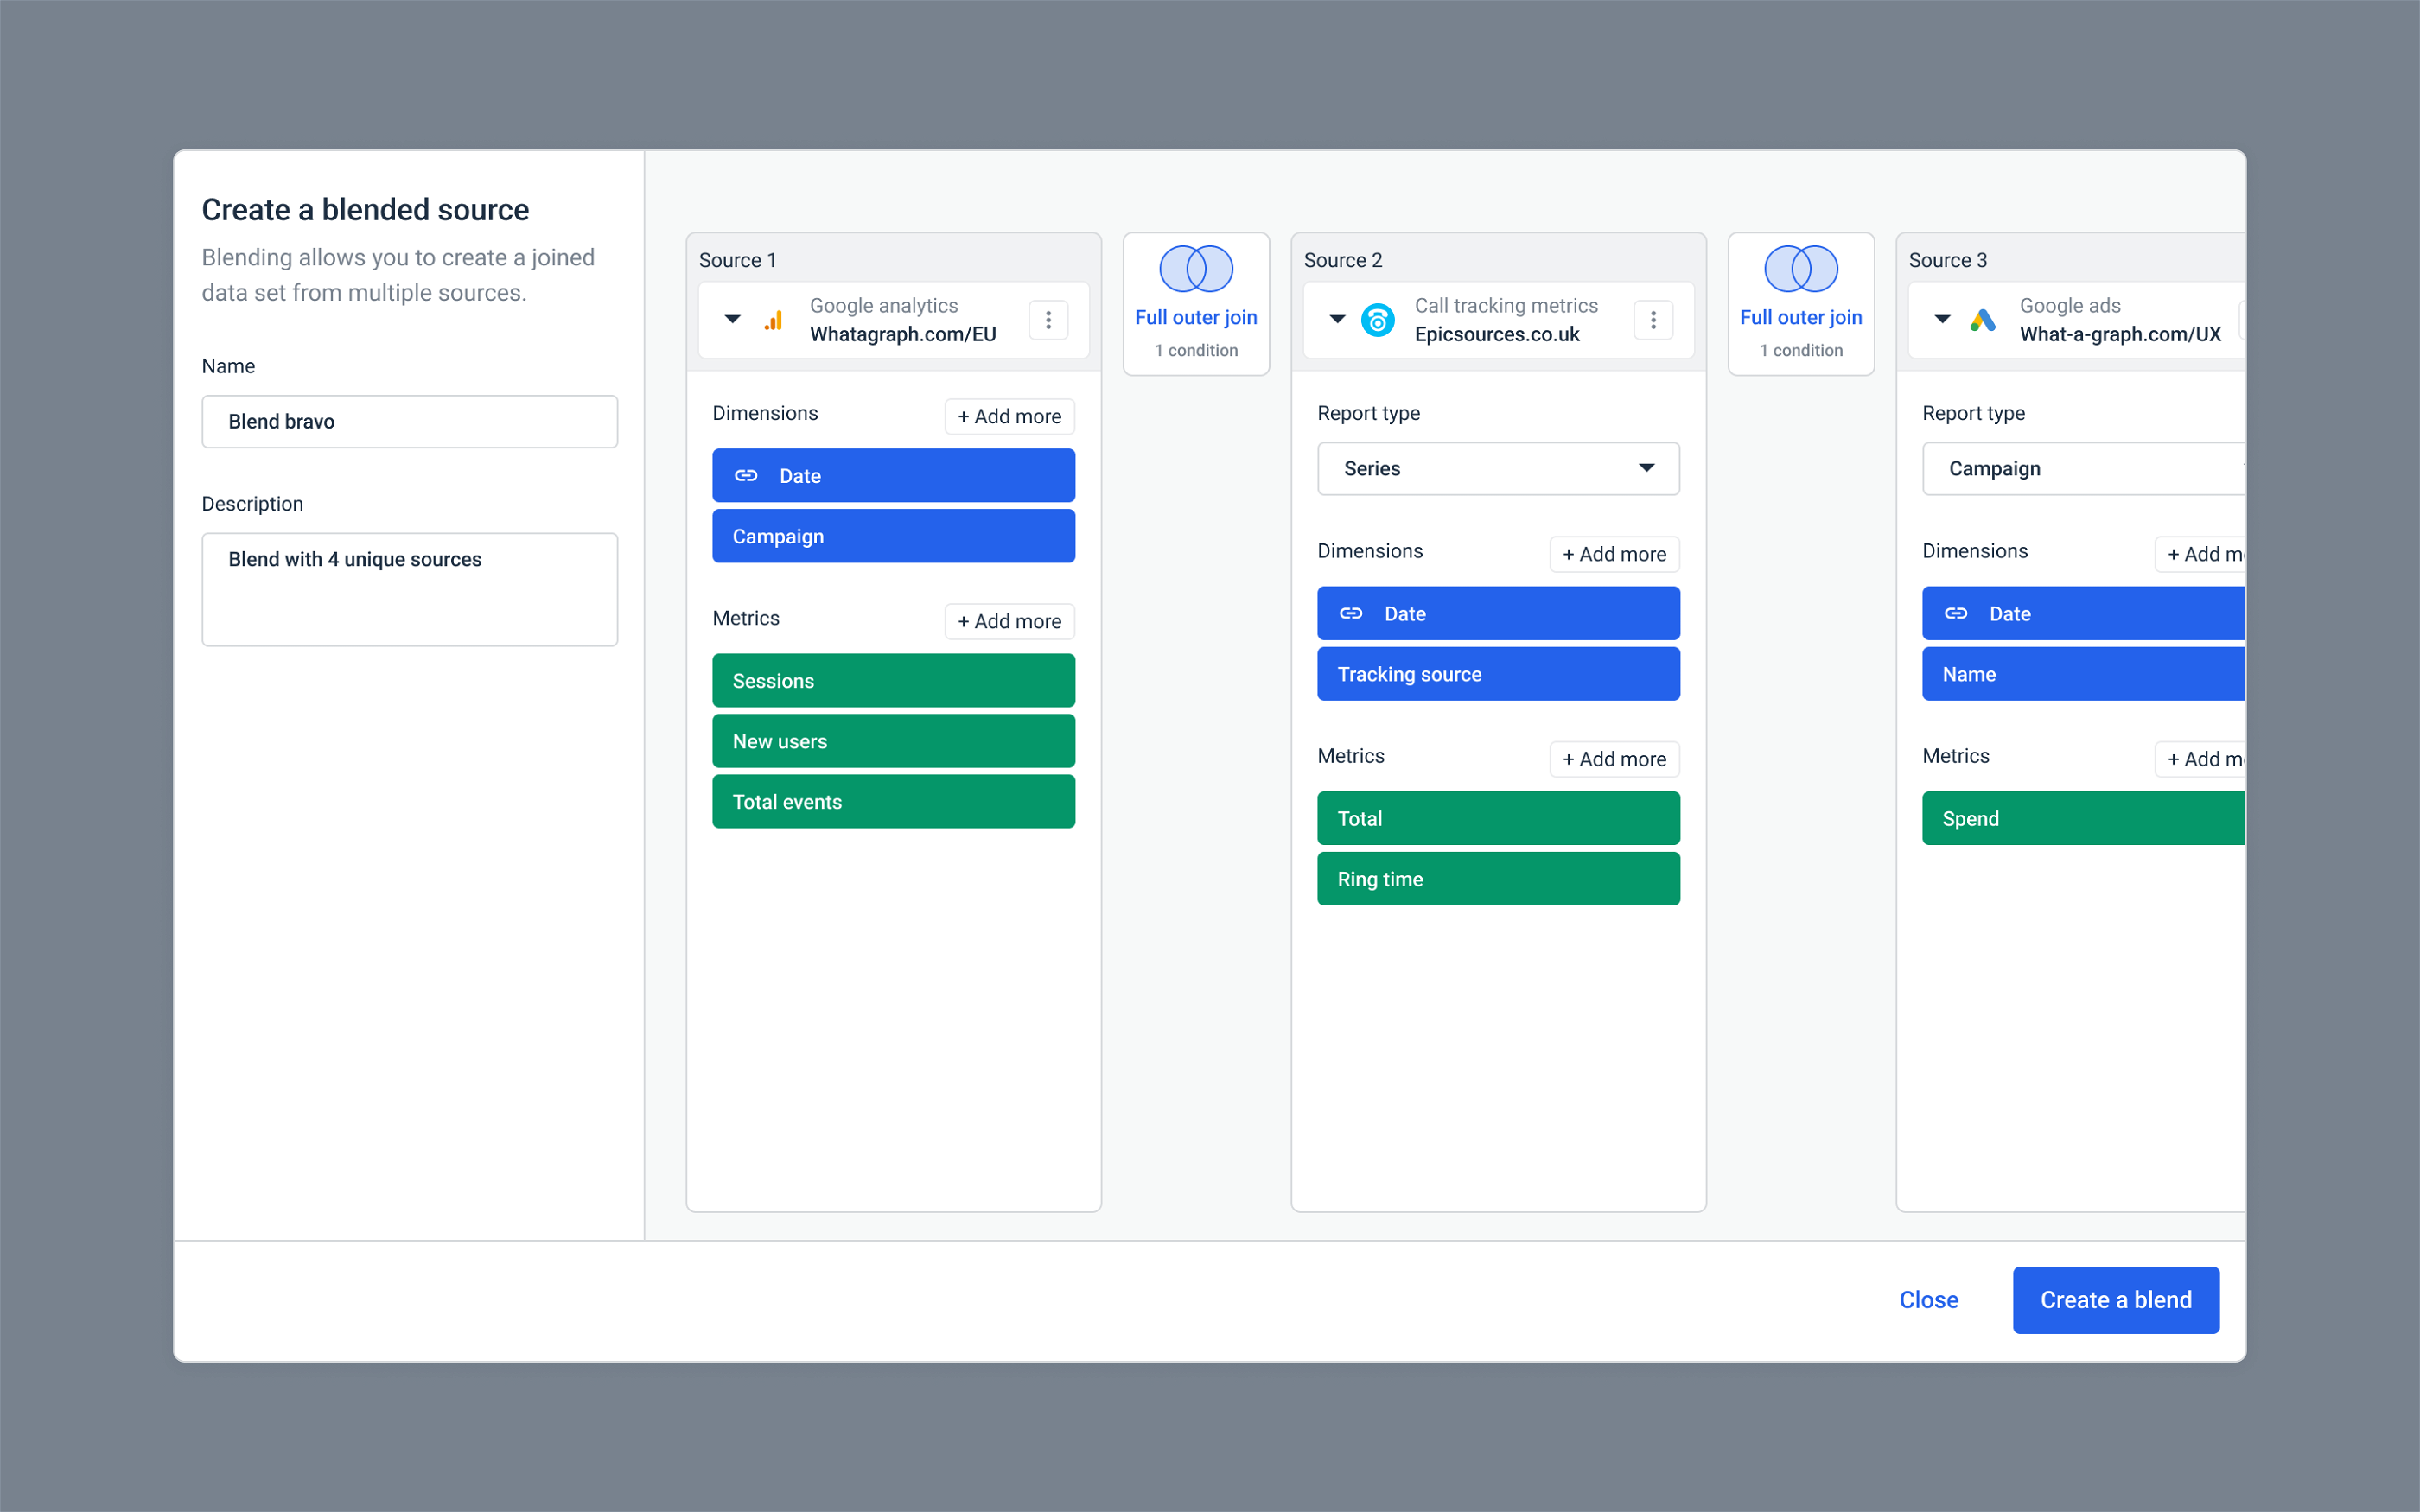
2. Select sources
Choose sources and their metrics and dimensions that you want to include in your blend.
3. Join sources
Select a join type between each source and the dimensions you want to use as a join key.
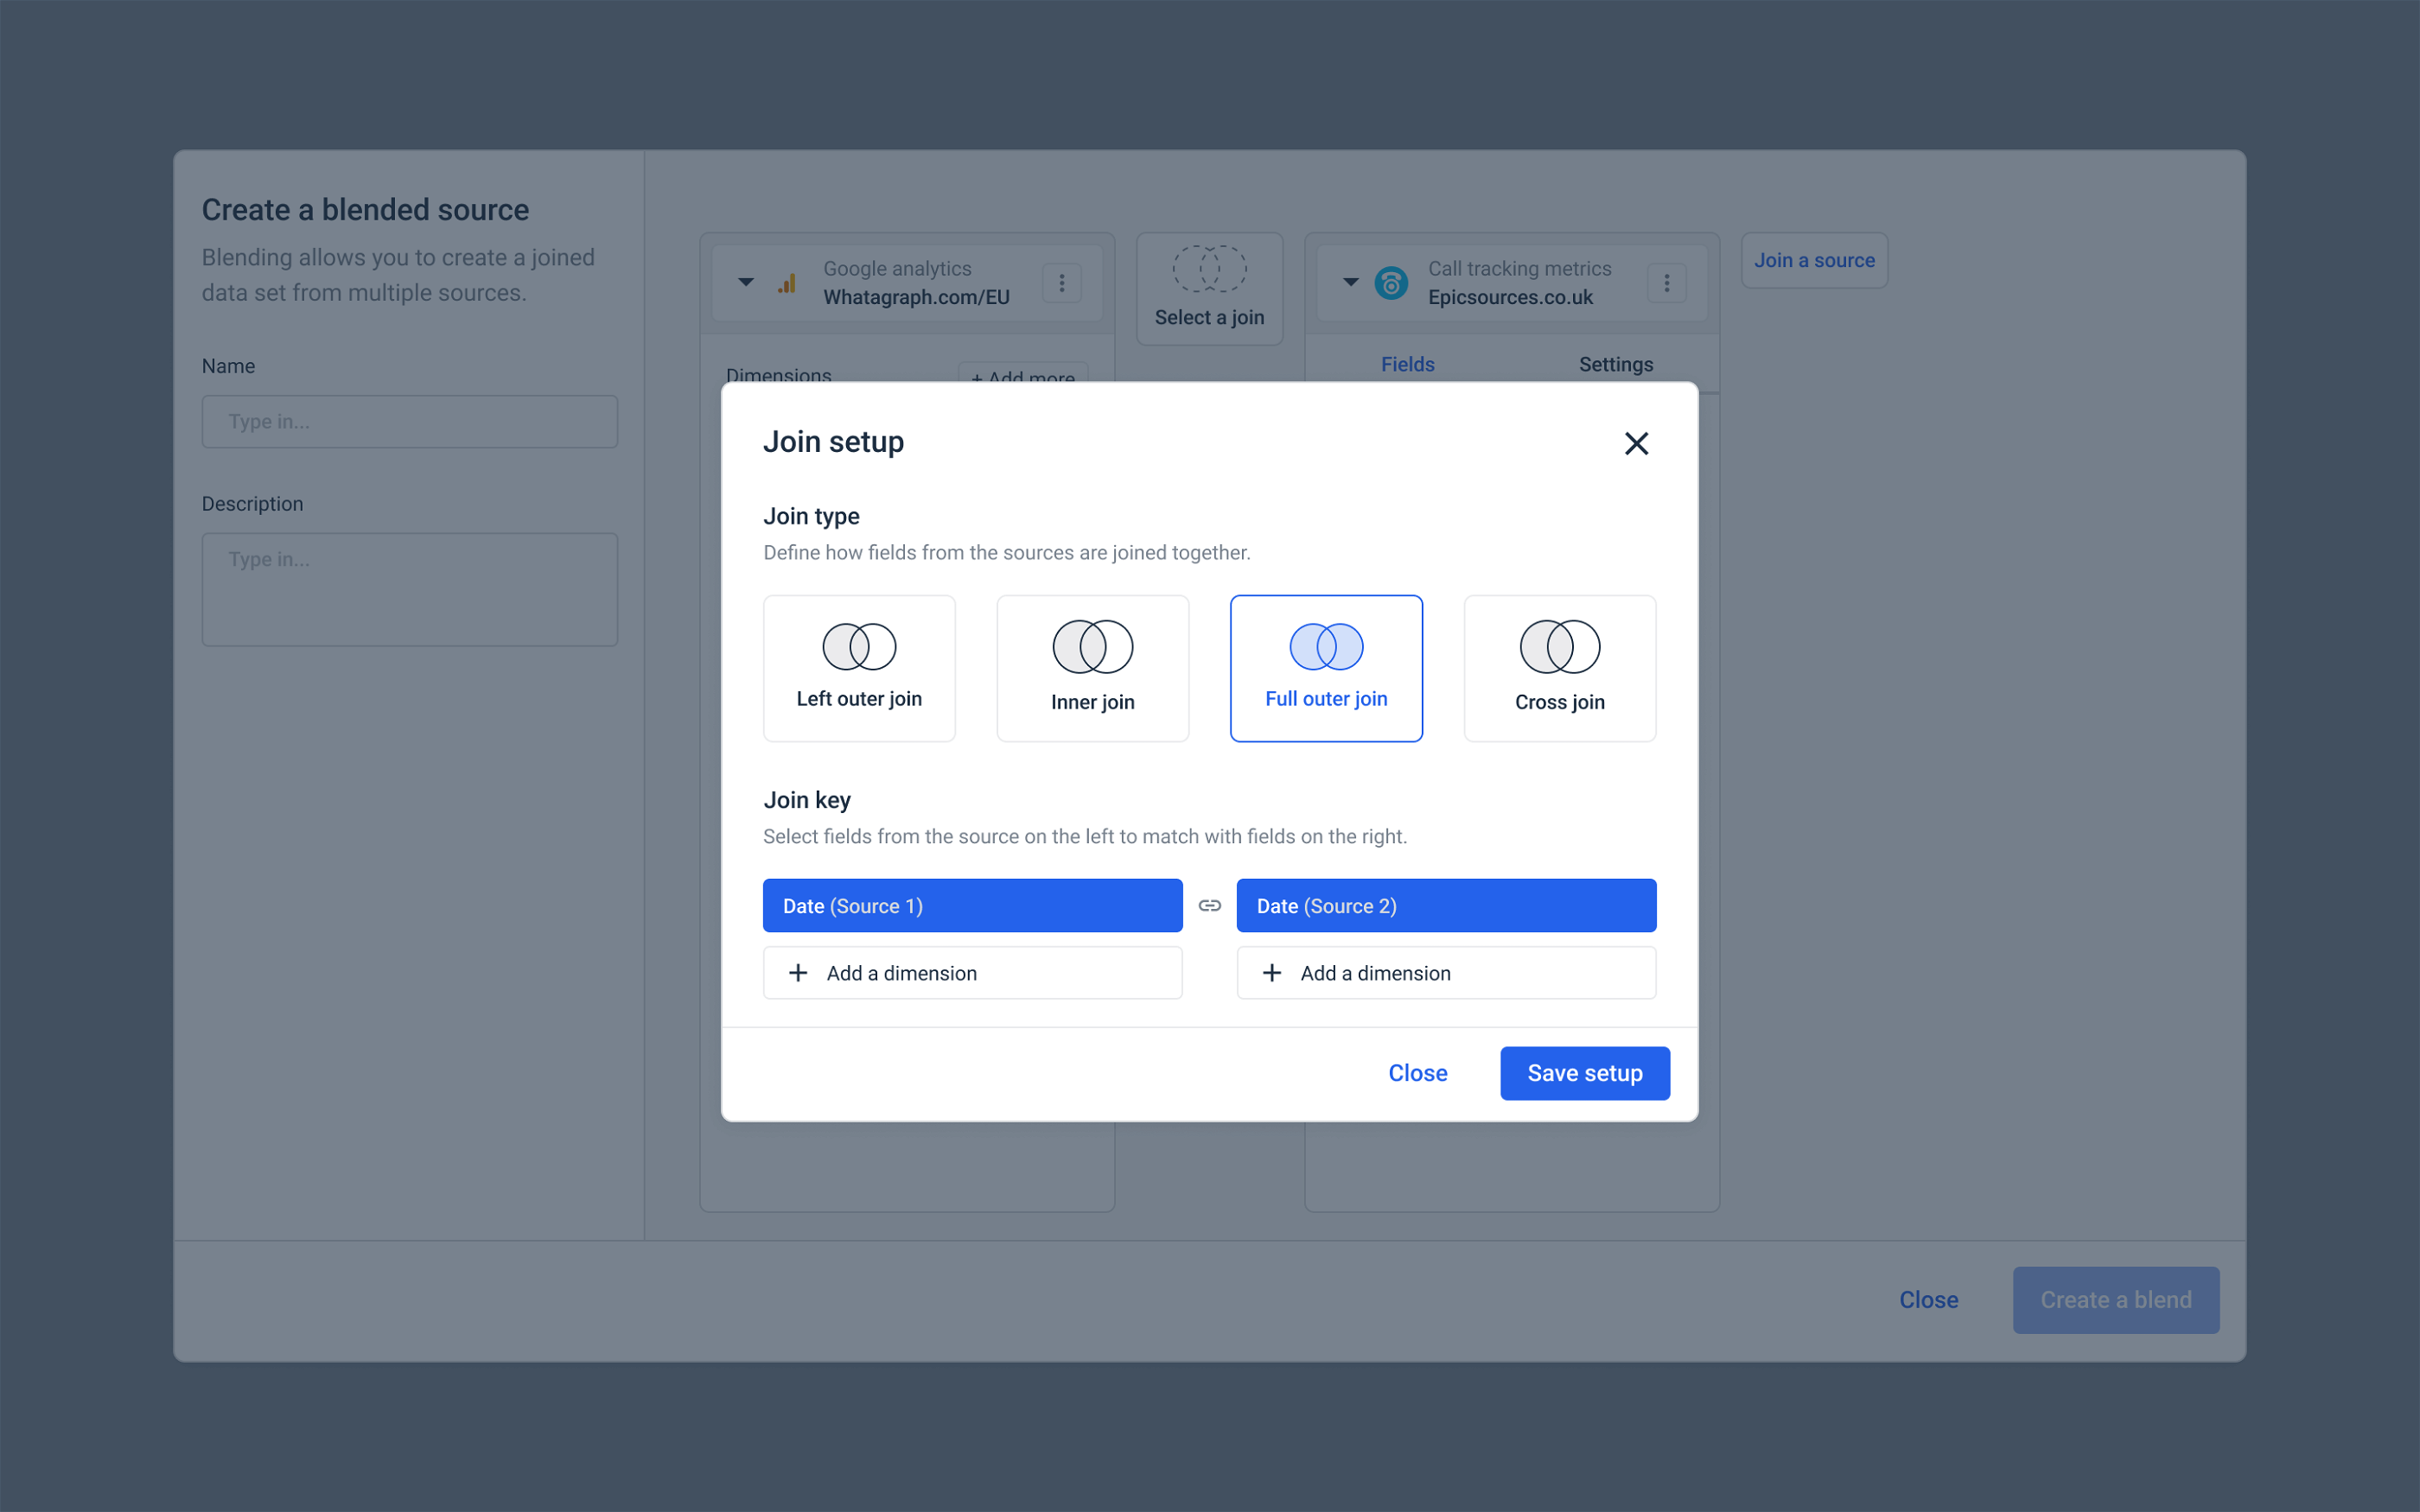
If you’re used to the blending process in Looker Studio, the concept of joins keys and blending in general are similar to Whatagraph.
4. Blend data
After completing these steps, you have a single data set that contains data from multiple sources. Once you use it in a report, you can manage it as a standard source, however the metrics you selected belong to different sources.
When you are building a report, you need to select your blended source. Open the channel list and go to the Blended sources tab.
Once you select the source, add a table widget and select the metrics. The metrics list will be broken down by sources — the source we selected for our blend.
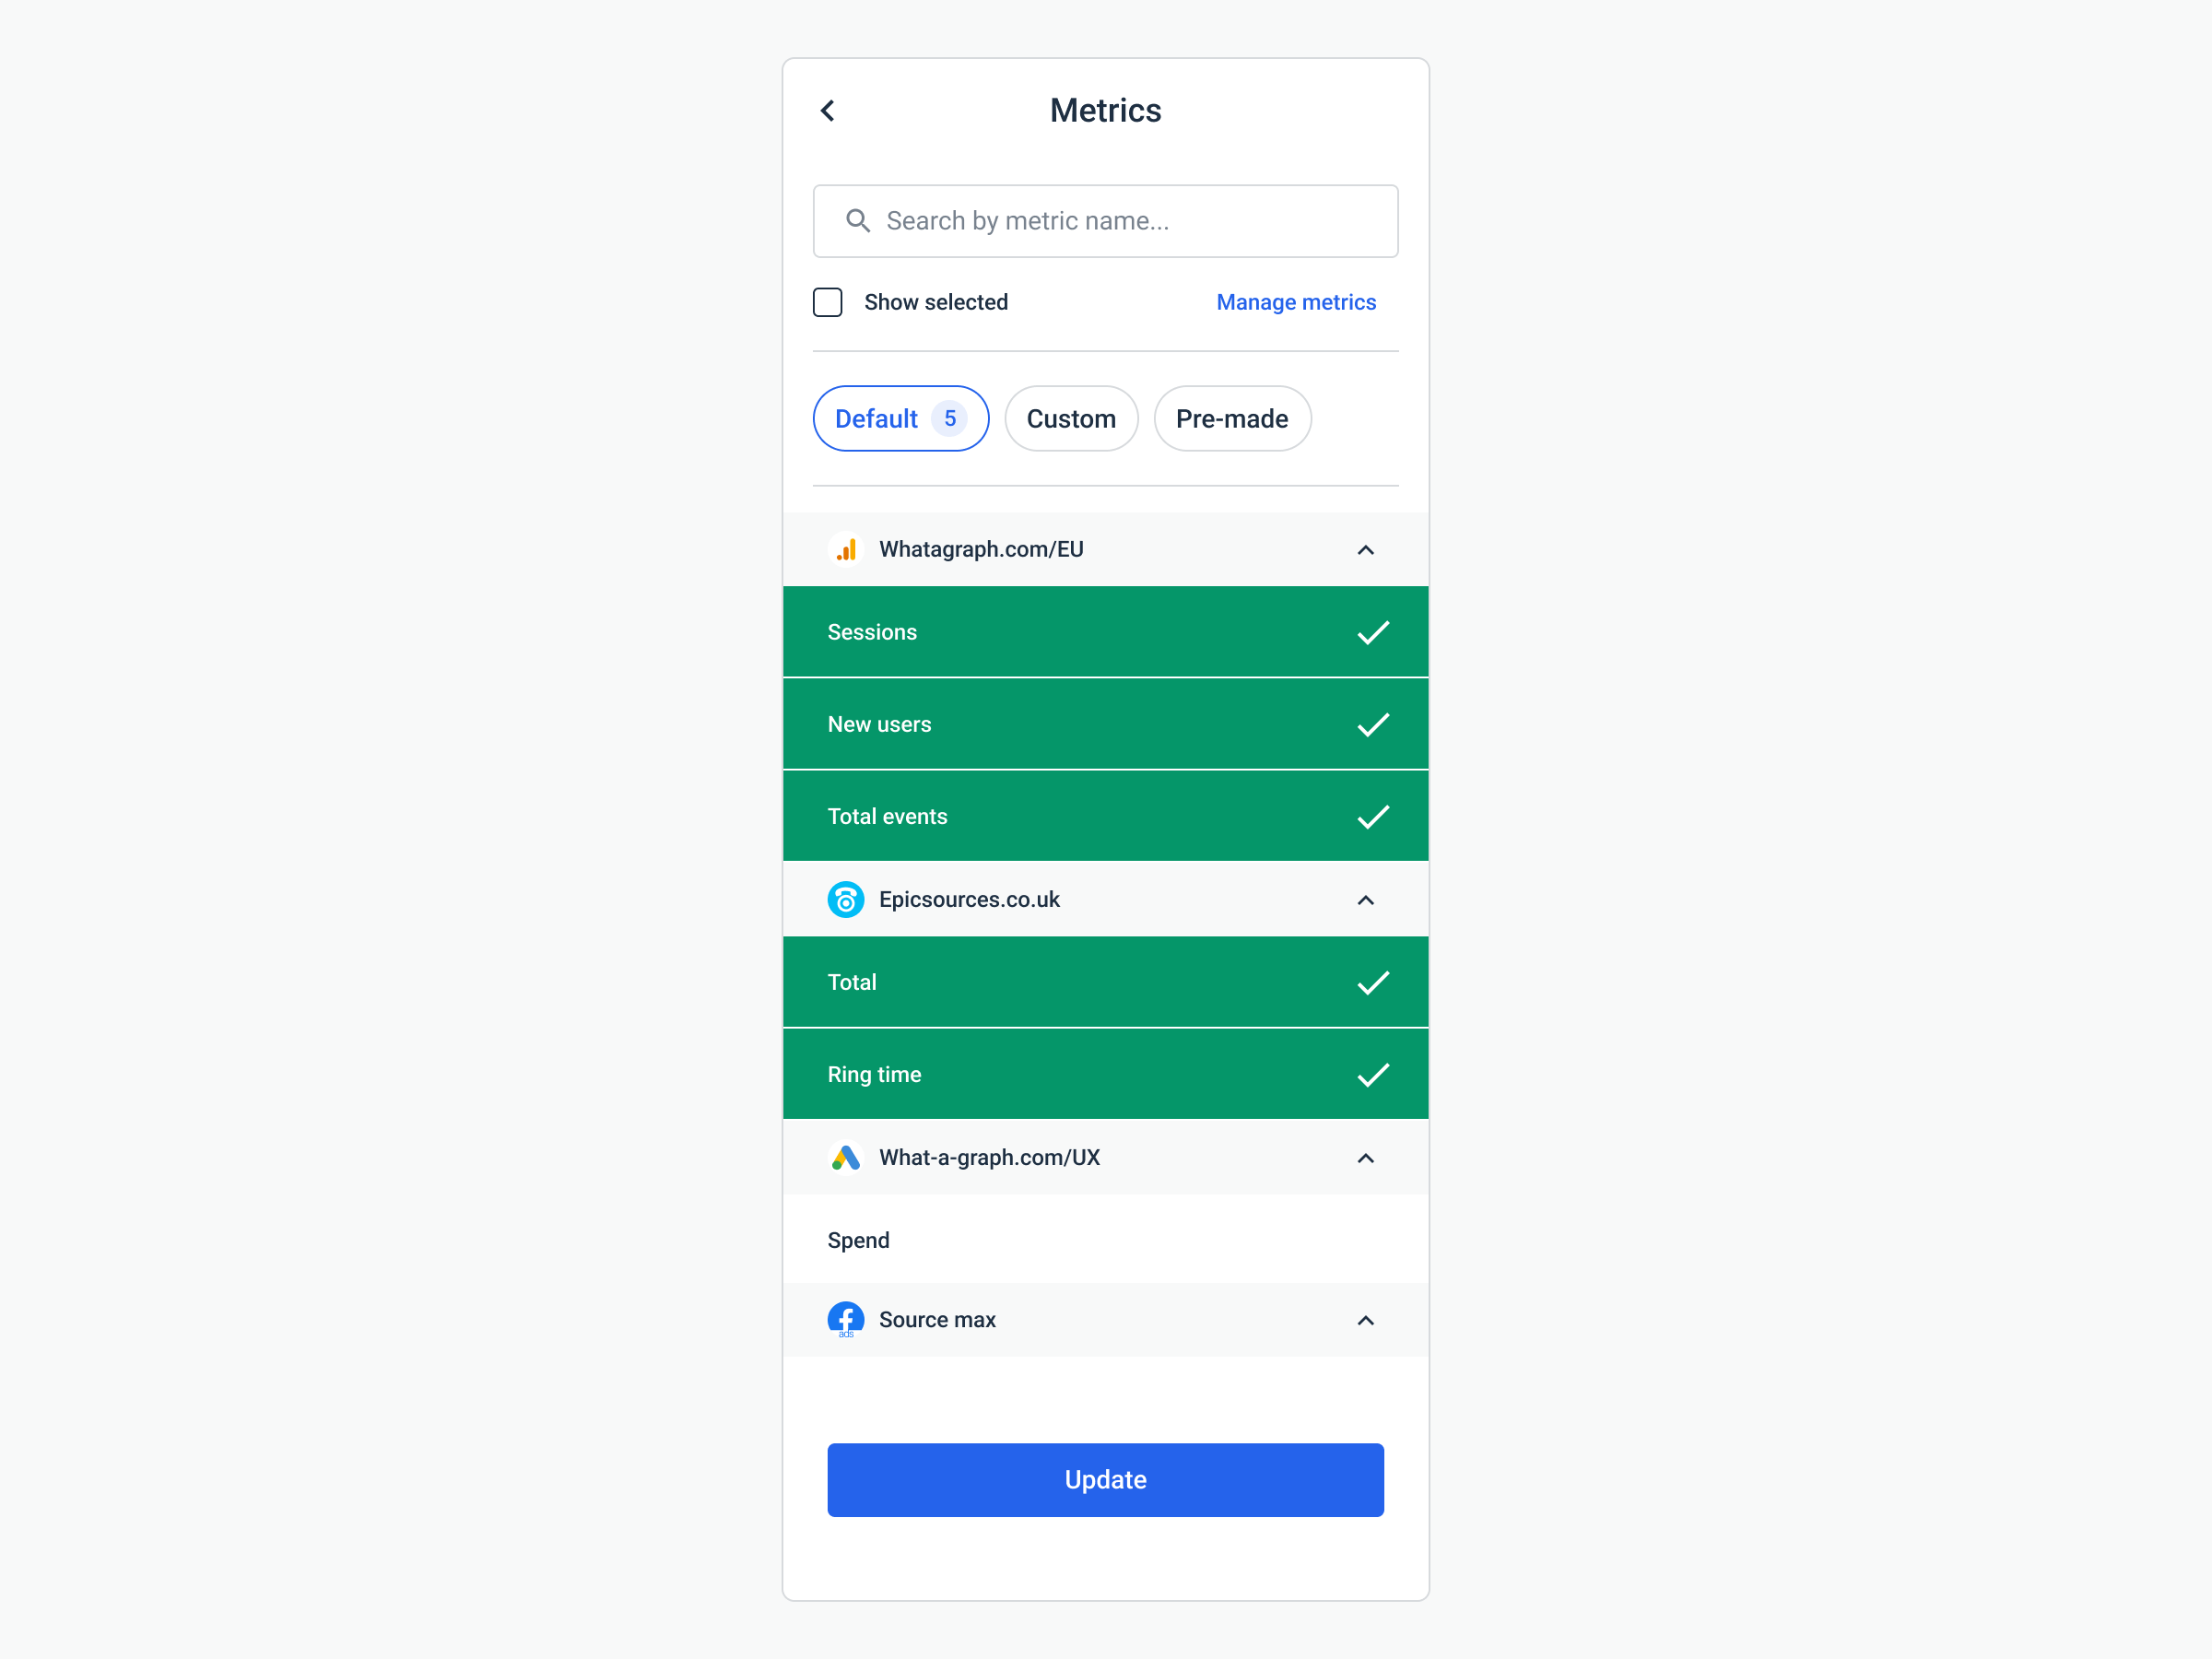
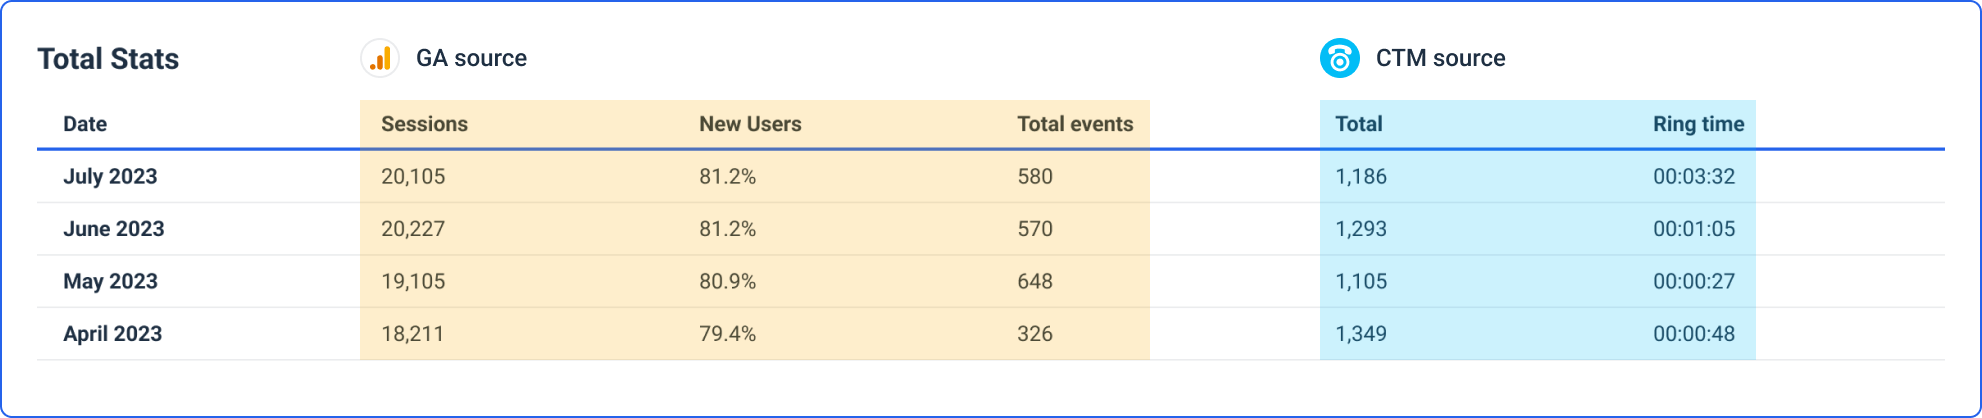
This allows us to have each column of the table representing a metric from a different source.
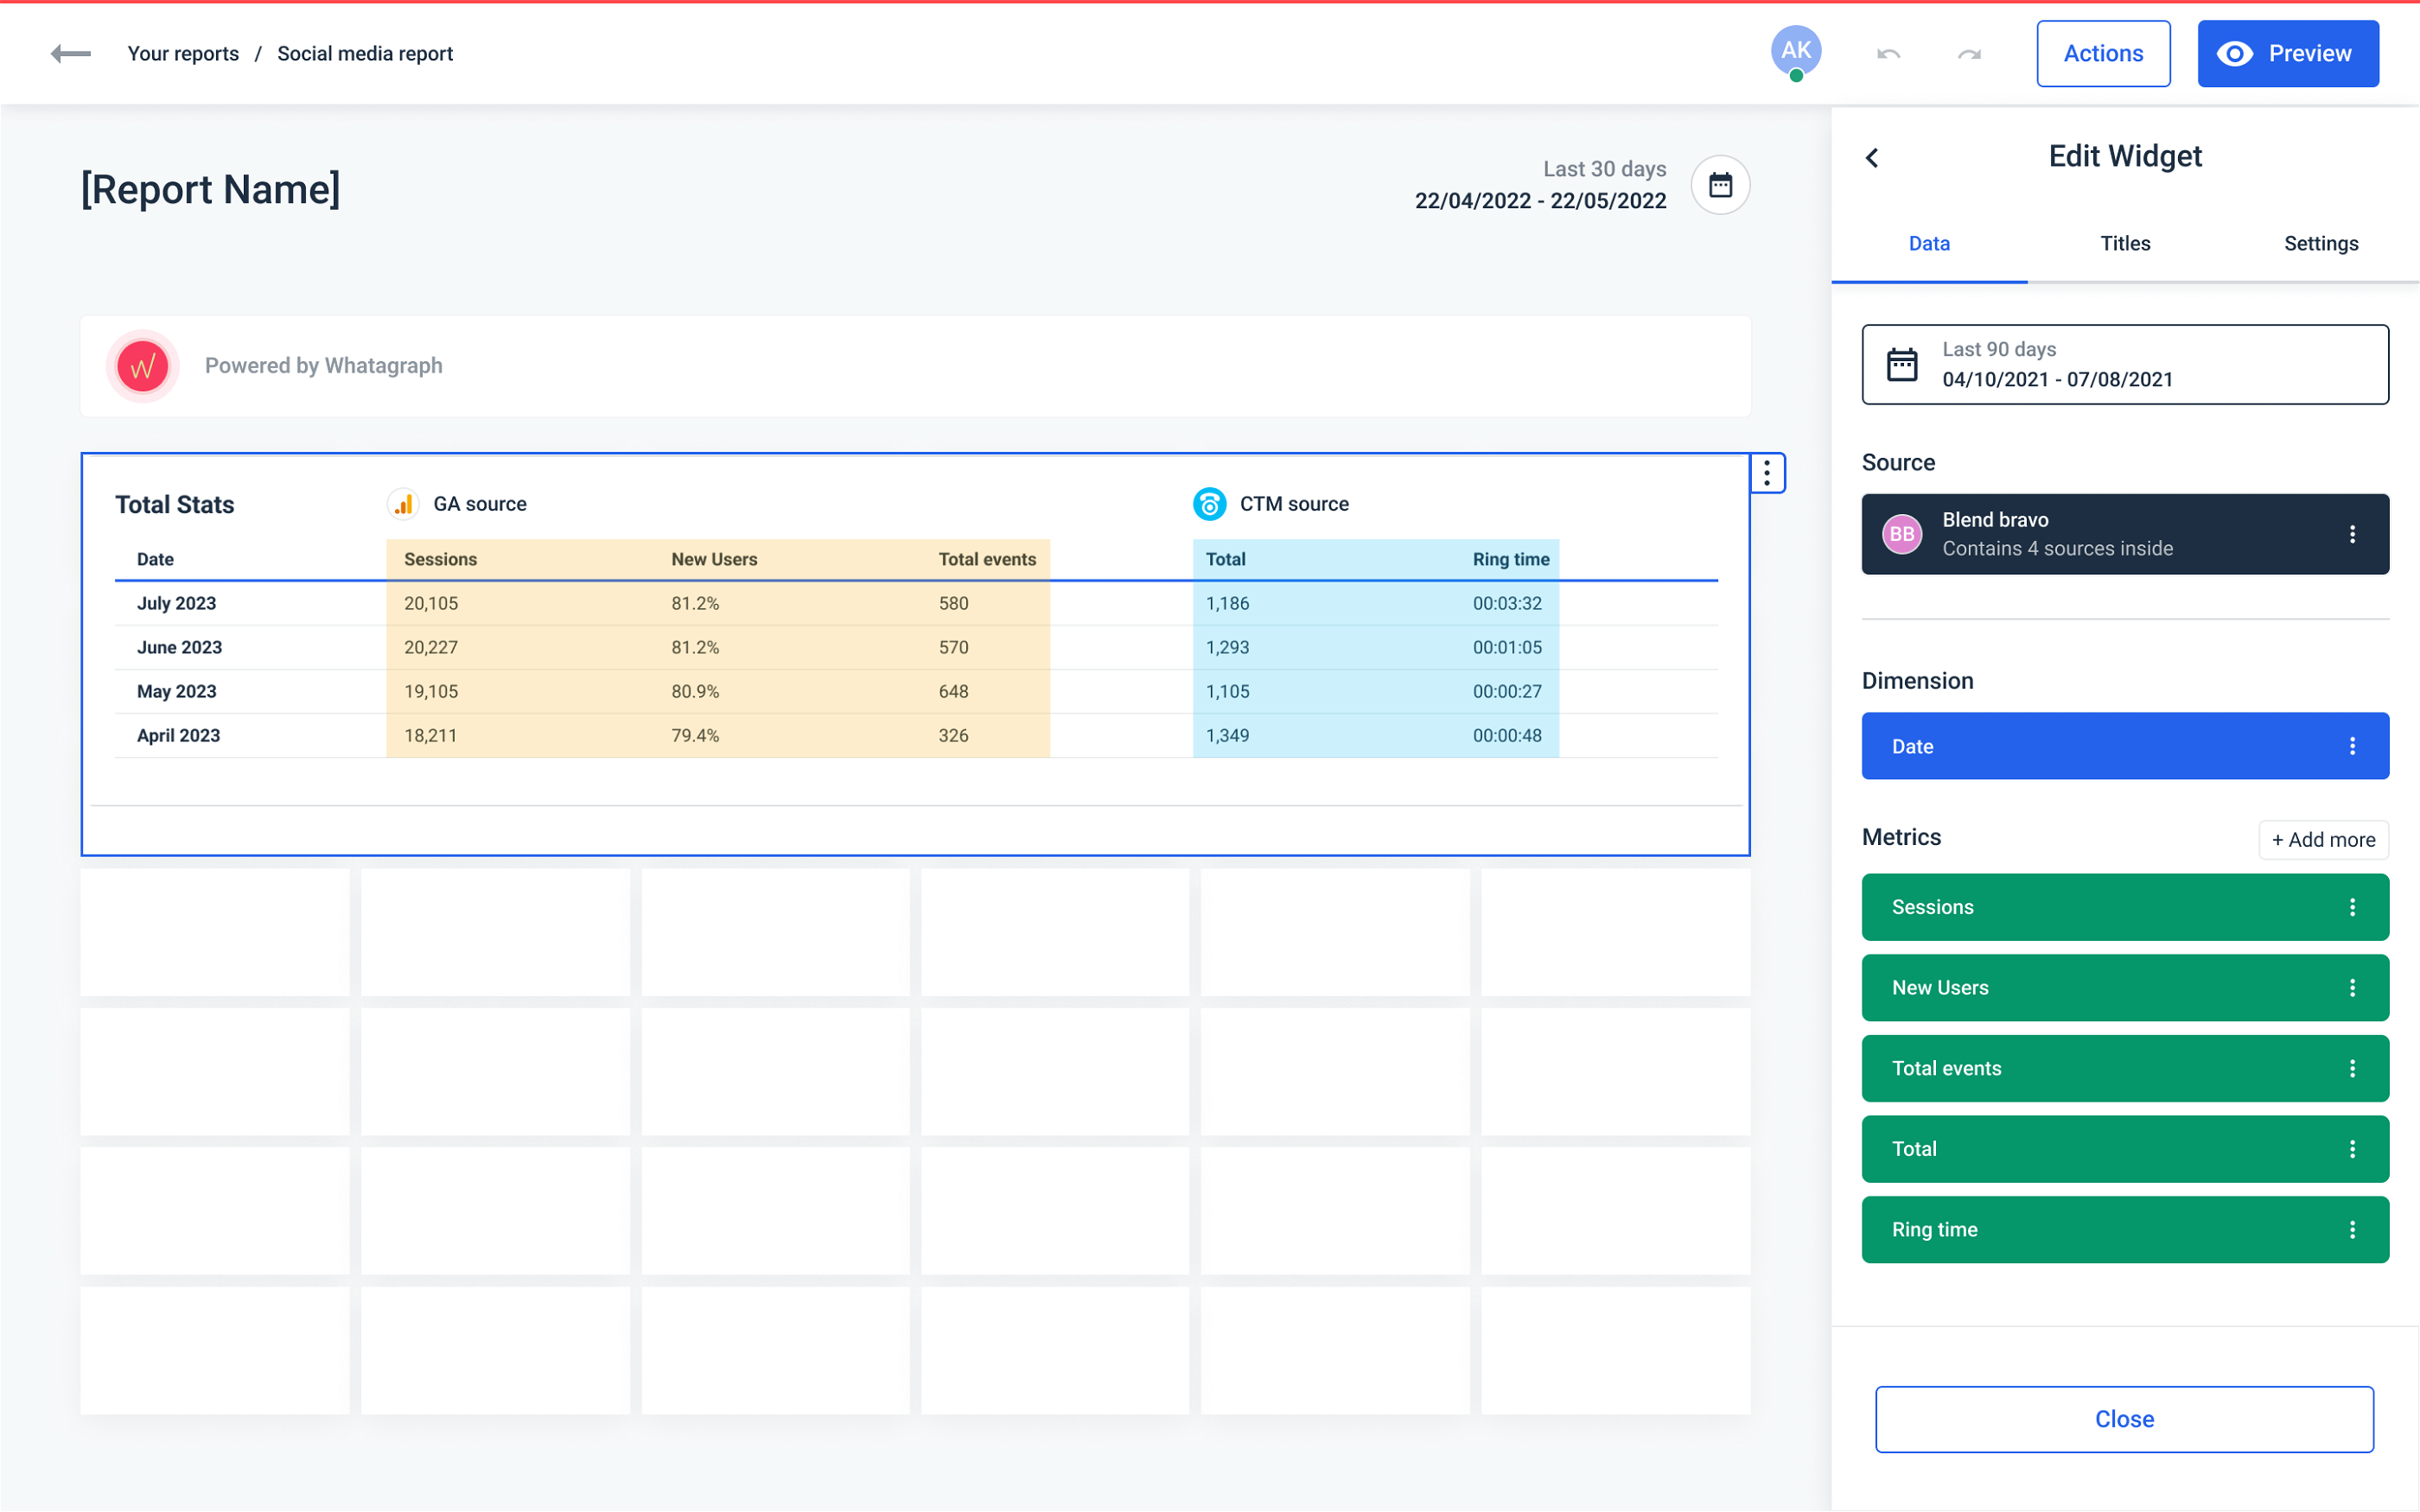
(The table highlights are not a part of the actual UI)
Moving on to another useful data blending use case.
Use a cross-channel calculation in the table overview
Goal: To create a cross-channel metric calculation in the table widget that we could display next to standard metrics.
Additionally, we want this metric to be reusable in other widgets or dashboards without us having to recreate it each time.
Finally, we want to be able to edit such a metric from one place, and the changes to take effect on all areas where it’s used.
- Challenge 1: This is impossible with a standard table widget, as it only allows creating custom formulas from the same channel sources.
- Challenge 2: This is not possible with a multi-source breakdown table widget either, as it wouldn’t be able to visualize such a metric as a single column.
- Challenge 3: The current custom formulas are not reusable. If we make an error in the formula, we’d have to find every instance of such a formula and edit it manually.
How data blending helps:
Data blending allows us to create a single data set that contains metrics from multiple sources. We can use those metrics and create a custom-calculated metric that is specific to that blended source. We could then use that metric everywhere where we use that blended source.
Steps we need to take:
1. Create a custom metric
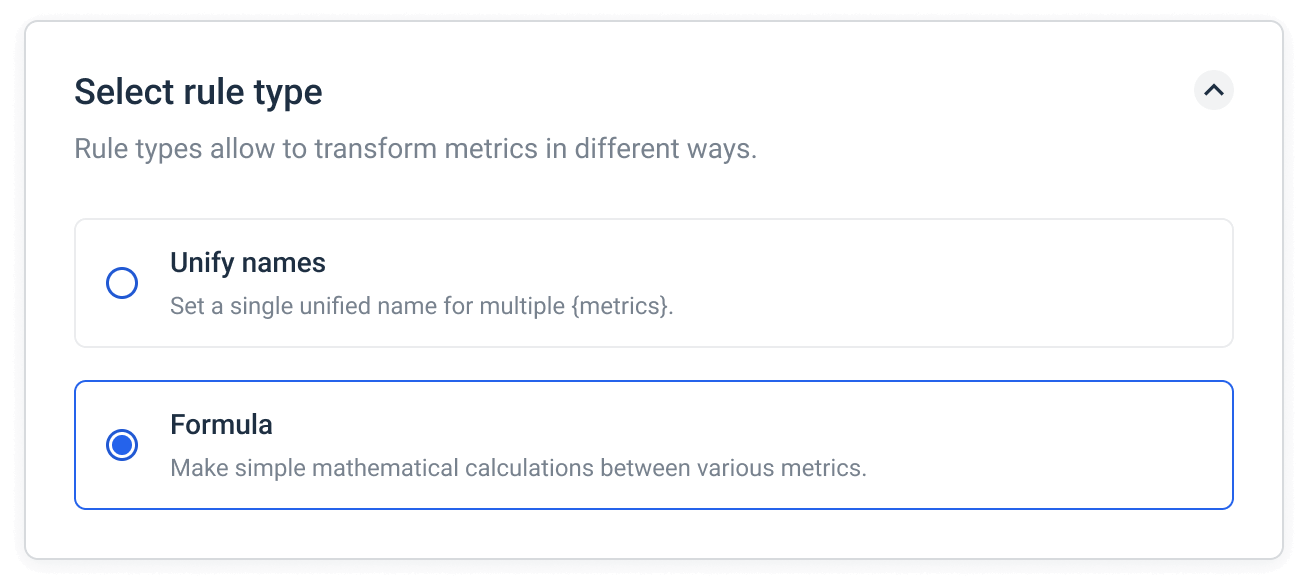
Since we already have a blended source created, we need to create a transformed metric for that blend. From the Organize environment click on Create new > Metric.
Create a name for your new metric and select the Rule type > Formula.
2. Select the transformation level
The transformational level determines whether the metric data is taken from a specific blended source or a different source selected in the report. Select Blended source.
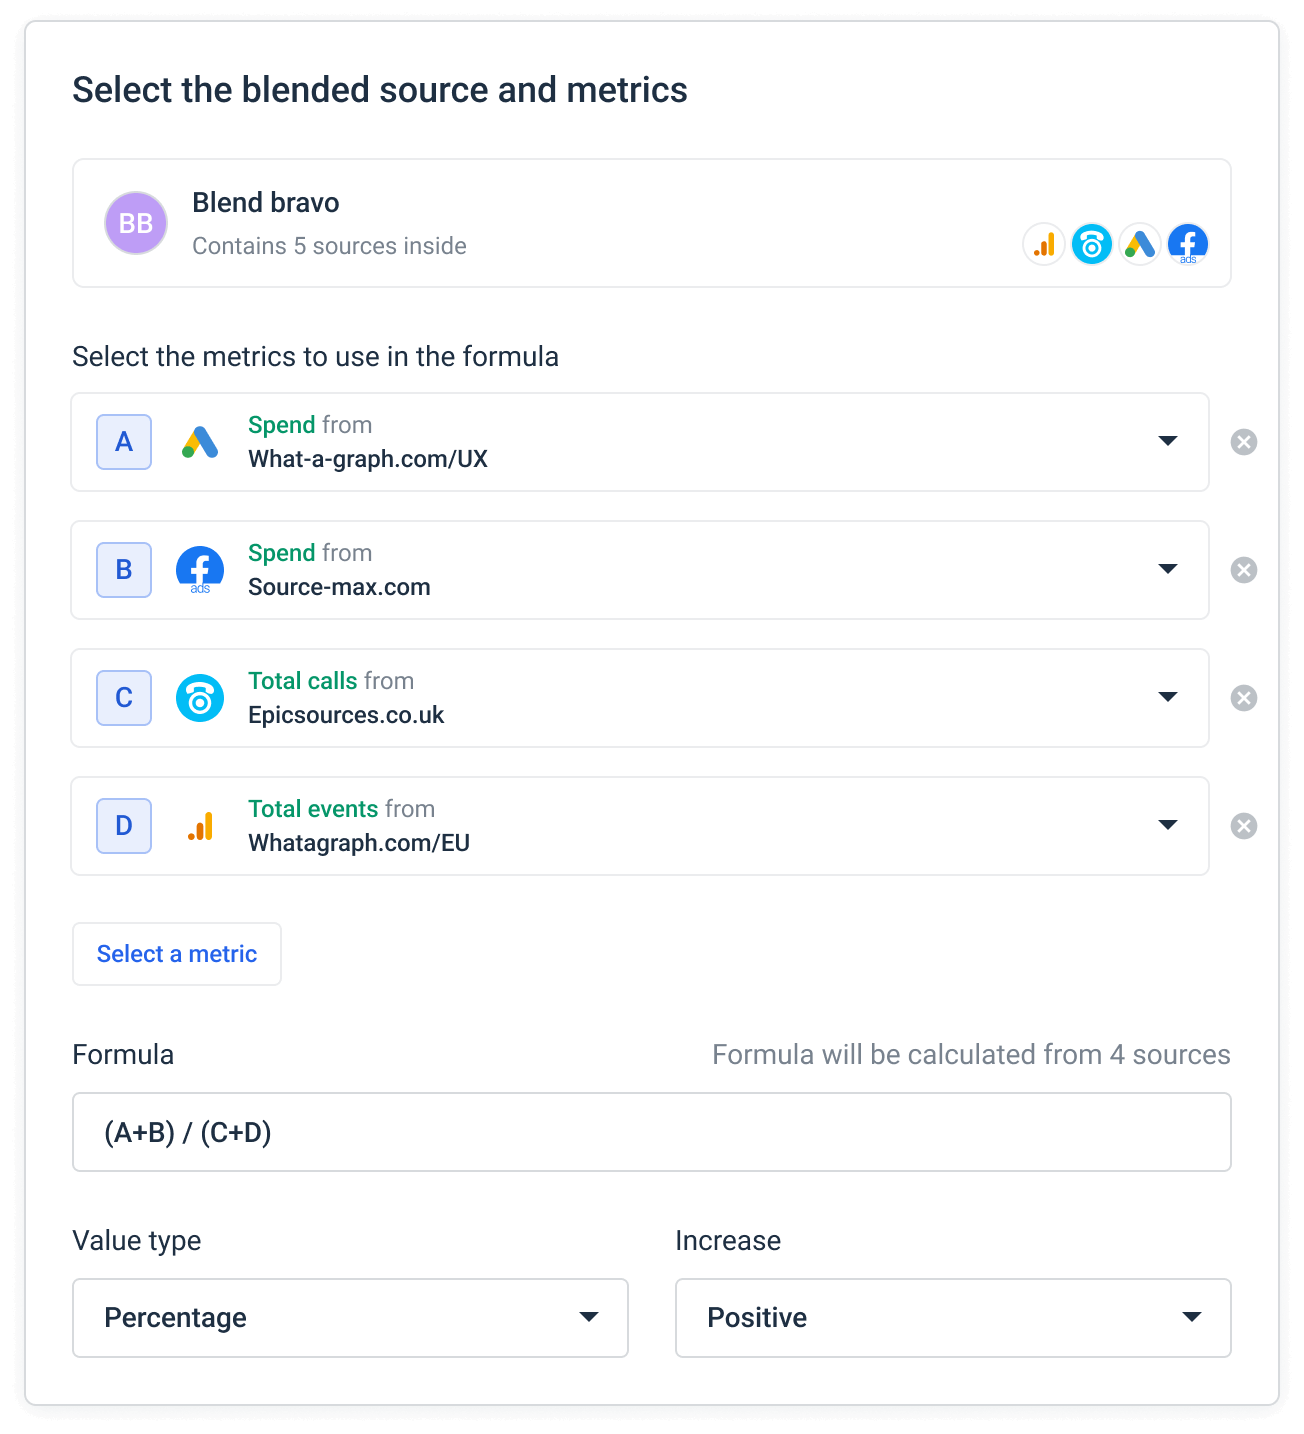
3. Create the formula
First, we need to select a blended source for which we want to create a metric. Then, select the metric we want to use in the calculation — these are the same metrics we used to create our blended source.
Once we’ve selected the metrics to use in the calculation, we can see which source each metric belongs to.
Now the only thing that remains is to type in the formula using letter labels assigned to each metric, in our case (A+B) / (C+D):
After completing these steps we have a metric that is calculated from multiple sources. If you want to make any changes to it, those changes will affect all the widgets where you use it.
In reports, you can use the metric in any widget where you have added your blended source.
Open the metric selection list and go to the Custom tab.
At the top of the list, we can see calculated metrics we created specifically for this blended source. The CPL metric is one of them.
After selecting all the needed metrics we can add them to the table.
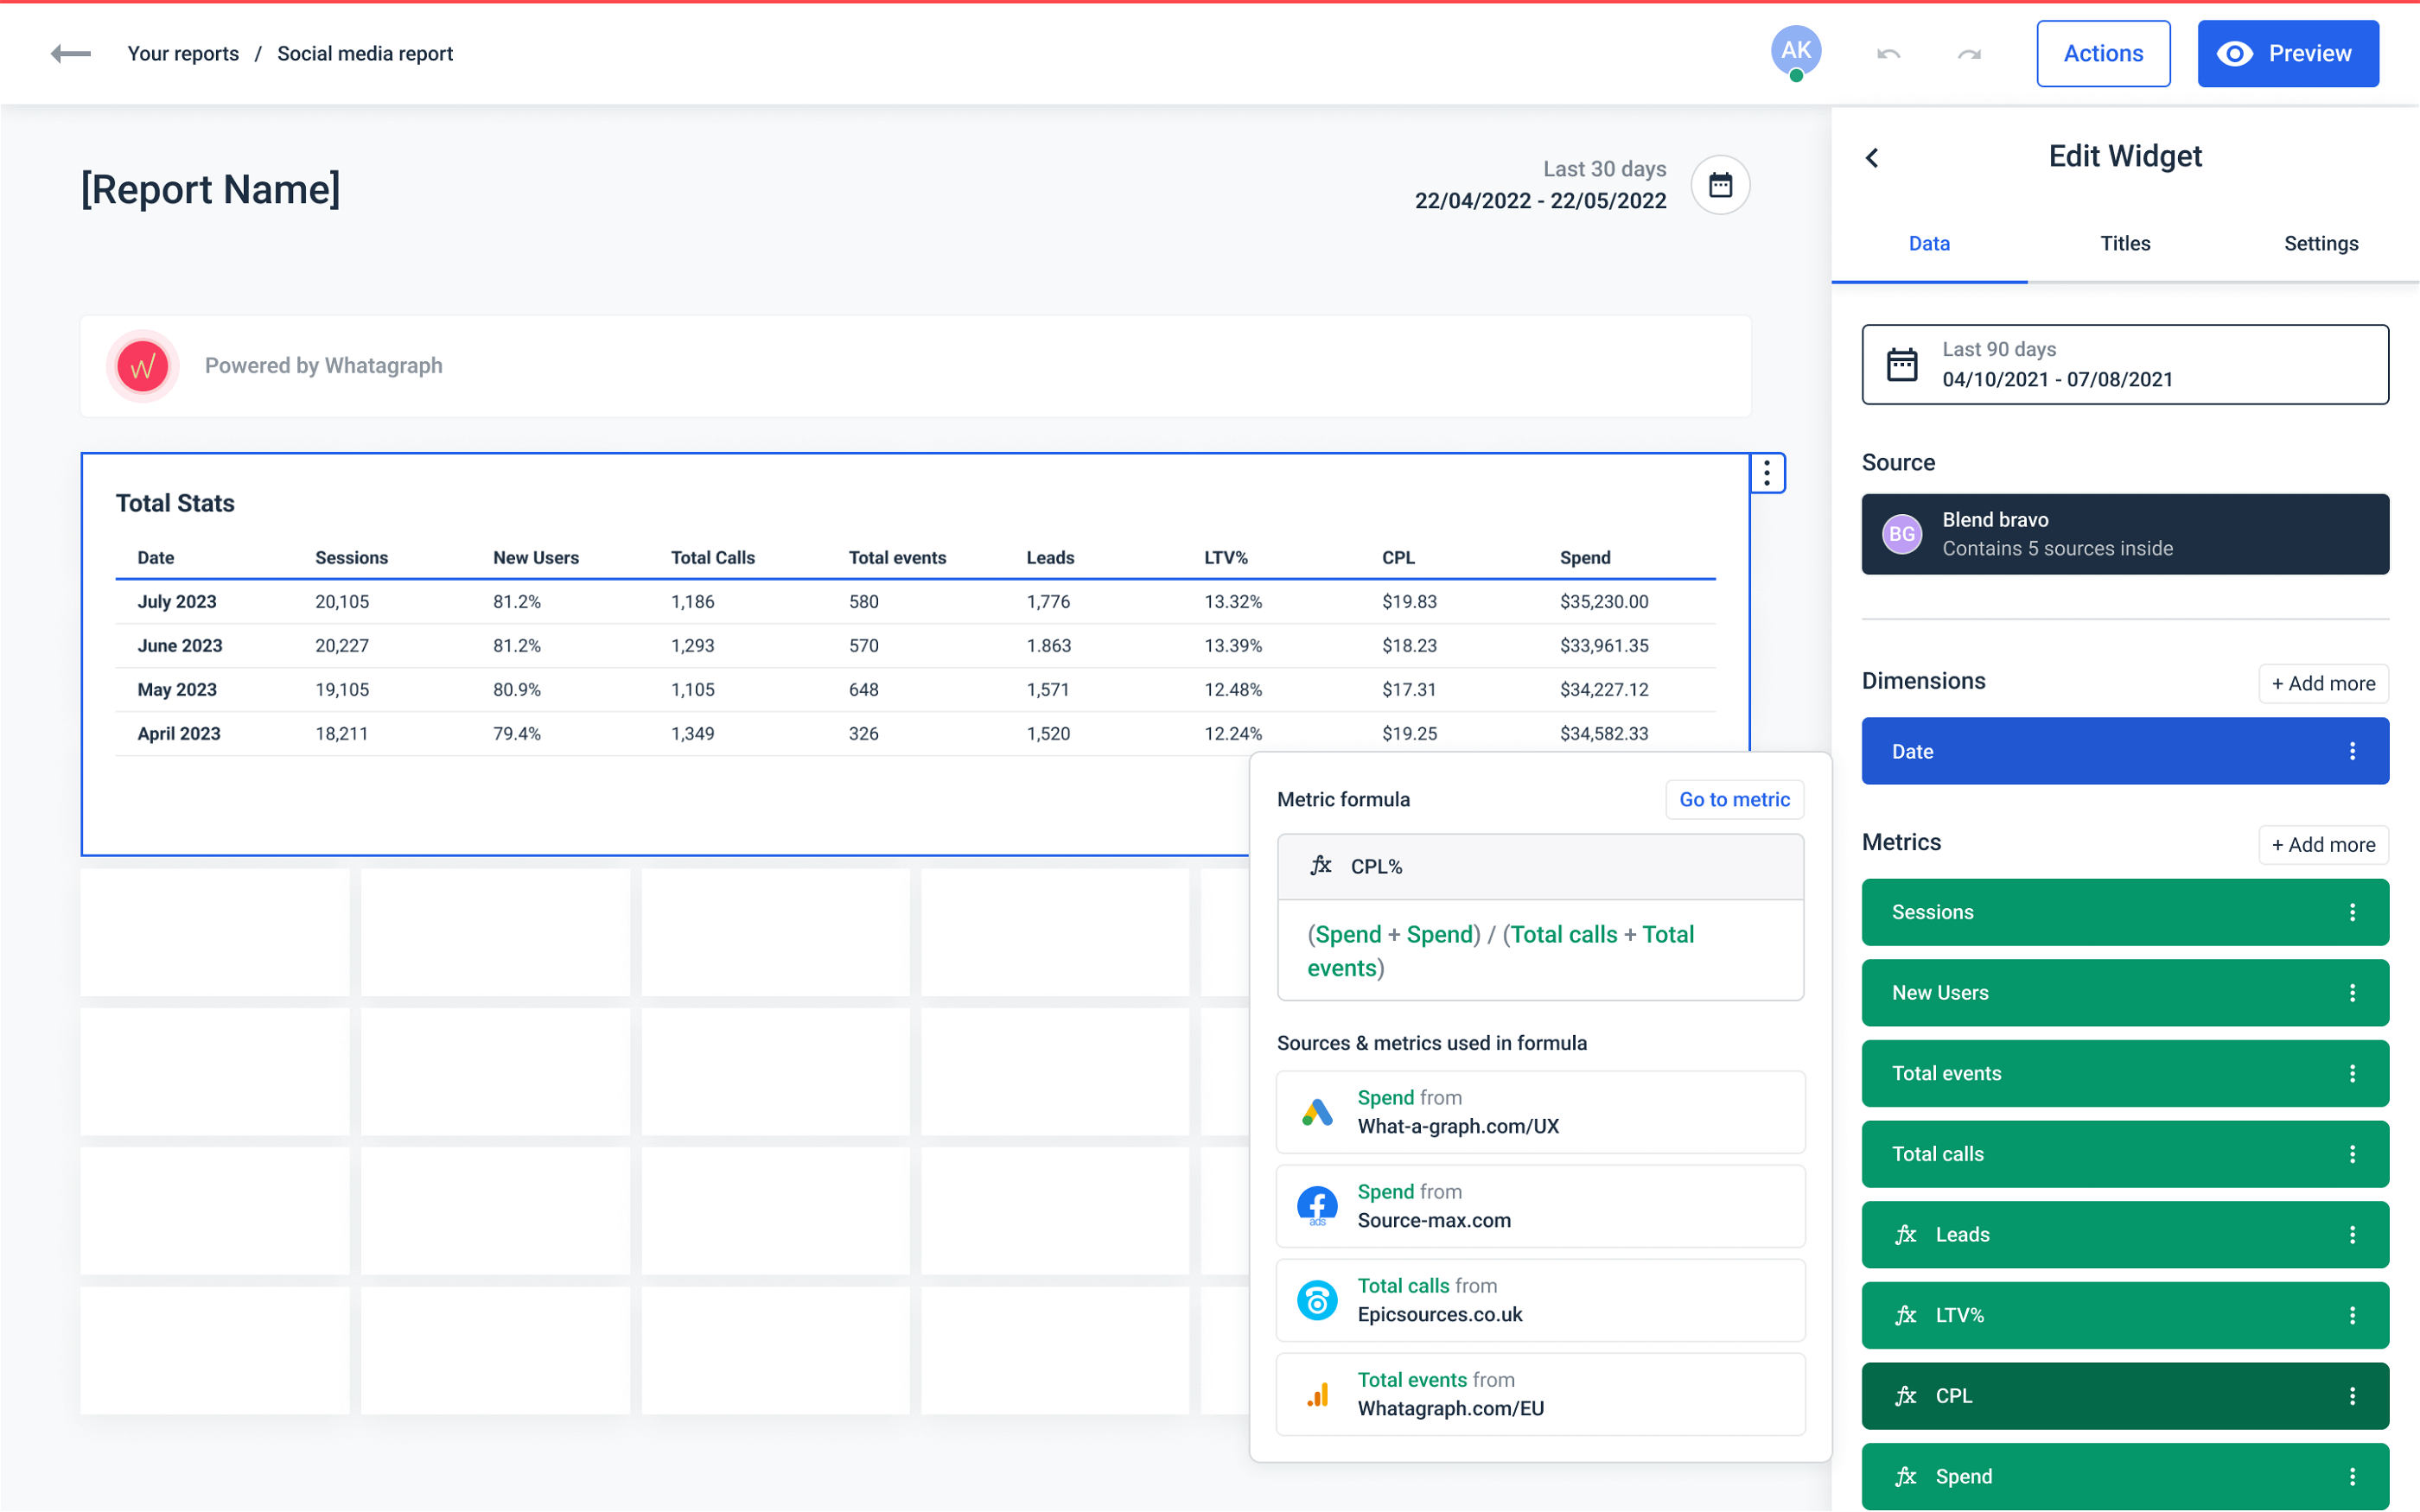
From here, we can also see what formula and metrics we used inside the calculation.
Using these two workflows, you can easily cover a range of data blending use cases in in-house or agency marketing scenarios.
Let’s mention a few of them.
Scenario 1: Present how many times your ads were shown across all channels.
Goal: Show total impressions and reach your ads received on Facebook, Instagram, and Google.
Using Whatagraph’s intuitive marketing data transformation function, we can easily get the totals:
- From the Organize environment click on Create new > Blended source.
- Add your Facebook, Instagram, and Google sources.
- Select Year, month as the dimension and Impressions and Reach as metrics for all sources.
- Select the full outer join and pick the common dimension for all sources.
- Name your blend and click Create a blend to blend your data.
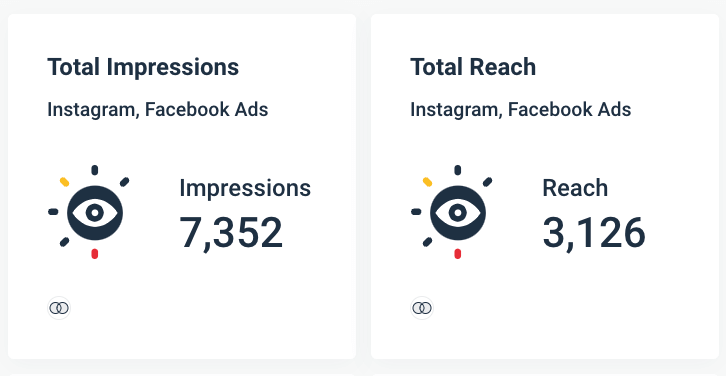
You’ve created a blended source that you can use in single-value widgets or tables to show the total impressions and reach of your ads on three different marketing channels.
Scenario 2: Present how much marketing budget was spent on all your campaigns combined
Goal: Show the total marketing budget spend on Google Ads and Facebook Ads combined
Again, we start from the Organize environment:
- Click Create new > Blended source.
- Add your Facebook Ads and Google ads as sources.
- Select Year, month as the dimension, and Amount spent from Facebook Ads and Cost from Google Ads as metrics.
- Select the full outer join and pick the selected dimension for all sources
- Name your blend and click Create a blend.
- Create a rule that would unify the names of these two metrics into one.
- From the Organize environment click Create new > Metric.
- Give the metrics a name — Ad spend.
- Choose the Rule type > Unify names and the Rule level > Channel level.
- In Selected channels & fields, choose Facebook Ads > Amount spent, Google Ads > Cost.
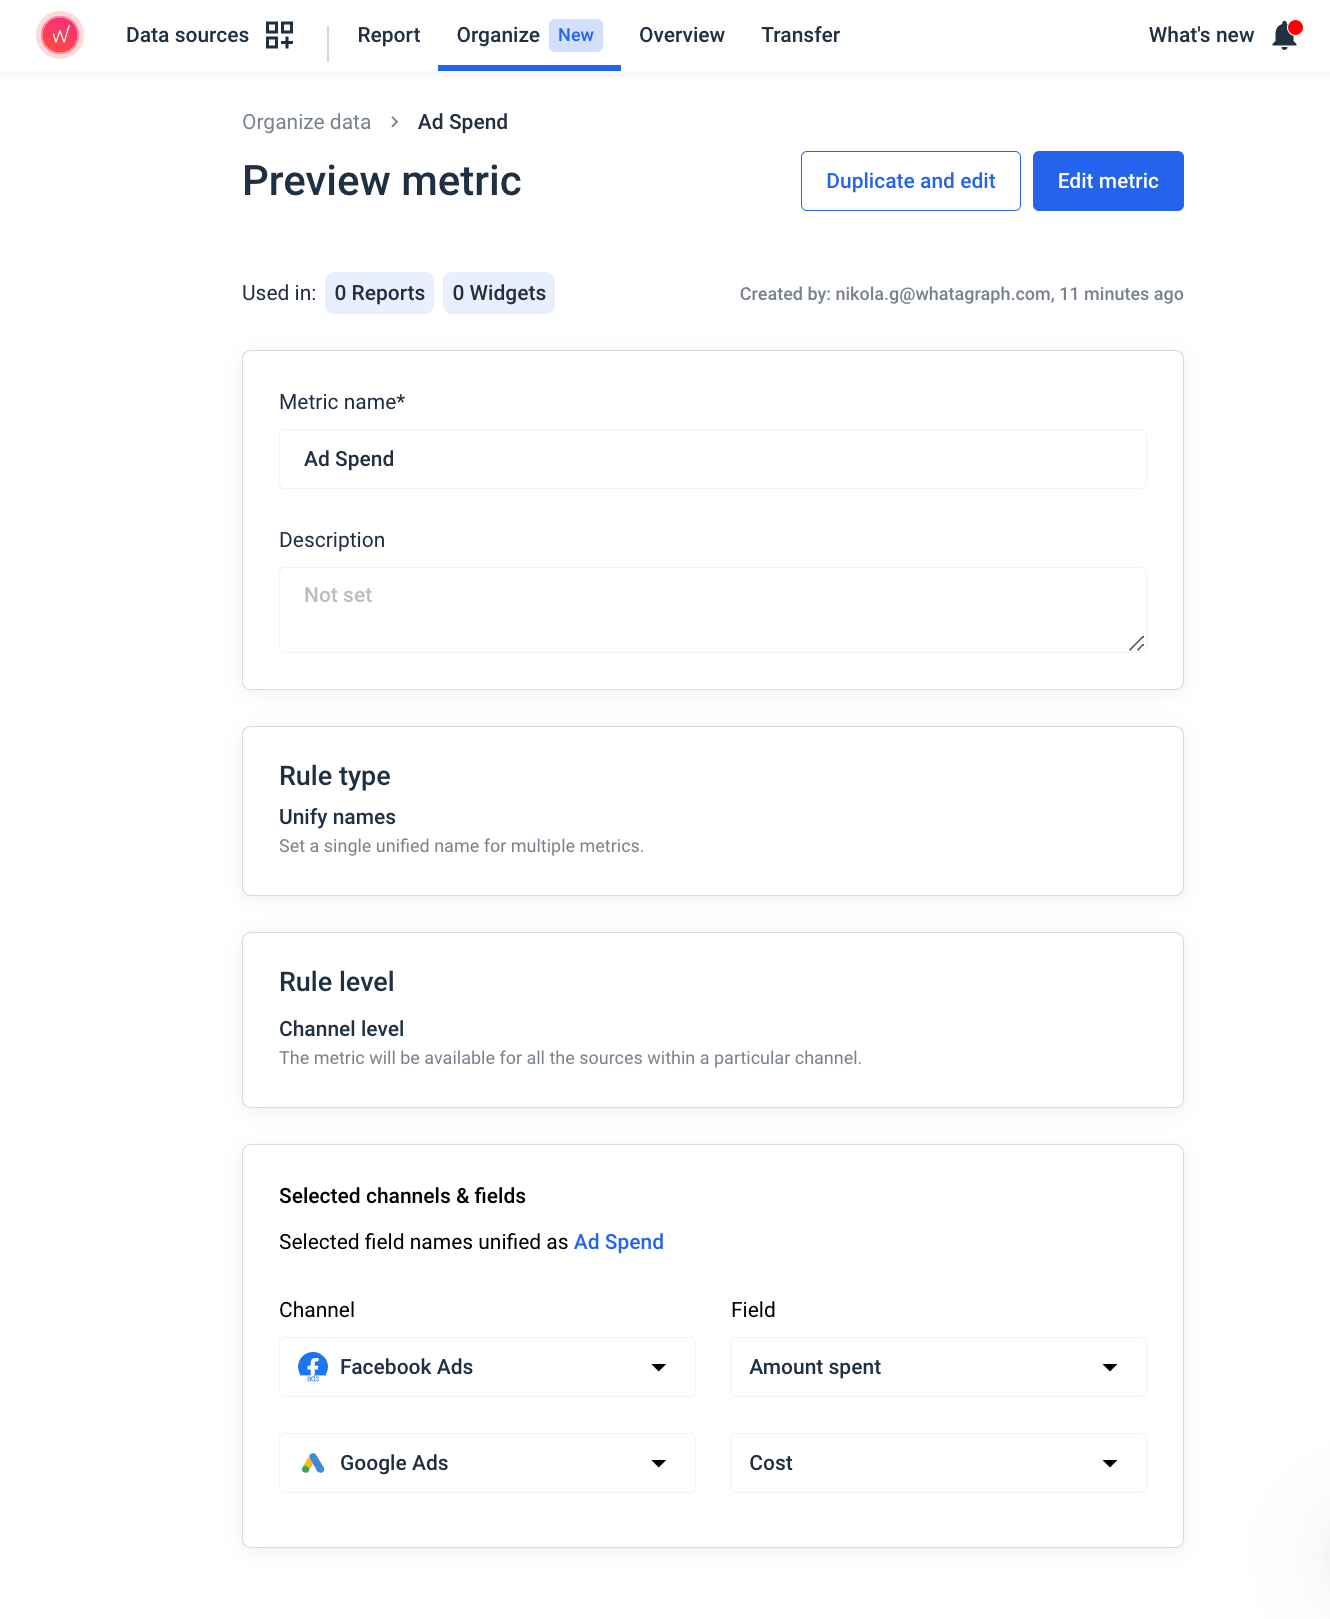
You have created a new metric that you can use in reports in widgets with Facebook Ads and Google Ads blended source to show your total spend.
Benefits of data blending
Data blending has many advantages over other types of operations to combine data, e.g. data integration. It shouldn’t be a surprise then that an easy way to blend data has become one of the key requirements for agencies when choosing a marketing data platform.
Granular view of the customer journey
Data blending processes allow marketers to connect the dots between different marketing channels and customer behavior. By blending data from various sources, including Google Analytics, social media, and CRM marketing systems, you can gain a holistic view of customer interactions. This knowledge helps you create personalized marketing strategies that resonate with your target audience.
Improved campaign performance
By identifying trends and patterns in data, you can optimize your or your client’s campaigns to reach the right audience at the right time, with the right message. Such a holistic approach to marketing strategy reduces marketing waste and increases ROI.
Identify new market segments
Finally, blended data allows you to identify and explore new market segments. By analyzing demographics, psychographic, and behavioral data blends, you can discover hidden customer segments and approach them accordingly.
All in all, cross-platform data blending provides you with means to drive more effective and efficient marketing strategies. A unified view of data is a source of insights that lead to better decision-making and, consequently, improved business performance.
Challenges in data blending
Although data blending is a popular and powerful marketing data analytics practice, there are few challenges in data blending that you should keep in mind while looking for an ideal solution.
Depth of insight
Once the number of different data sources begins to increase, data blending has shown to become glitchy. This is also the case if you have a large amount of data within a single source, such as thousands of new users in a month.
When that starts to happen, it might indicate that your data blending use case is more suited to data integration. You should also ask yourself, whether your blended data analysis has become too complex, and whether it justifies the additional time and money to make it more advanced.
Control
Depending on the data transformation tool you use, you may not control all your data sources. Data from Google or Meta might be accurate, however, any inconsistencies from an outside data source may creep into your blend and need special attention. Also, if a source doesn’t easily aggregate key data you want to blend, you’ll need to solve that before creating the blend.
When blending data sources in Looker Studio, for example, these inaccuracies are hard to notice. They usually result from how Looker Studio creates tables for your blend — querying data for each table before joining them into the final blend. Any data ranges, filters, or calculated fields on your tables before the join can affect the accuracy of your blend.
Processing blended sets
Data blending allows you to analyze cross-platform data, however, exporting the new data set to a business intelligence tool such as Microsoft Power BI is more complicated. You may need to use additional, specialized software or employ a data analyst. But at that point, you’re moving away from the agency-minded usage of data blending. In Whatagraph, you can export any table or other widget with a blended data source in a spreadsheet format, as Excel or CSV files.
FAQs
Why is data blending important for data analysis and reporting?
Data blending allows data analysts to include any data type or any source into their analysis for faster, deeper, business insights. Combining data from two or more sources can reveal valuable information that might otherwise remain hidden even when data is visualized in reports. When used in reports, blended data often provides a new perspective that might lead to better business decisions.
What is the difference between data blending and data joining?
Data blending allows you to combine data from multiple sources. Data joining, however, only lets you combine data from two sources, e.g. two SQL databases, and is restricted by the size of the dataset. Blending is better than joining if you want to determine if data needs to be cleansed or adjusted — for example, having null values and errors that need to be fixed.
What is better: data blending vs data integration?
Data blending is a more versatile solution that doesn’t require creating a new data set when original data sources change. If there’s a change in any of the original sources, your data visualization solution will pick up the change and update the blended source automatically.
On the other hand, data integration is an operation that physically combines multiple data into a single database or file. This can be done through data pipeline processes, such as ETL, which extracts data from multiple sources, transforms it into a common format, and loads it into a data warehouse. Data integration, it’s a much slower and process-intensive technique used for larger, more complex data combinations and is usually performed by a data scientist.
What considerations should be made when blending structured and unstructured data?
When blending structured and unstructured data, the first consideration is to prioritize data from apps that directly impact your revenue, such as CRMs.
The master data from these systems helps you orient key structured data and lays the framework for blending unstructured data through metadata.
Another consideration is to make sure that your unstructured data which comes in the form of documents, photos, videos, etc. has specific native metadata that allows you to link unstructured to structured data.
Streamline your data blending process with Whatagraph
Fast-moving agencies require accuracy and speed in both data organization and reporting. This is why data blending in Whatagraph is handled within the same environment where you visualize your data.
No going back and forth between tools or modules.
Blend any data source you have and create custom metrics for it to get the most out of your data and make right decisions fast.
Sign up for a free trial and start blending your data with minimal effort and zero room for error.
Published on Mar 25 2024
WRITTEN BY
Nikola GemesNikola is a content marketer at Whatagraph with extensive writing experience in SaaS and tech niches. With a background in content management apps and composable architectures, it's his job to educate readers about the latest developments in the world of marketing data, data warehousing, headless architectures, and federated content platforms.