


What to Include in an Ecommerce Report Template
Based on ecommerce reports built by marketers on Whatagraph, a strong ecommerce report template should answer one core question:
Is our marketing driving profitable growth for the online store, and where should we act next?
The structure below balances executive clarity with channel-level depth, replacing fragmented reporting tools, Google Sheets, and Looker Studio dashboards with one unified, automated view.
1. Overview
This section gives stakeholders a fast health check of overall ecommerce performance across all paid channels. It’s designed so founders, executives, and clients can understand results at a glance before diving deeper.
What to include
- KPI tiles / widgets
- Total ad spend
- Total revenue
- ROAS
- Conversion rate
- Average order value
- Charts
- Trend line: ad spend vs total revenue
- Bar or stacked chart: revenue by marketing channel
- Breakdowns
- Facebook Ads, Google Ads, TikTok Ads, LinkedIn Ads, Pinterest Ads
- Text blocks
- Performance summary
- Key wins, losses, and recommendations
2. Facebook Ads
This section focuses on how paid social contributes to revenue, customer acquisition, and ROAS.
What to include
- Metrics
- Ad spend, clicks, impressions
- Conversion rate, purchases, revenue
- ROAS and customer acquisition cost
- Charts
- Spend vs revenue trend
- ROAS by campaign
- Tables
- Top campaigns by revenue and ROAS
- Underperforming campaigns by cost
3. Google Ads
This section shows how high-intent traffic from search drives ecommerce revenue.
What to include
- Metrics
- Spend, clicks, CPC
- Purchases, revenue, ROAS
- Conversion rate by campaign
- Charts
- Revenue and ROAS trends
- Tables
- Top-performing campaigns and keywords
- Campaign performance by device or country
4. LinkedIn Ads
This section is especially relevant for higher-AOV or B2B-leaning ecommerce brands.
What to include
- Metrics
- Spend, impressions, clicks
- Conversions and revenue (where applicable)
- Charts
- Spend vs conversion trend
- Tables
- Campaign-level performance
5. TikTok Ads
This section highlights how short-form video drives discovery, demand, and sales.
What to include
- Metrics
- Spend, impressions, clicks
- Purchases, revenue, ROAS
- Charts
- Spend vs revenue over time
- Tables
- Top-performing TikTok campaigns
6. Shopify
This section connects marketing activity to actual store performance using Shopify data.
What to include
- Metrics
- Total revenue
- Orders and conversion rate
- Average order value
- Charts
- Revenue and orders over time
- Tables
- Top products by revenue
- Products impacting AOV
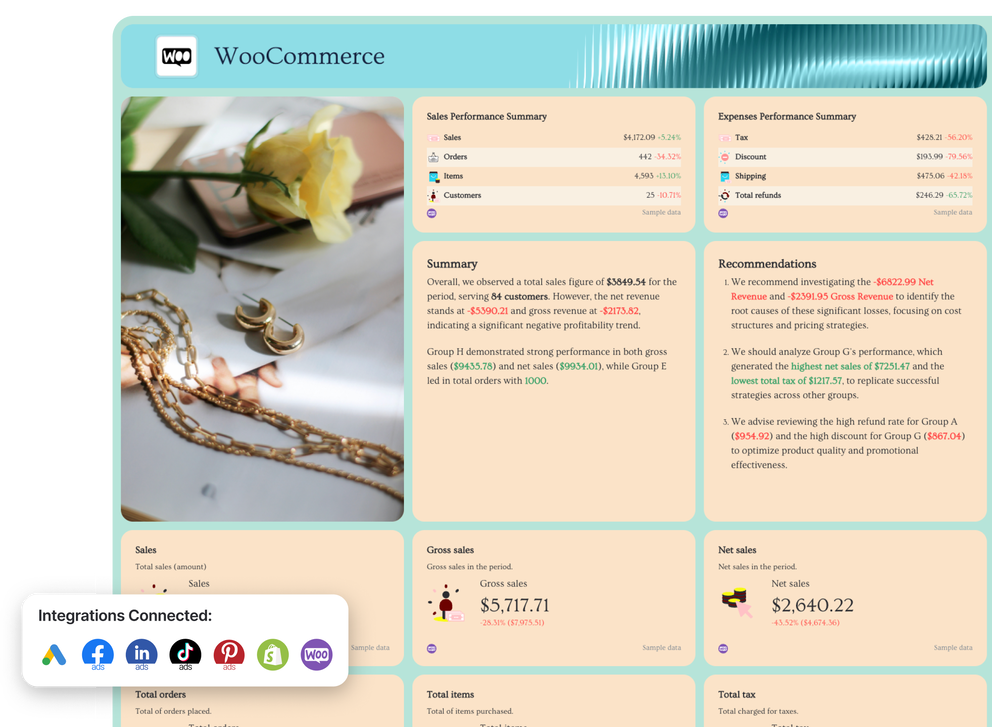
7. WooCommerce
For brands running on WooCommerce, this section mirrors the Shopify view with platform-specific data.
What to include
- Metrics
- Revenue, orders, conversion rate
- Refunds (if available)
- Charts
- Revenue trends
- Tables
- Best- and worst-performing products
Why This Ecommerce Report Template Structure Works
This structure helps teams:
- Replace fragmented analytics reports with one ecommerce dashboard
- Pull trusted ecommerce data from GA4, ad platforms, and commerce tools
- Automate recurring reporting with real-time updates
- Turn raw metrics into actionable insights
- Align marketing strategies with revenue, retention, and growth
Whether you’re running a single ecommerce business or managing dozens of clients, this template supports clarity, scale, and confident optimization.


