


What Should a Mailchimp Report Template Include
Based on hundreds of Mailchimp reports created by marketers and agencies on Whatagraph, here’s what actually belongs in a Mailchimp report template, and what doesn’t.
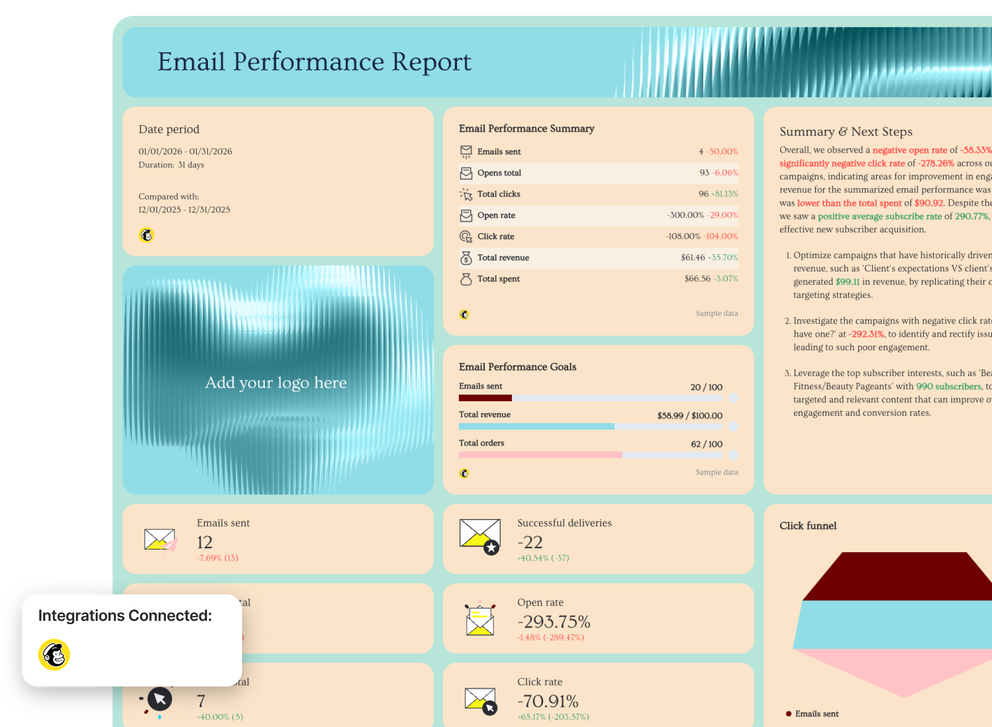
1. Top-line email performance metrics
Start with a high-level snapshot of your email marketing performance for the selected period.
This section should answer one question fast: Is email performing better or worse than last period?
Include individual widgets showing Mailchimp data metrics like:
- Emails sent
- Successful deliveries
- Total opens
- Total clicks
- Open rate
- Click rate (CTR)
- Unsubscribe rate
- Bounce rates
- Total revenue from email
- Total spend (if applicable)
Best practice: show period-over-period change on every KPI so trends are immediately clear.
2. Goals And Targets
High-performing teams always report against goals.
Include simple goal widgets for:
- Emails sent
- Revenue from email
- Orders or conversions
This keeps reporting focused on outcomes, not activity.
3. Written Summary And Next Steps
This is the most overlooked, and most valuable, part of a Mailchimp report.
Start (or end) every report with:
- A short performance summary in plain language
- 2–3 concrete next steps based on the data
This turns your Mailchimp dashboard into a decision-making tool instead of a static report.
4. Email Engagement Funnel
A Mailchimp report template should always include a visual email funnel.
This turns raw Mailchimp data into a story stakeholders understand.
Recommended funnel stages:
- Emails sent
- Delivered emails
- Opens
- Clicks
- Conversions or purchases
- Conversion rate
This view helps teams optimize subject lines, content, and landing pages instead of guessing what’s broken.
5. Campaign Performance Breakdown
This is the most actionable part of any Mailchimp campaign report.
Use a table or expandable section showing individual email campaigns with:
- Opens total
- Clicks total
- Click rate (CTR)
- Unsubscribes
- Hard and soft bounces
- Revenue per campaign
This lets you quickly spot:
- High-performing campaigns to replicate
- Underperforming sends hurting engagement
- Revenue-driving campaigns worth scaling
6. Revenue & ROI From Email
A modern email marketing dashboard shouldn’t stop at engagement metrics.
If you’re running e-commerce or lead generation campaigns, include:
- Total email revenue
- Total spend
- Average order revenue
- Revenue trend over time
This connects email marketing efforts to real business outcomes, not just opens and clicks.
7. Audience Growth & List Health
Stakeholders care just as much about list quality as campaign performance.
Include:
- Total subscribers
- New subscribers over the period
- Unsubscribed total
- Hard and soft bounces
- Subscriber growth trend
This shows whether your email marketing strategy is growing your audience.
8. Audience Insights (Segmentation That Matters)
This section turns raw audience data into insight.
Recommended data visualization widgets:
- Top subscriber interests
- Active subscribers by segment
- Opens by country or region
This helps teams:
- Personalize future campaigns
- Identify high-performing segments
- Adjust send times and content by region