Constant Contact Connector
Looking for an easy way to report on your Constant Contact campaigns? Try our no-code Constant Contact connector.
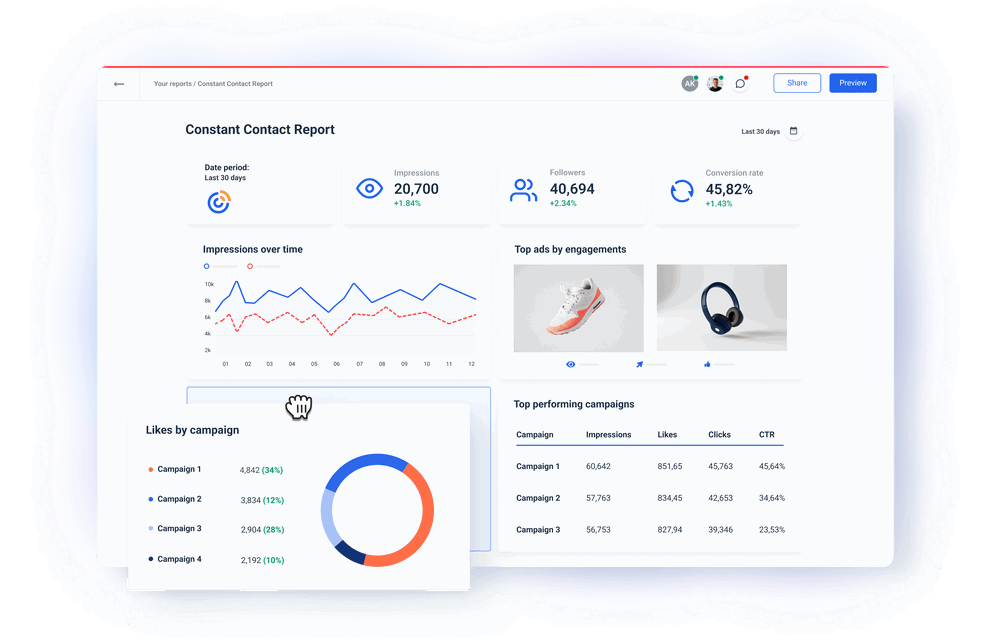
See all your key metrics on one dashboard and stay on top of your campaigns.
Share white-labeled reports with clients or the C-Suite. No third-party tools needed.
All-in-One Marketing Data Platform for Constant Contact Data

Pull all Constant Contact Metrics into your Reports and Dashboards
Constant Contact Metrics Available Instantly in Whatagraph
All
Constant Contact Contact Summary
7Constant Contact Email Summary
10Search...

Total Contacts
Explicit Contacts
Implicit Contacts
Pending confirmation
Subscribed
Unsubscribed
New subscribers (last 30 days)
Sends
Opens
Clicks
Forwards
Optouts (Unsubscribes)
Abuse (spam)
Bounces
Non-Opens
Open Rate
Click Rate
Check out related integrations:


Pick a Template and Start Reporting
View All TemplatesNo credit card required


Save Time on Monitoring and Reporting


Frequently Asked Questions
How easy is it to connect to Constant Contact on Whatagraph?
It’s super easy thanks to our home-built Constant Contact connector. You don’t need any coding skills or third-party connectors to set up. It takes just a few clicks to connect your or your client’s Constant Contact account and that’s it.
Do I need Looker Studio to visualize my Constant Contact data?
No, you don’t need Looker Studio to visualize your data. Whatagraph is an all-in-one marketing data platform to connect, organize, visualize, and share all your data.
If you use two or three tools to get your data from sources to reports, you should definitely switch to a platform that does it all.
Having one platform to connect, organize, visualize, and share insights from your marketing data saves time and allows faster decision-making.
How can I create custom reports using data from Constant Contact?
Creating custom reports with Constant Contact data is easy if you use Whatagraph.
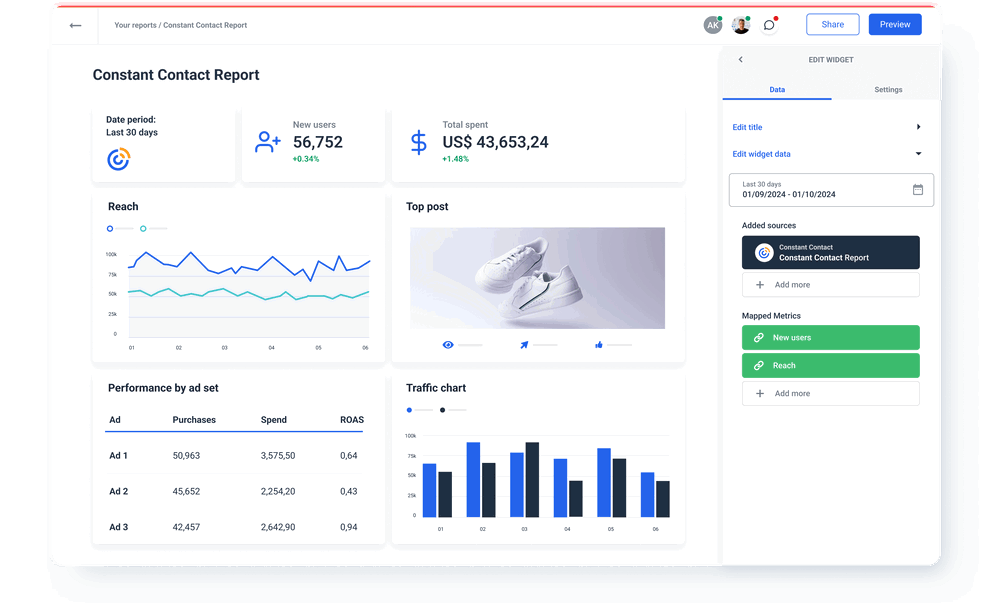
- Once you connect your CC account, you get the pre-made metric widgets you can drag and drop to your report page.
- This way, you can present only those data points that you want to see. Apart from existing Constant Contact metrics, you can also create new metrics using simple formulas.
- You can also use our customizable goal widget to show the completion of the KPI goals you agree with your client.
- To make sure your clients understand what specific data means for their business, you can add custom text boxes with comments or next steps for each graph, table, or chart.
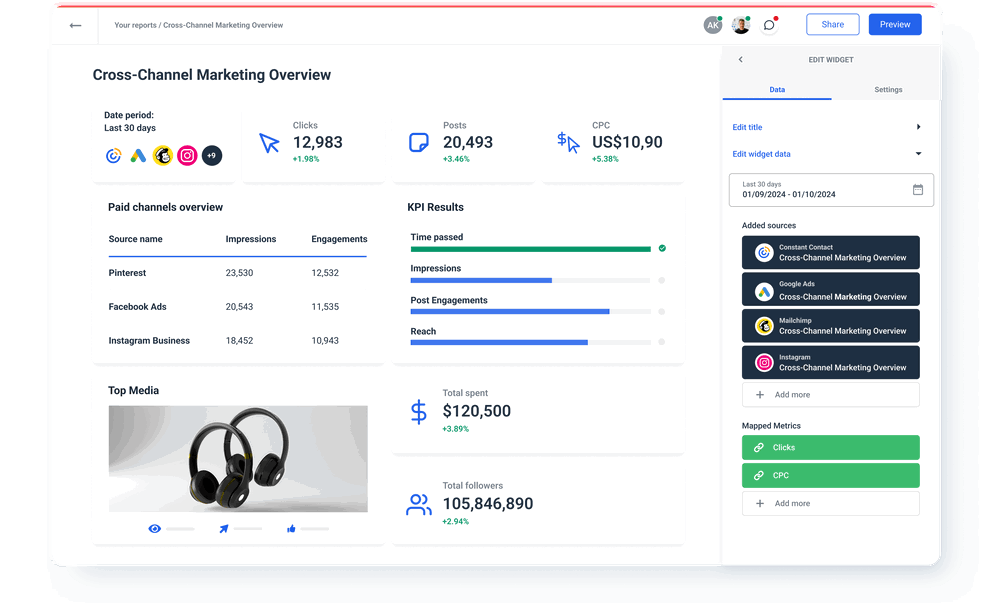
- If you choose to add data from other channels, you can also organize your reports using tabs for easier navigation.
- Finally, when you customize the content of your report, you can just as easily customize the looks.
- You can completely remove any mention of the Whatagraph brand and use your or your client’s logo and colors instead. You can even host the reports on a custom domain.
What metrics should I highlight on my Constant Contact report?
The specific metrics will depend on each client or your internal needs, but those that you shouldn’t leave out are:
Open Rate: Tells you how effective your subject lines and sender name are at capturing attention.
Click-Through Rate (CTR): Reveals how engaging your email content and call-to-action (CTA) are.
Conversion Rate: Shows how effective your email is in driving real business outcomes.
Bounce Rate: A high bounce rate may point to problems with your email list quality. Clean up your list regularly to improve deliverability.
Unsubscribe Rate: A rising unsubscribe rate can indicate that your content is no longer relevant or engaging for your audience.
Spam Complaint Rate: A high spam complaint rate can damage your sender reputation and reduce future deliverability. Always make sure you target the right audience with the right content.
List Growth Rate: Healthy list growth is a sign that your marketing efforts are pushing your reach. A list that is shrinking often means you need to optimize your lead generation strategy.
Email Delivery Rate: A low delivery rate may suggest problems with list quality or domain reputation.
Engagement by Device (Desktop vs. Mobile): When you know the device your audience prefers, you can optimize the email design to improve user experience.
Best Time to Send: This metric tracks when your recipients are most likely to open and engage with your emails, allowing you to optimize your sending times.
Can I blend Constant Contact data with other data?
Yes, you can blend Constant Contact data with other data on Whatagraph. And the best part is…you don’t need any coding or data science knowledge to do it.
You can easily blend data sources together or create custom metrics and dimensions using a simple calculator on Whatagraph.
Effortlessly create reports and dashboards


What others think about Whatagraph
I made a switch from GDS and Sheets for reporting to Whatagraph, and I am saving literal hours each week on performance report creation. Our small firm actually managed to onboard 2 new clients as a result of all the time we saved on managing data and reporting. The customer service is also really helpful and easy to reach.

Capterra verified review by
Mindaugas S., Marketing Consultant
Having active customer support to help fix any issues was a big contributor, but we also really liked the ability to save templates and connect sources to multiple charts/widgets at once without having to edit them individually. And having the grid layout is much easier to stay consistent with than the free form setup that Data Studio has.

Capterra verified review by
Nico T., Media Planner
The system has standard templates that are easy and fast to use. Also you can build your own report with lightning speed. It is very easy to use, has a lot of integration, and let get started very fast.

Capterra verified review by
Rasmus Bernt K., External Senior Management Consultant
We love Whatagraph - we would definitely recommend and our account manager is great! I love how easy this tool is to use, everyone on the team finds it much more user-friendly than other dashboards. Integration was easy, we sent some example reports to the team who duplicated these for us. We literally had to log in and send it to our clients!

Capterra verified review by
Stephanie S., Digital Director
We are showing our clients the work that we're doing for them and this is incredibly important for our clients ROI. They want to see results and having a tool like Whatagraph that can show data from virtually every source we use is hugely important.

Capterra verified review by
John S., SEO Strategist
The tool is easy to use; you do not need to have development resources. Even my junior project managers are capable of making campaign reports in minutes. There are a lot of pre-made templates you can use as well as many pre-made widgets.

Capterra verified review by
Erman E., Marketing Specialist
Really easy to connect data sources within the tool. The library of report templates has been helpful. The customer support team has been responsive to all of our needs. Our team enjoys the simplicity of setting up the reports and how the data is presented.

Capterra verified review by
Brent N., Director of Operations
Easy to create really beautiful graphs and reports which can help other team members to understand the most important takeaways. I especially like the automated report function, so I don't have to check on the same thing repeatedly.

Capterra verified review by
Orsolya S., Online Marketing Manager