


What Should a Client Reporting Template Include?
Based on client reports created by 1,000+ marketers at agencies using Whatagraph, below are the sections we recommend you include in yours.
(This is also exactly how we structured our client reporting template that you can use right away.)
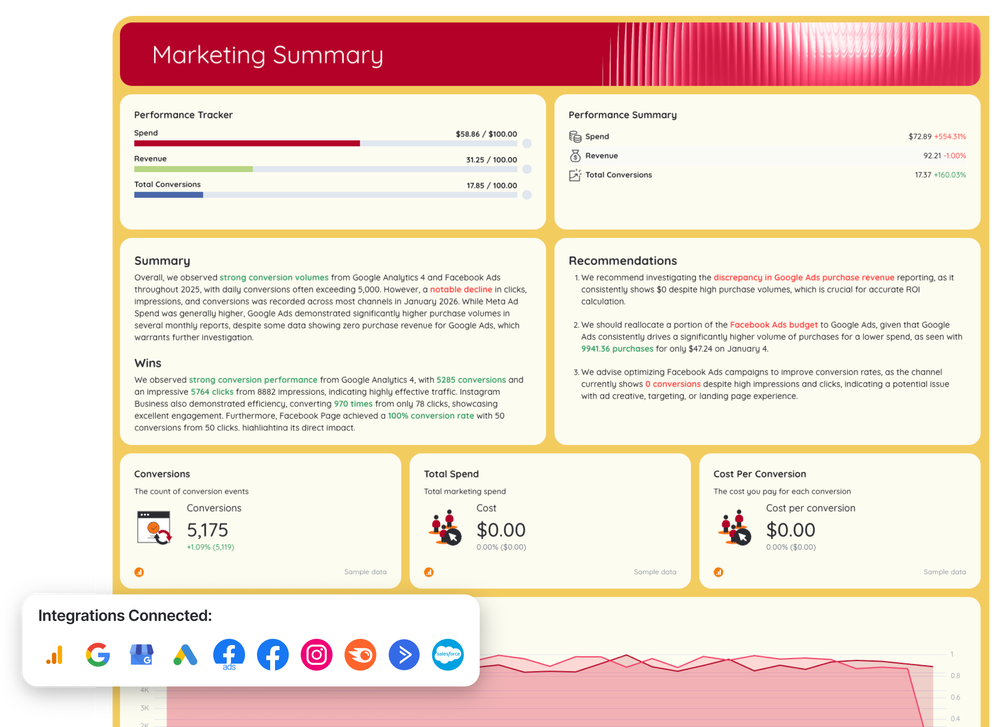
1. Marketing Summary
 Purpose: Executive summary for fast stakeholder decision-making.
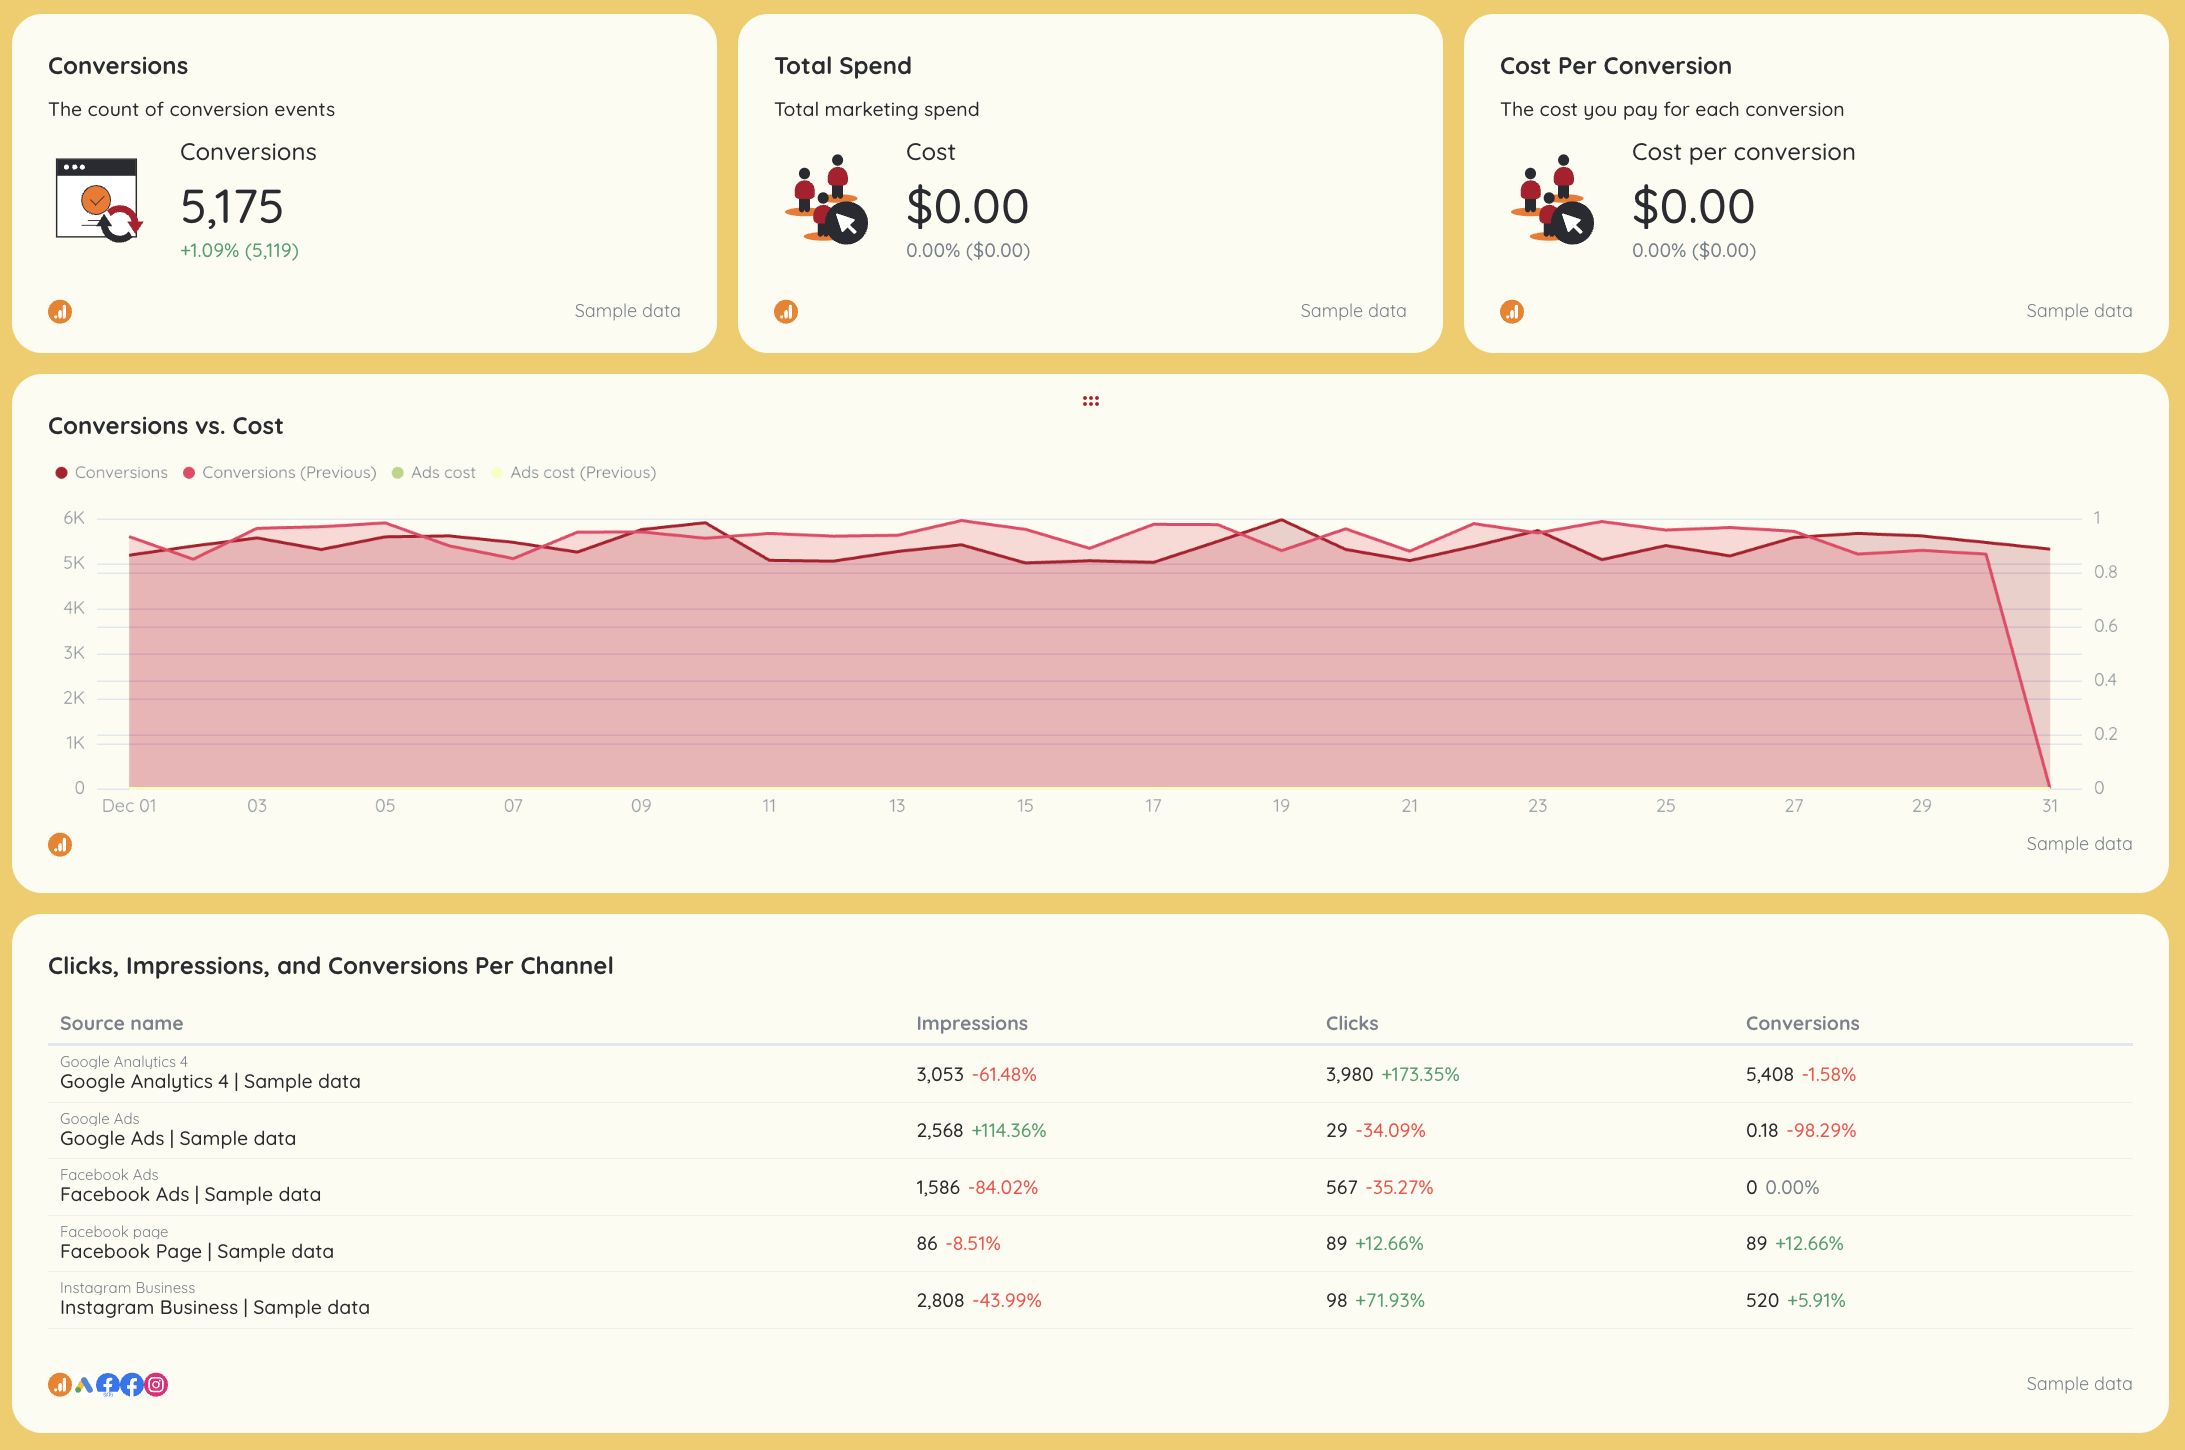
This section acts as the executive summary of the client reporting template, giving account managers and stakeholders an instant read on overall campaign performance.
What’s included
- Written summary highlighting wins, risks, and key takeaways
- Clear recommendations tied to client needs and next steps
- KPI scorecards vs targets
Key metrics
- Total ad spend
- Revenue
- Total conversions
- Cost per conversion
- Clicks, impressions, conversions by channel
Visuals
- KPI scorecards
- Line charts showing conversions vs spend over time
- Channel comparison tables across Google Ads, Facebook Ads, and organic sources
2. Website Performance
 Purpose: Core performance report for how the website drives results.
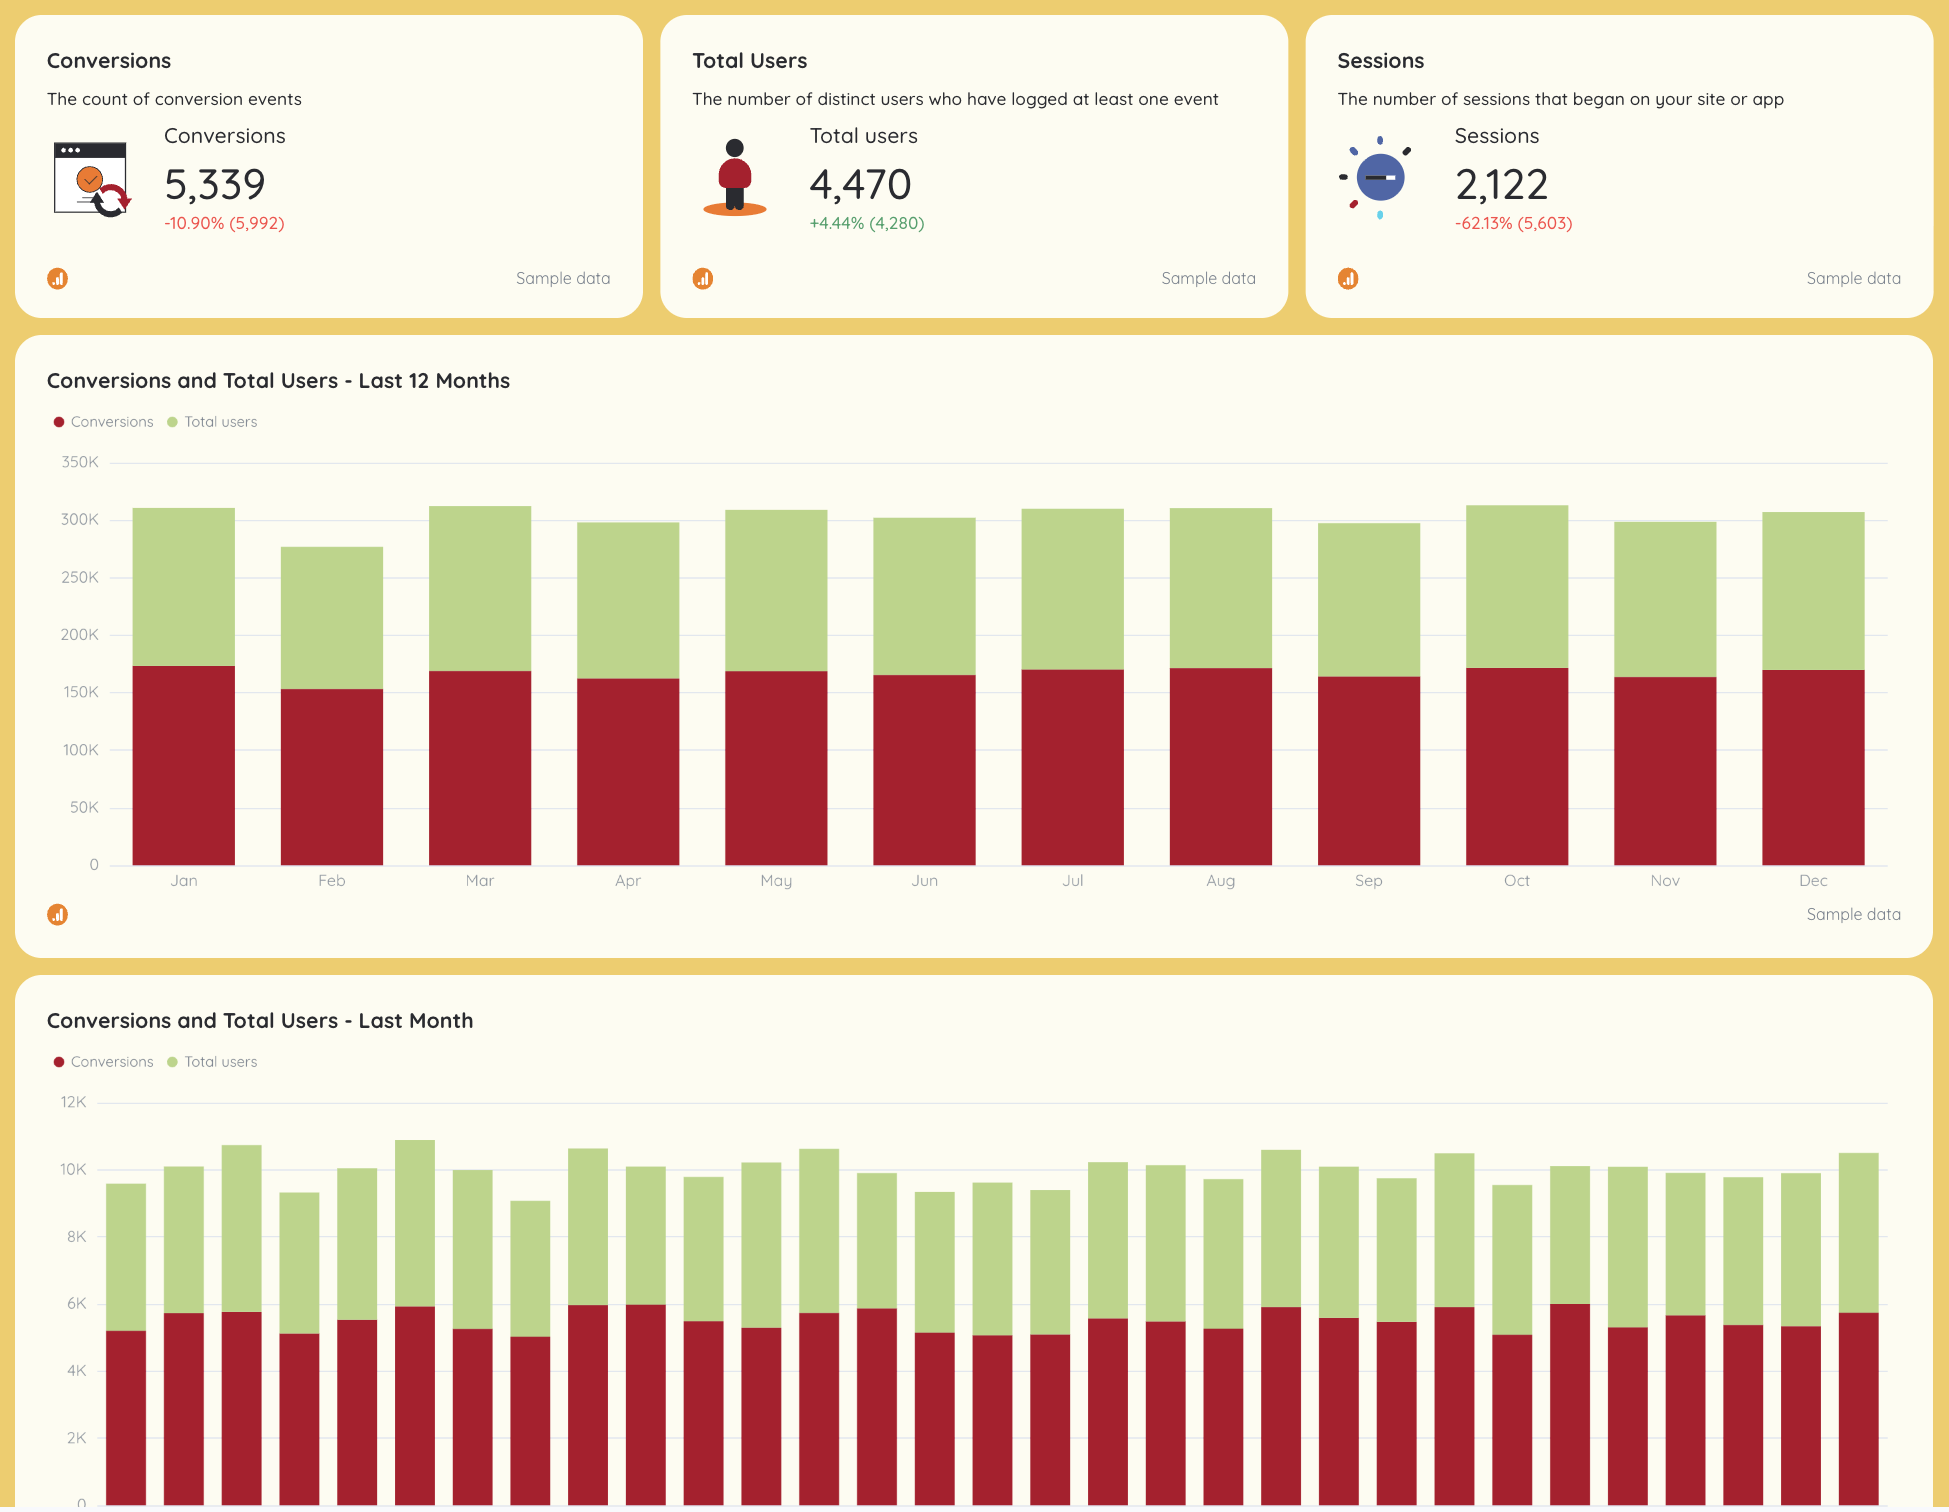
This section pulls Google Analytics data into a structured marketing report focused on traffic quality, conversions, and engagement.
Key metrics
- Total users and new users
- Sessions
- Conversions and conversion rates
- Bounce rate
- Average engagement time
- Traffic and conversions by source, device, and location
Visuals
- Time-series graphs for sessions and conversions
- Source breakdown charts (organic traffic, PPC, social media)
- Page-level tables showing key performance indicators like bounce rate and engagement
3. SEO
 Purpose: Organic growth and rankings visibility.
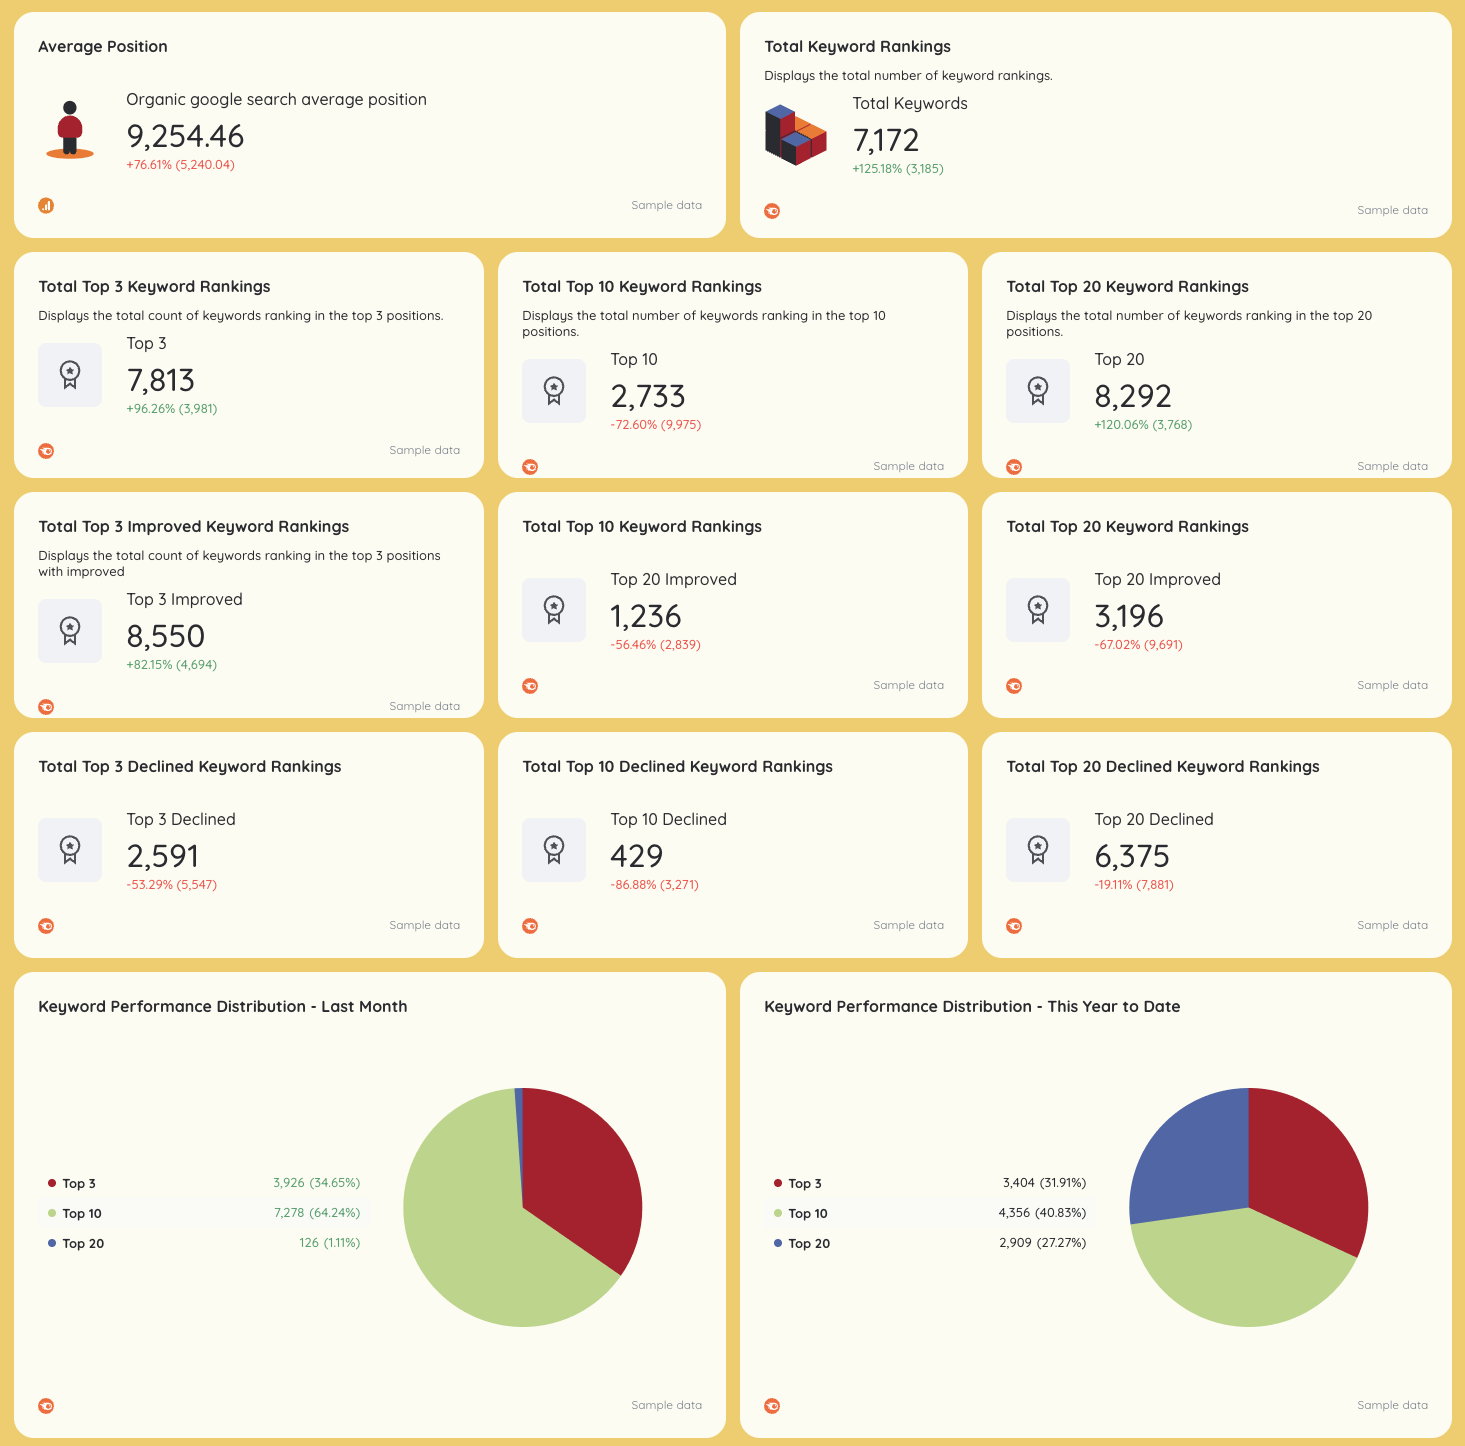
This SEO report shows how organic search contributes to long-term performance and retention.
Key metrics
- Organic traffic
- Average rankings
- Total keywords tracked
- Top 3 / Top 10 / Top 20 keyword positions
- Backlinks and referring domains
- Domain authority
Visuals
- Keyword distribution charts
- Ranking trend graphs
- Backlink growth over time
- Tables highlighting improved vs declined rankings
4. GEO (AI / Generative Engine Optimization)
 Purpose: Track visibility and traffic from AI-driven discovery.
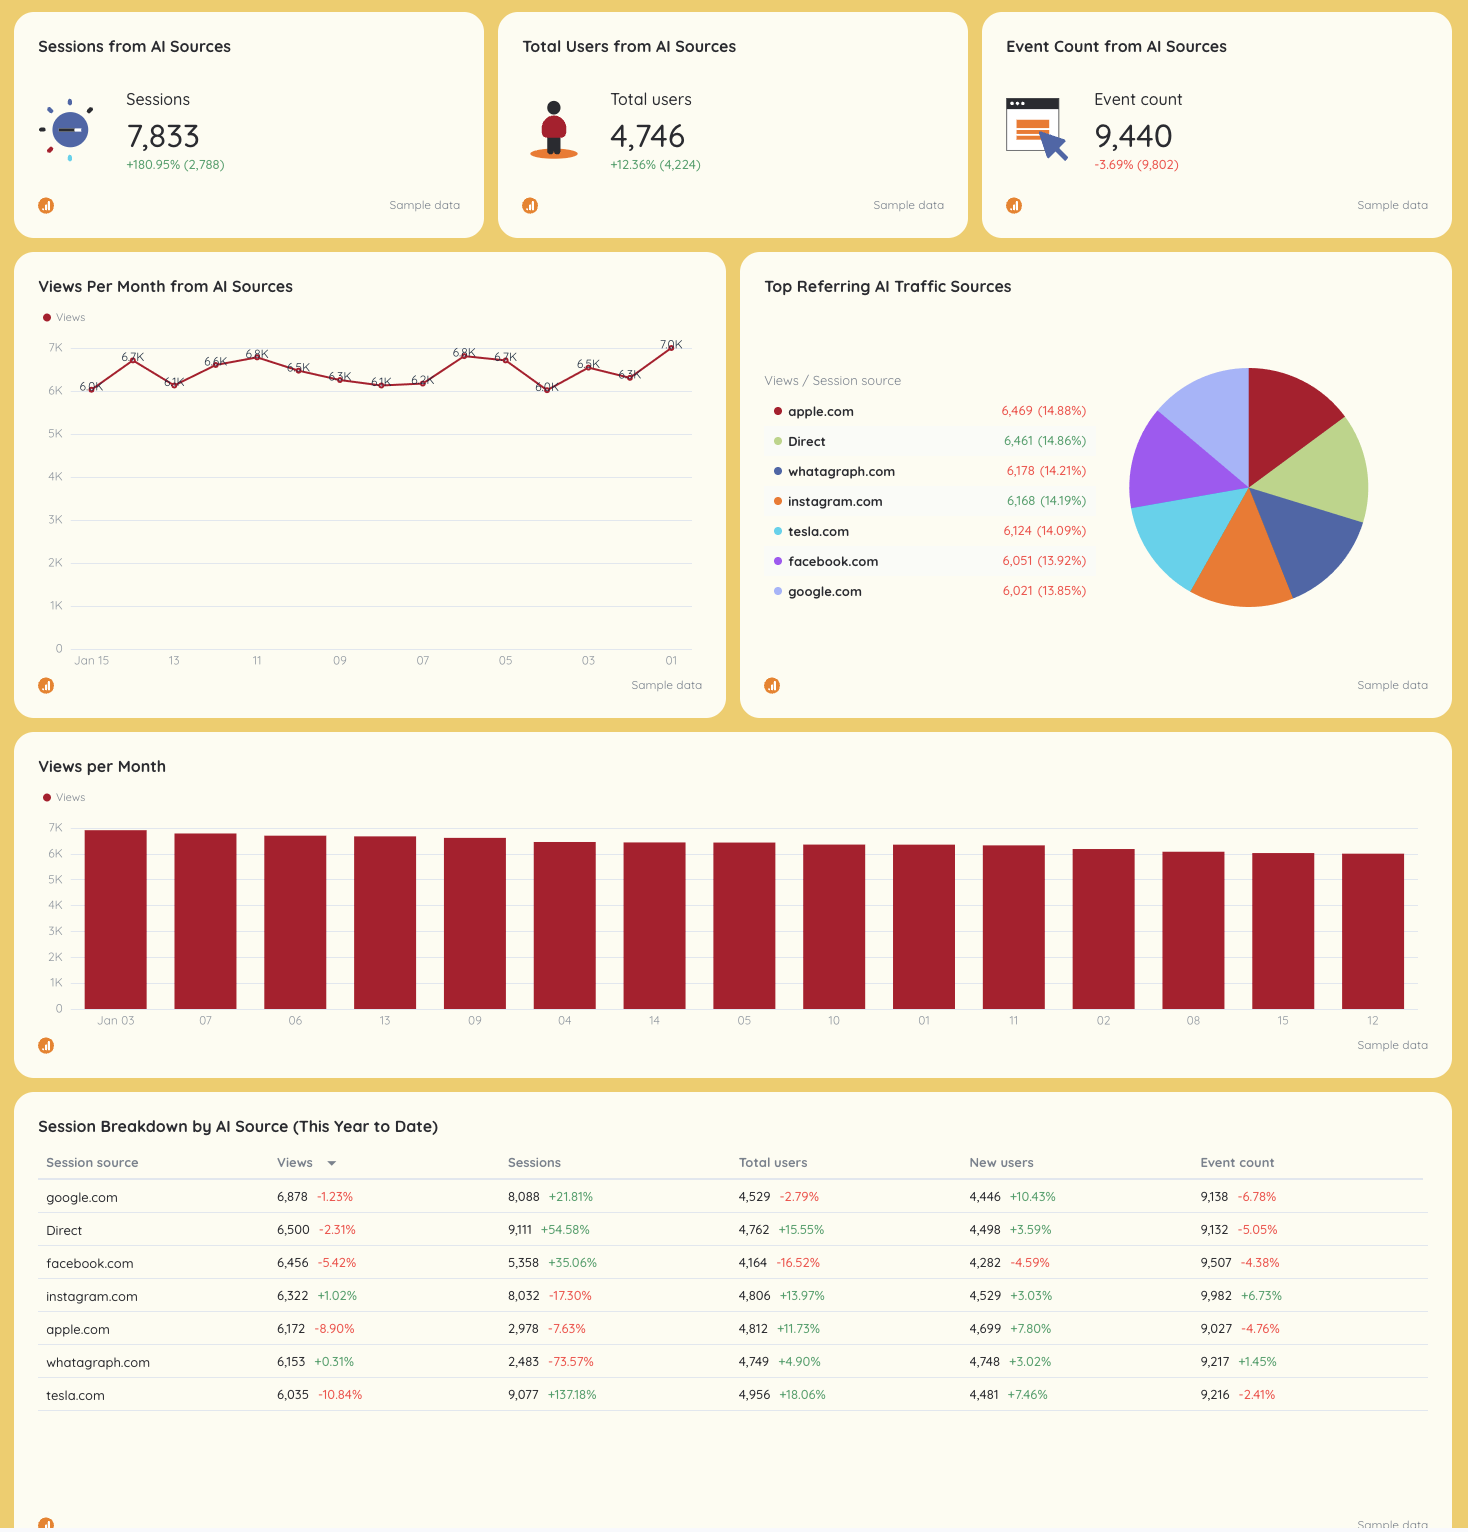
This section extends traditional SEO into GEO, showing how content performs across AI and referral sources in near real-time.
Key metrics
- Sessions and users from AI sources
- Views by AI referrer
- Events and conversions
- Landing page engagement from AI traffic
Visuals
- Line charts for AI sessions and views
- Source breakdown tables
- SEO vs GEO comparison dashboards for decision-making
5. Keyword Tracking
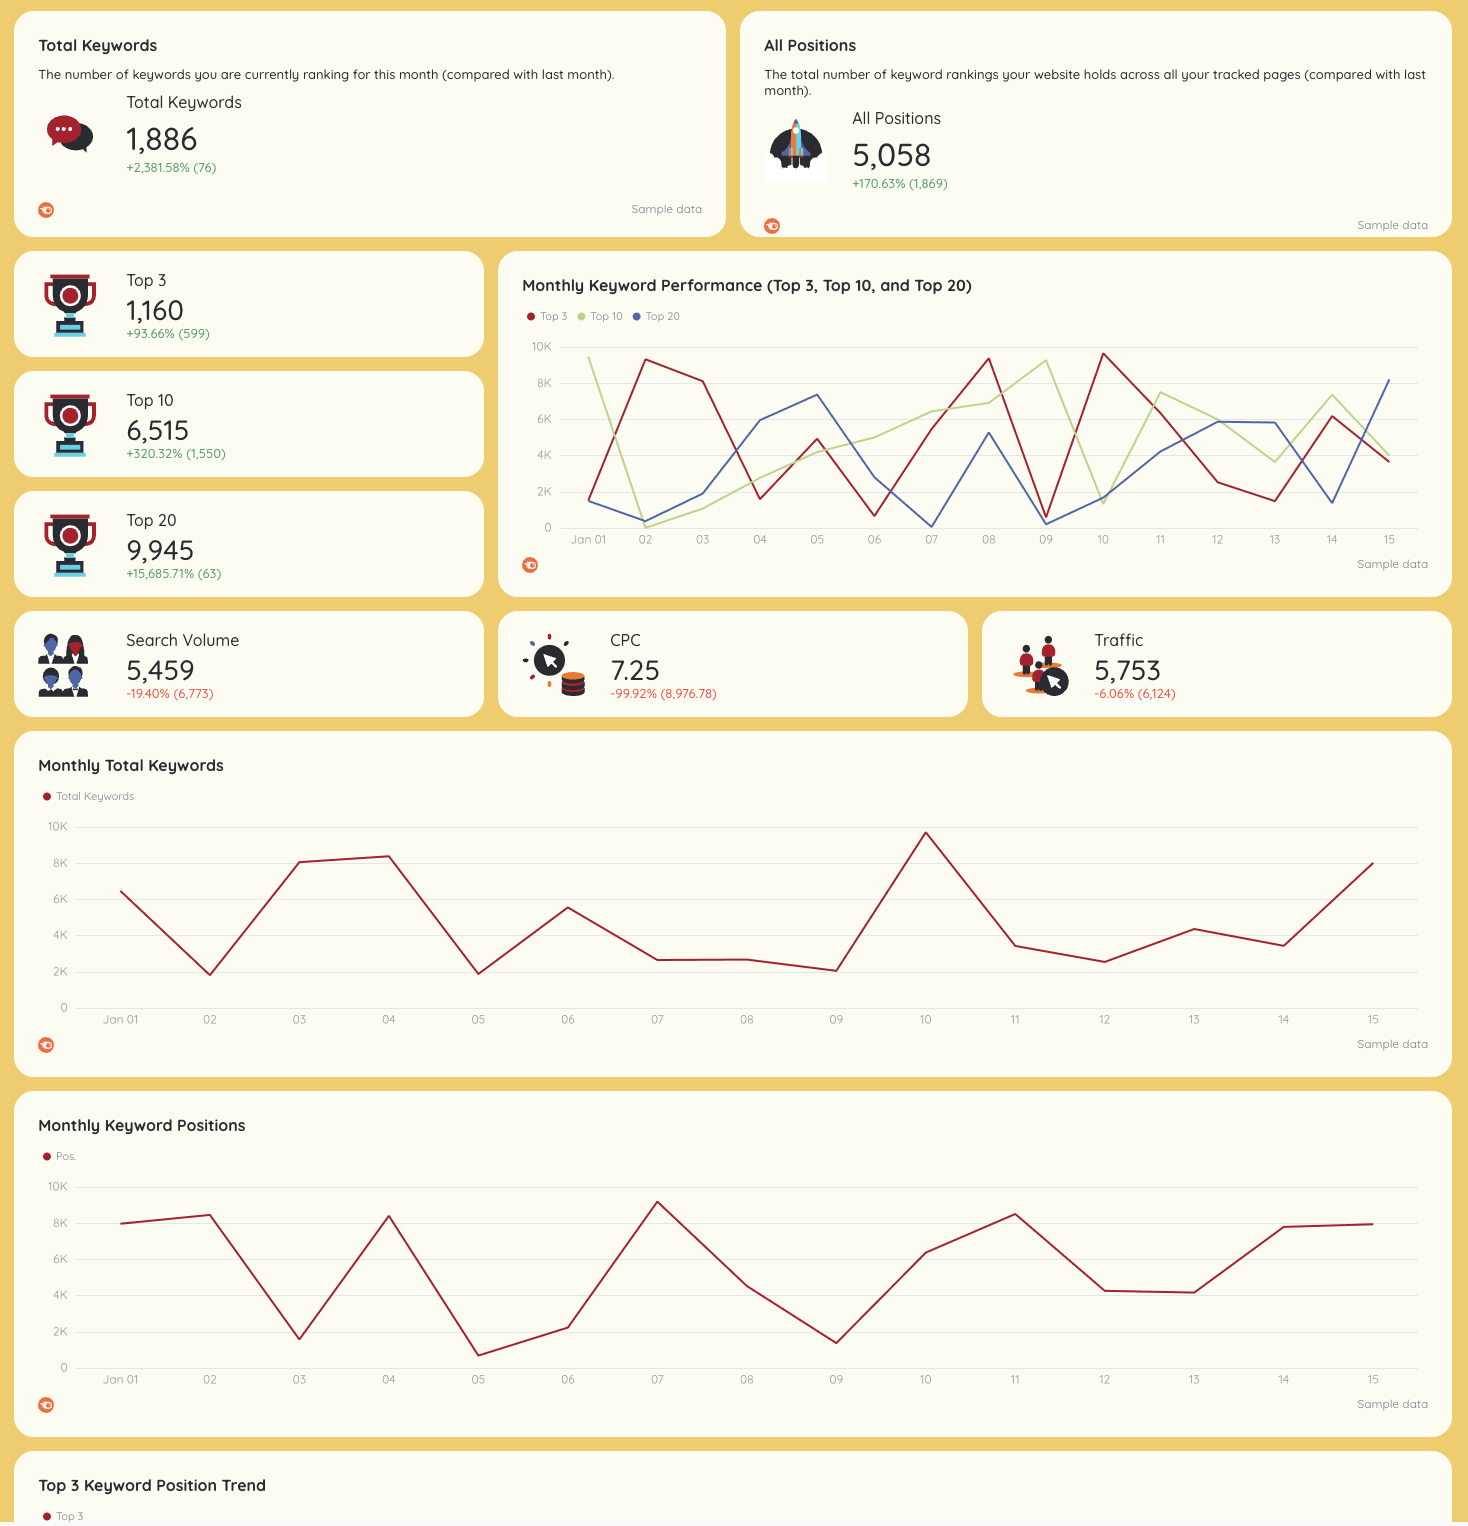 Purpose: Detailed progress report on keyword performance.
This section focuses on actionable keyword insights for data-driven optimization.
Key metrics
- Keyword rankings
- Search volume
- Keyword difficulty
- CPC
- Traffic per keyword
- Ranking movement across Top 3, 10, and 20
Visuals
- Ranking trend graphs
- Monthly keyword distribution charts
- Keyword and URL performance tables
6. Google My Business
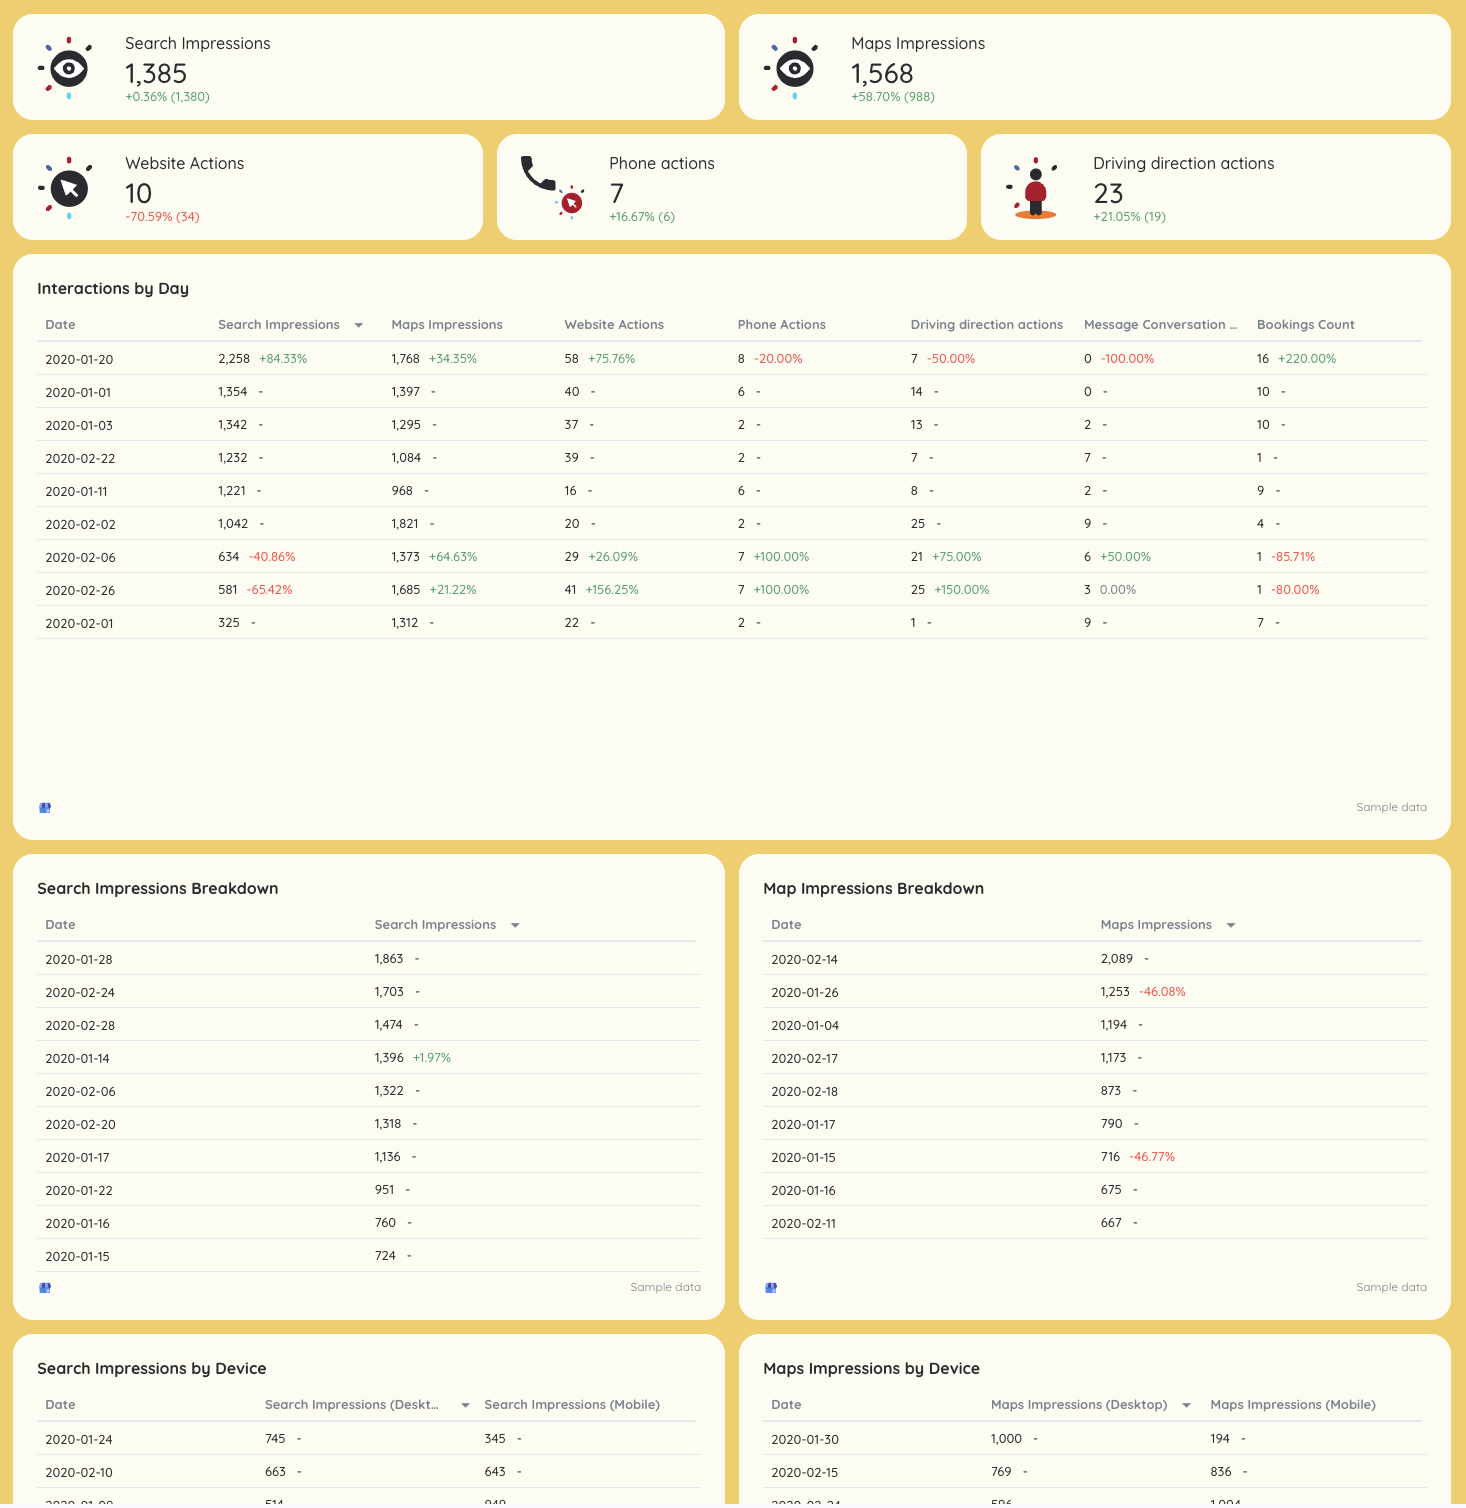 Purpose: Local visibility and reputation management.
This section supports local client relationships by tracking Google My Business performance and reviews.
Key metrics
- Search impressions
- Maps impressions
- Website actions
- Phone calls and direction requests
- Total reviews and average rating
Visuals
- Daily interaction tables
- Device-level breakdowns
- Review growth and rating trend charts
- KPI cards vs local visibility goals
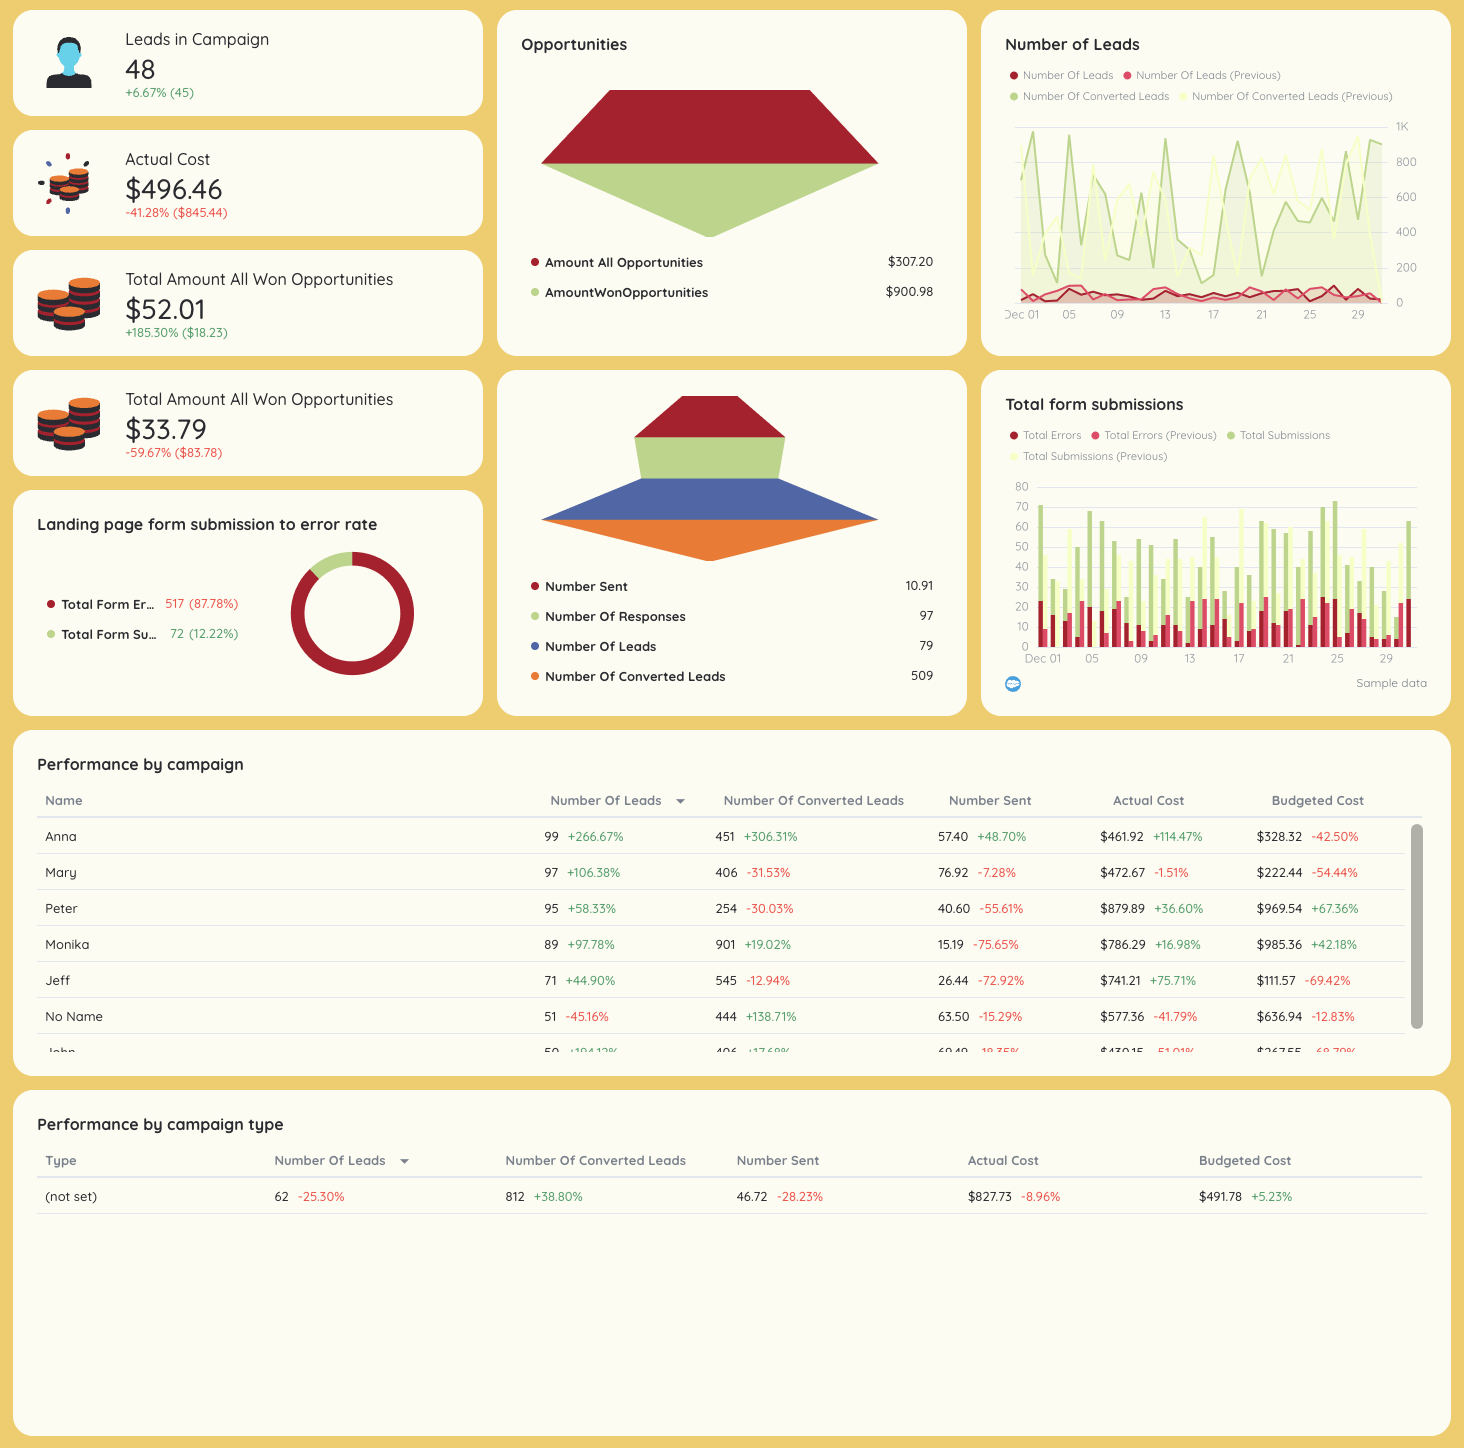
7. Google Ads
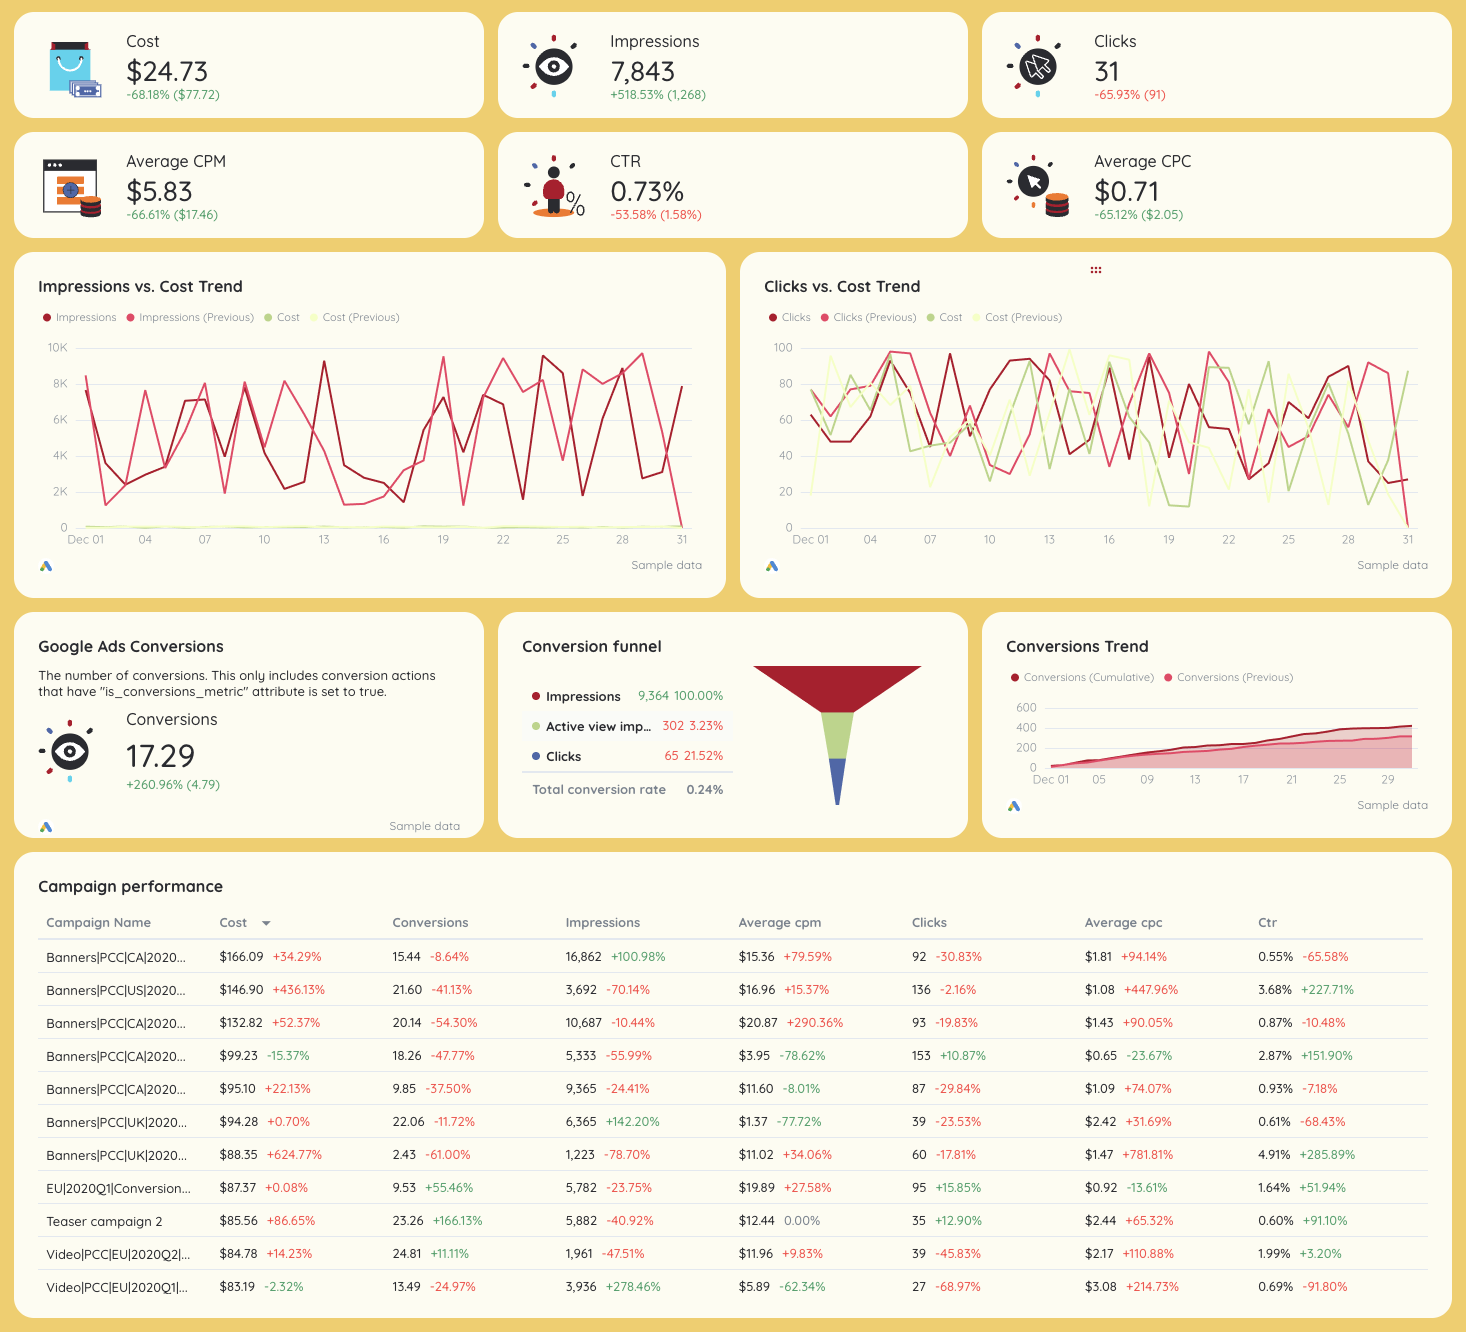 Purpose: PPC performance and spend efficiency.
The first part of this PPC performance report connects ad spend to outcomes, helping account managers optimize budgets.
Key metrics
- Impressions
- Clicks and click-through rate
- CPC and CPM
- Conversions
- Cost per conversion
Visuals
- Conversion funnel charts
- Spend vs conversions trend graphs
- Campaign-level performance tables
- Network breakdowns (Search vs Display)
8. Facebook Ads
Purpose: Paid social performance tracking.
This section focuses on ads performance across Meta, helping teams justify spend and improve ROAS.
Key metrics
- Spend
- Impressions
- Clicks
- CTR
- CPC
- Conversions and cost per conversion
- ROAS (when revenue data is available)
Visuals
- Spend vs conversion graphs
- Campaign and ad set tables
- Creative-level performance breakdowns
9. Social Media (Facebook & Instagram)
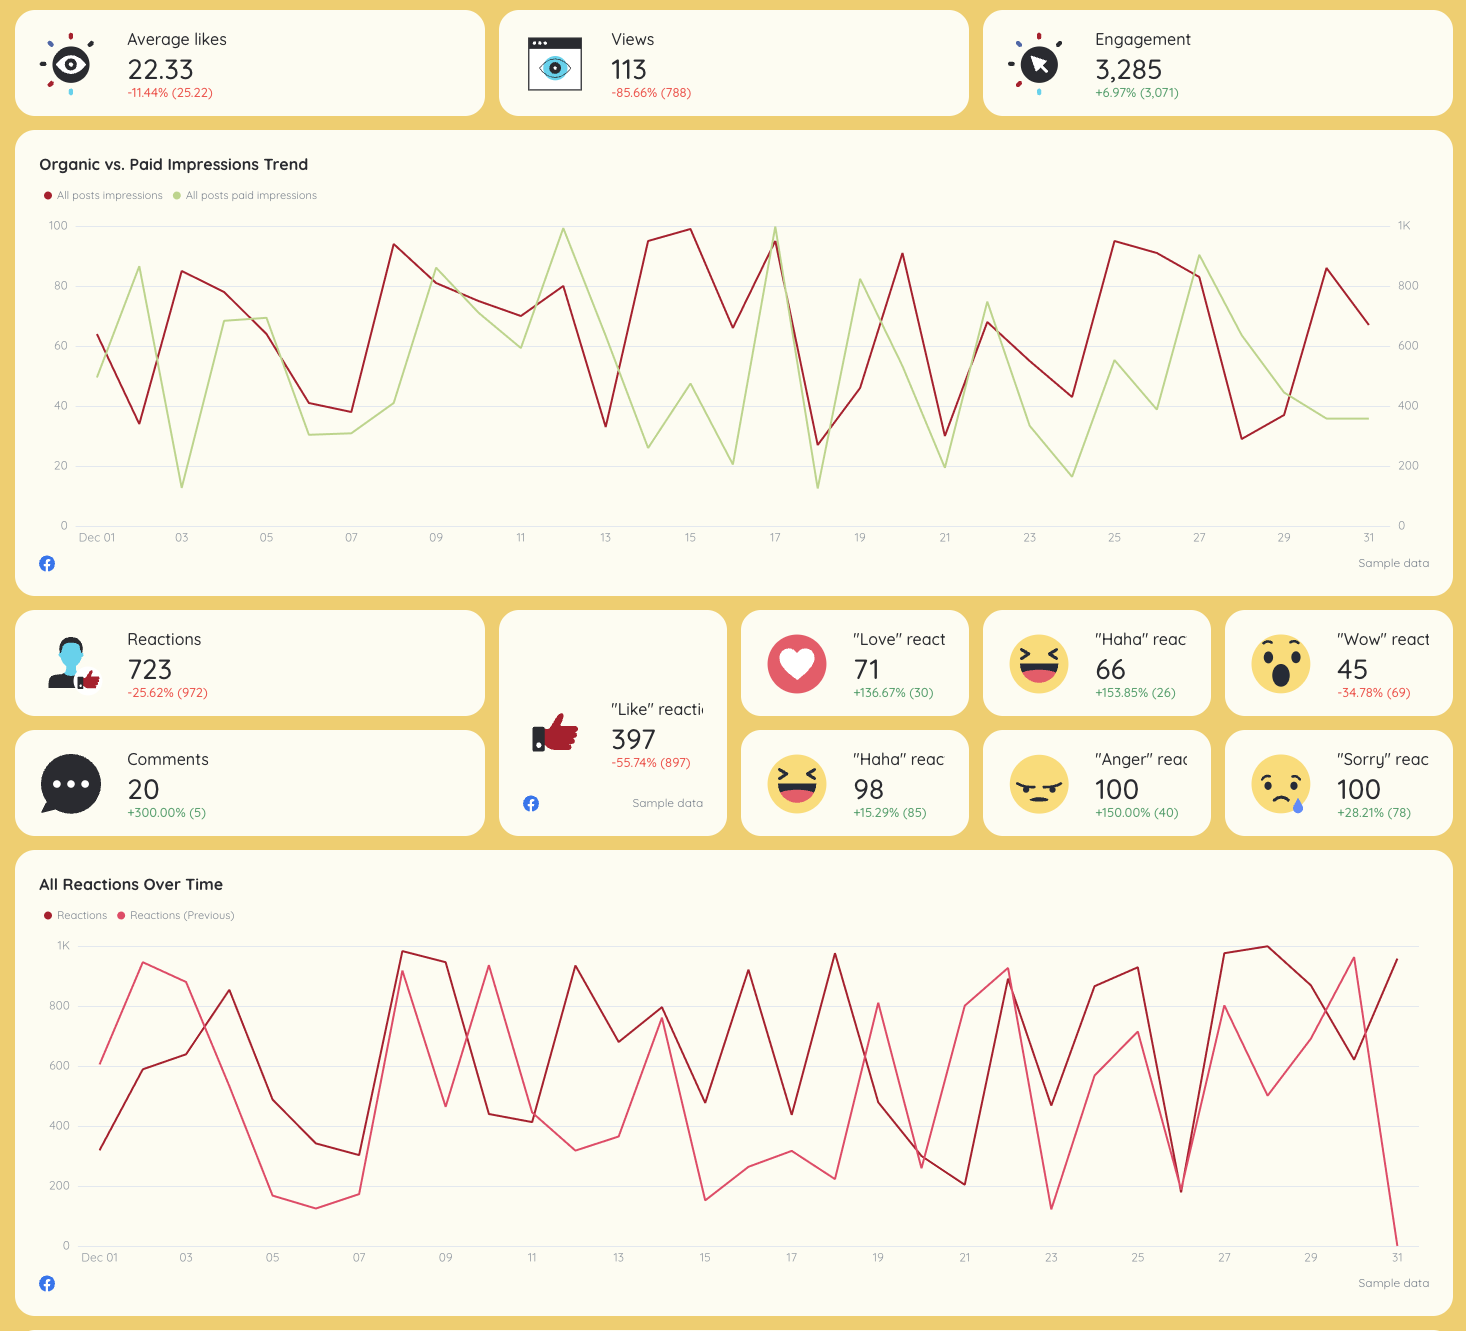 Purpose: Organic social media reporting.
This social media report shows how content drives engagement and supports broader marketing campaigns.
Key metrics
- Followers
- Reach
- Impressions
- Engagements and engagement rate
- Clicks and conversions
Visuals
- Follower growth charts
- Engagement trend graphs
- Platform comparison tables
- Post-level performance data
10. Email Marketing
 Purpose: Measure lifecycle and retention impact.
This section connects email marketing to conversions and pipeline influence.
Key metrics
- Emails sent
- Opens and open rate
- Clicks and click-through rate
- Conversions
- Revenue (if tracked)
Visuals
- Campaign comparison tables
- Time-based performance graphs
- KPI summaries aligned to campaign goals
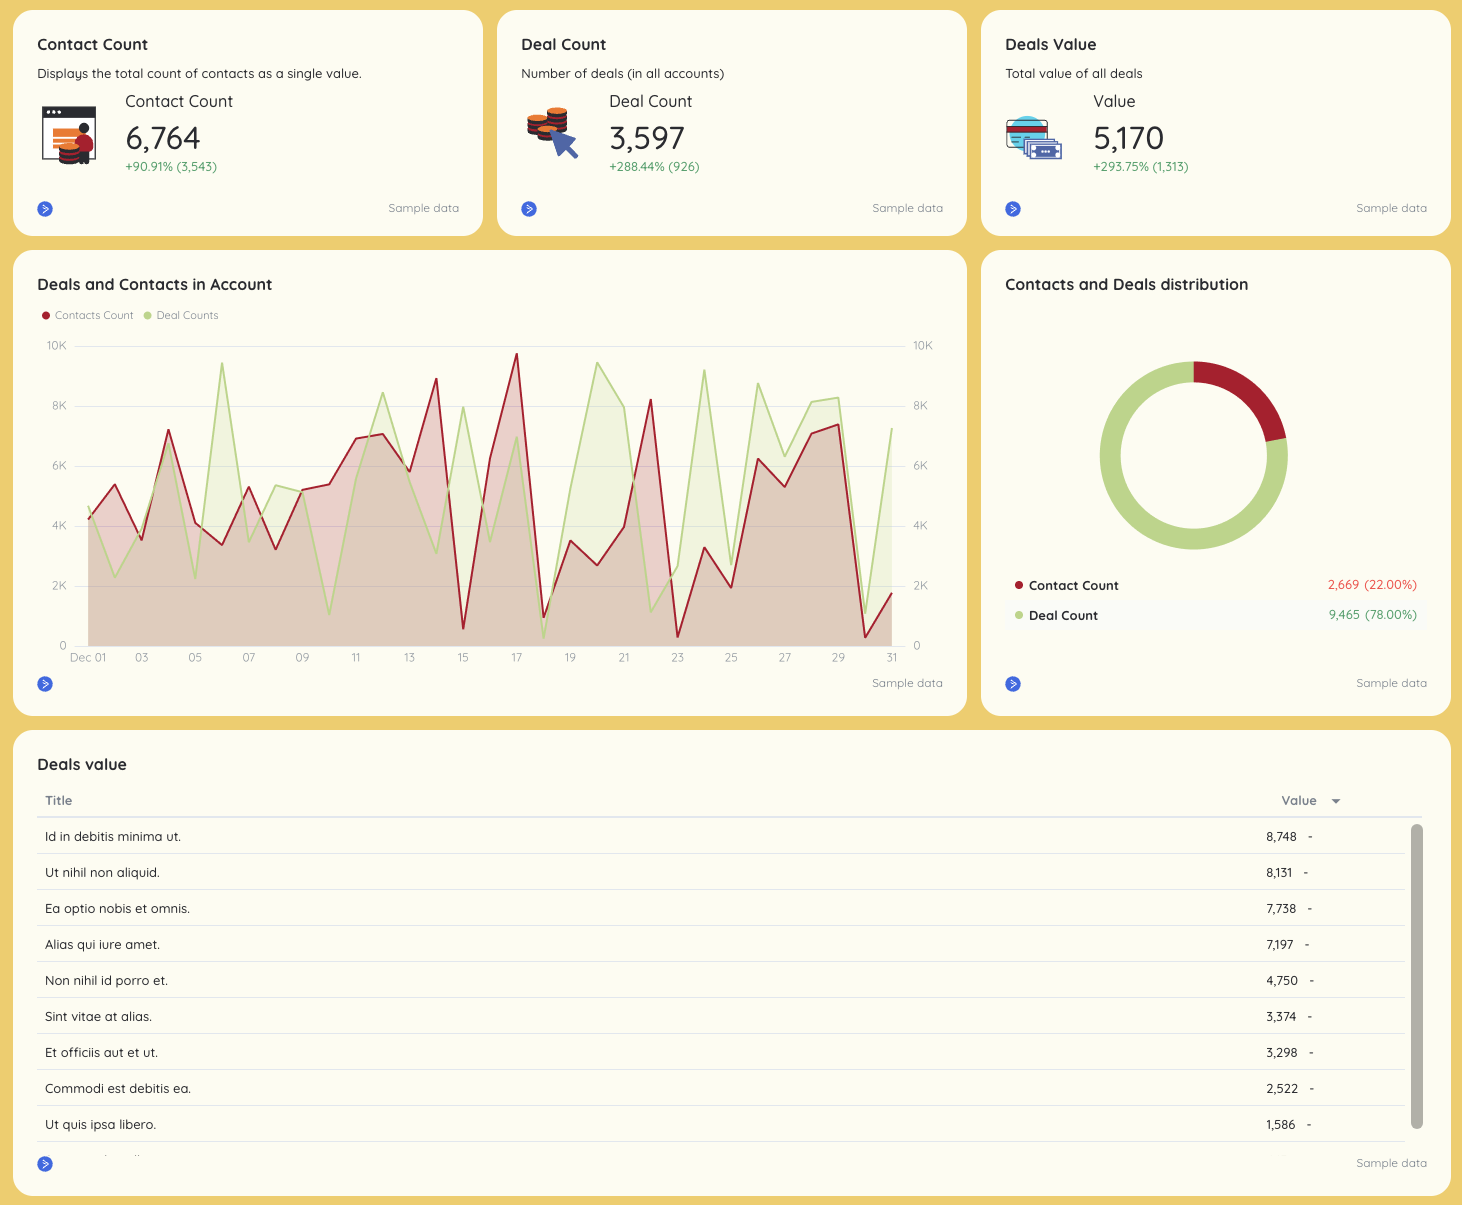
11. Salesforce
 Purpose: Revenue and pipeline visibility.
This section closes the loop between marketing and sales using CRM data.
Key metrics
- Leads
- Opportunities
- Pipeline value
- Closed-won deals
- Revenue
- Funnel conversion rates
Visuals
- Funnel charts
- Stage-by-stage pipeline tables
- Revenue trend graphs
- KPI scorecards tied to business milestones


