
What Should a PPC Campaign Report Template Include?
A paid ads report template should give a complete picture of your campaign performance across all your ad channels, from Google Ads and Meta Ads to LinkedIn Ads and TikTok Ads.
Here’s how to structure your paid ads marketing report template, according to marketers who are using Whatagraph:
1. Paid Advertising Overview Tab
Start your report with a holistic view of your key metrics from all paid channels. This is where you set the stage for the story your data tells.
Include these two sections in this tab:
- Top-Level Overview
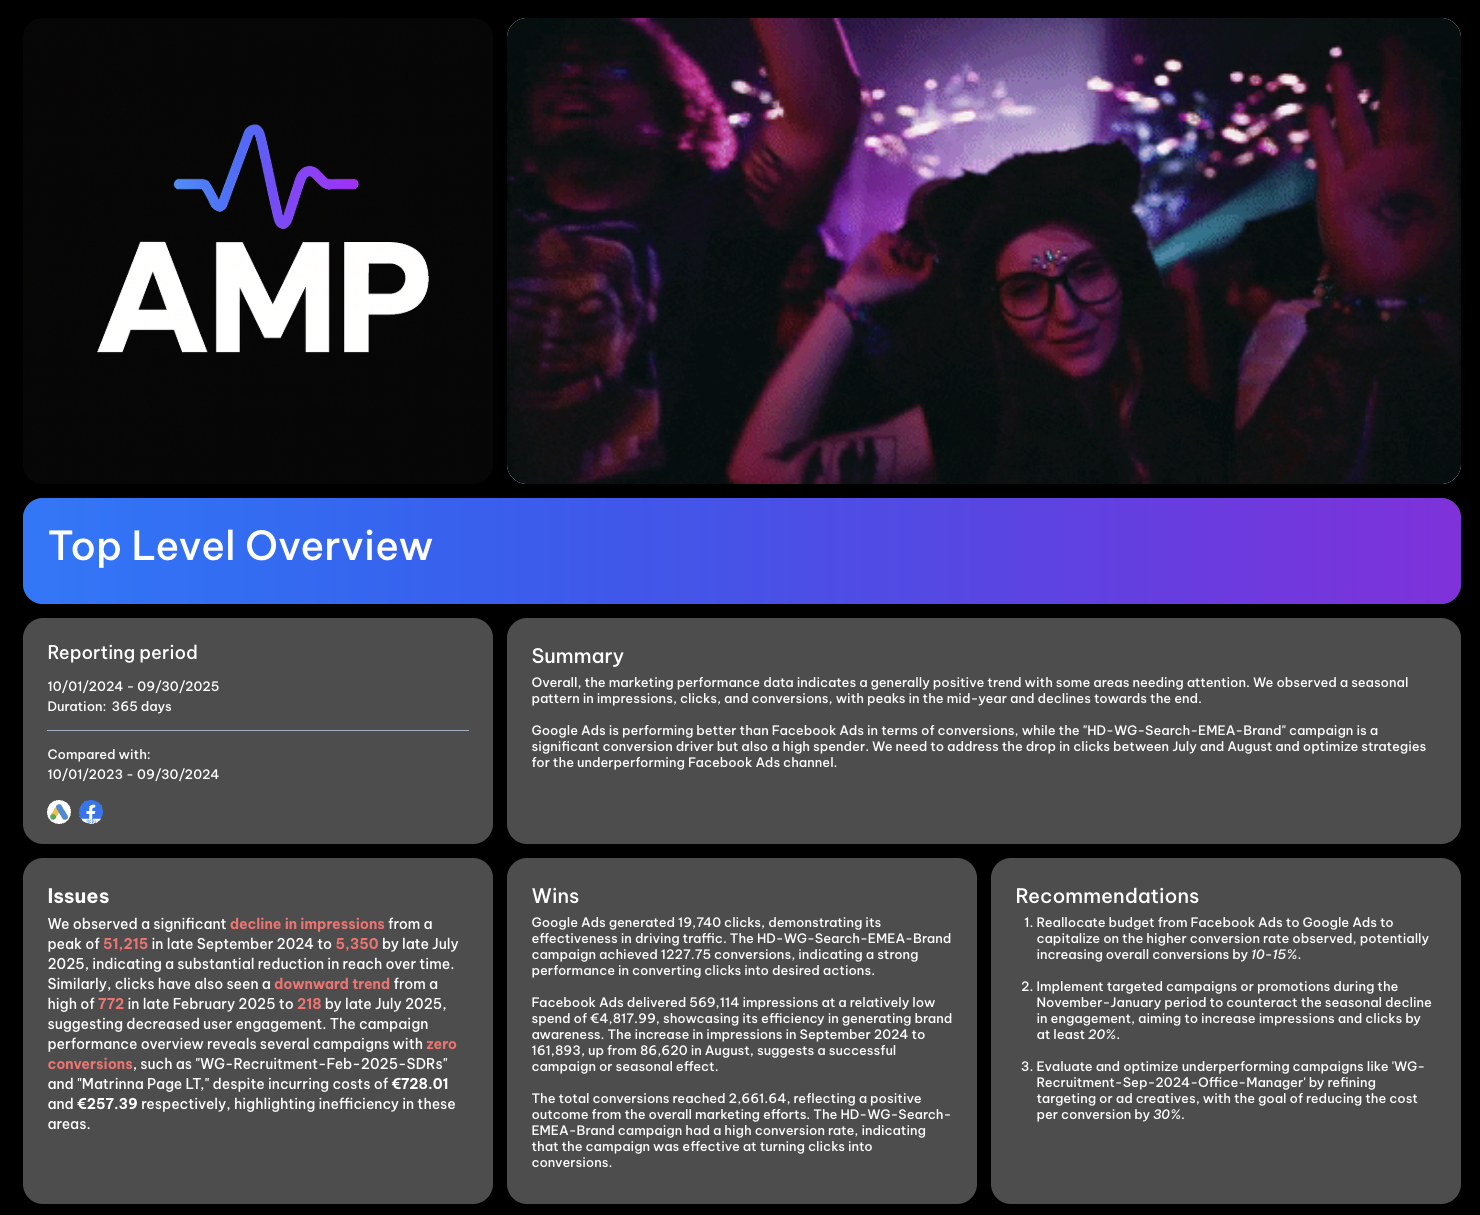
Add your agency’s or client’s logo at the top and include a GIF or branded image to make the report visually engaging.
Use a text widget to summarize the main takeaways, like wins, issues, and next steps. With Whatagraph IQ Summary, you don’t need to write this manually.
IQ analyzes your actual campaign data, identifies trends, and automatically writes summaries in 18 languages. You can customize prompts to fit your tone and still edit them for that human touch.
Since the data never leaves Whatagraph, there’s zero risk of data breaches or hallucinated insights like with external AI tools.
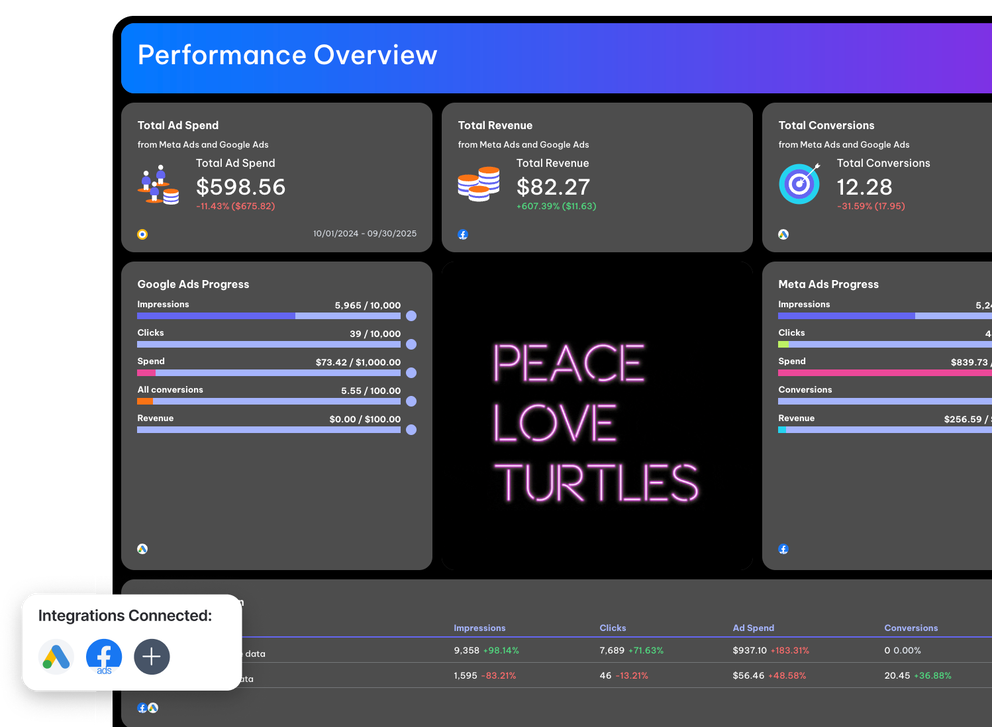
- Performance Overview
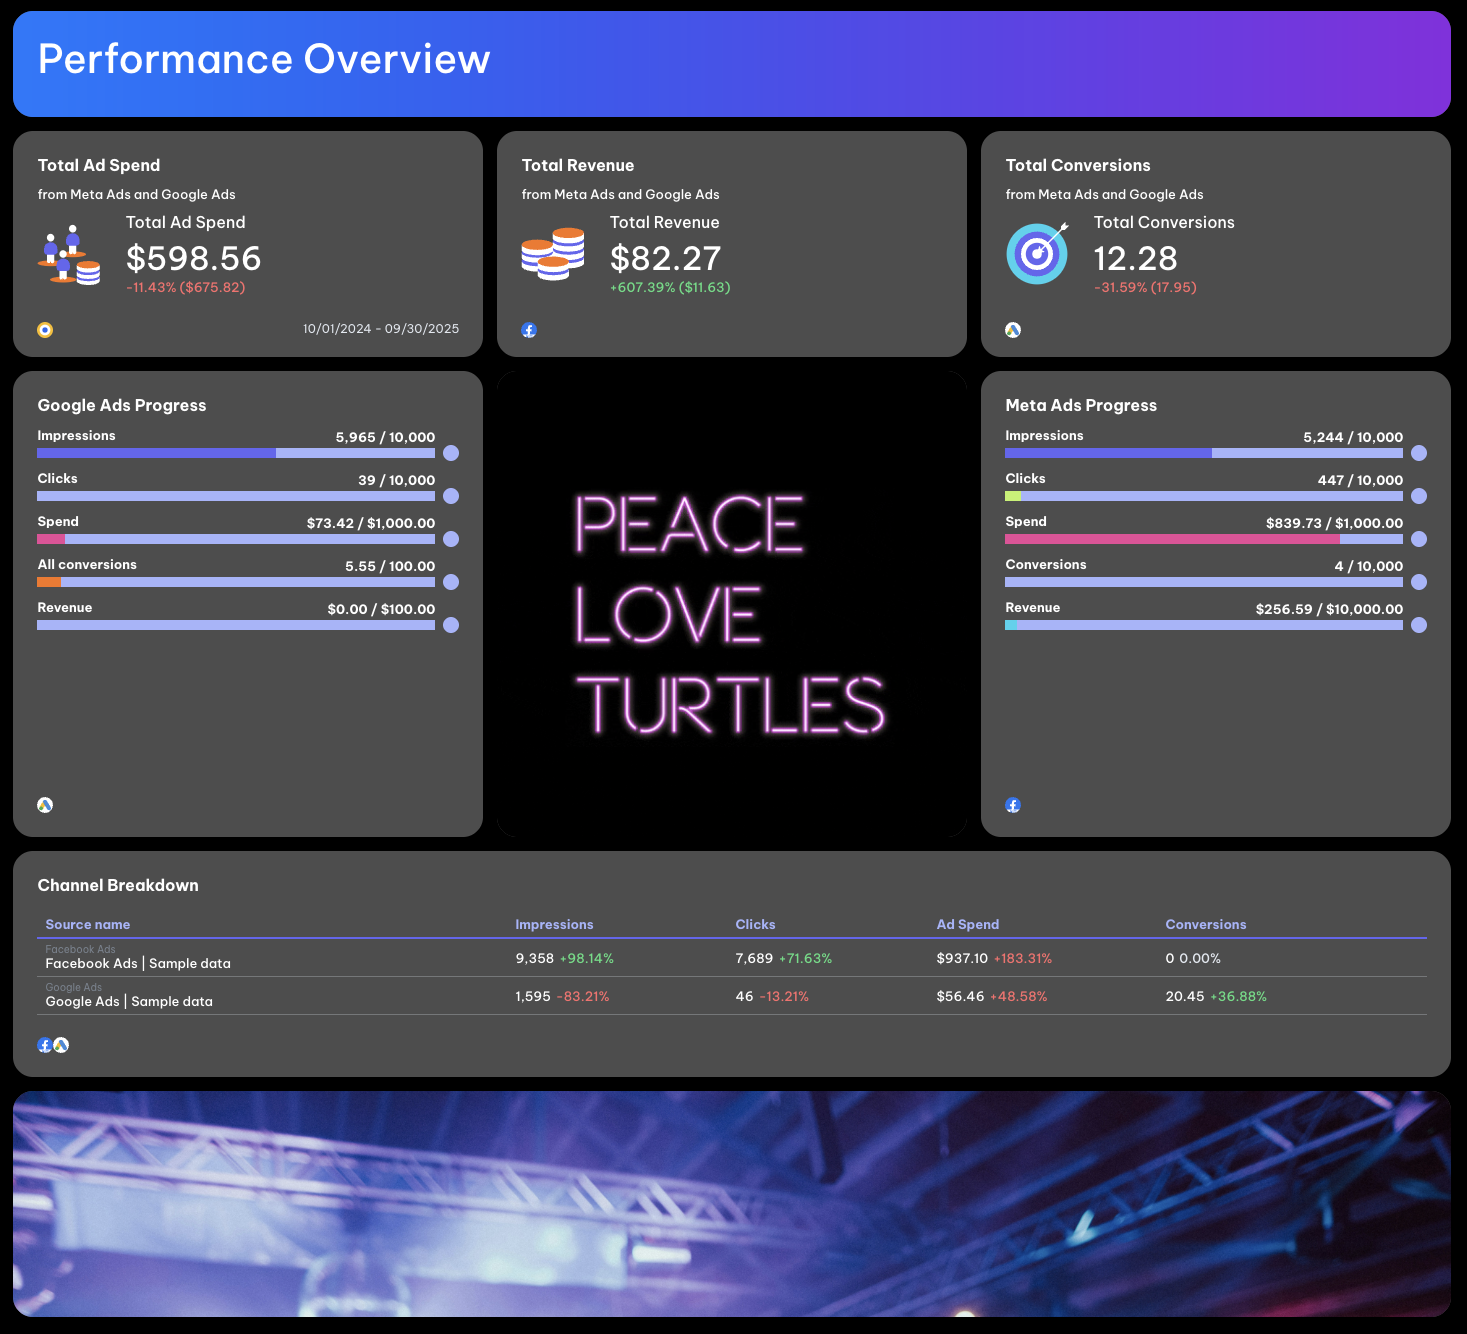
Highlight your most important KPIs in single widgets. These should be mutually agreed upon by your clients or internal stakeholders: such as CTR, CPC, conversion rate, and ROAS.
Show goal progress for each paid channel, for example how Google Ads and Meta Ads performed against monthly targets.
Again here, add visuals like GIFs, icons, or charts to make performance data easier to interpret at a glance.
2. Channel-Specific Breakdown Tab
Each paid channel deserves its own tab for clarity. Let’s take Google Ads as an example.
- Google Ads Performance Overview
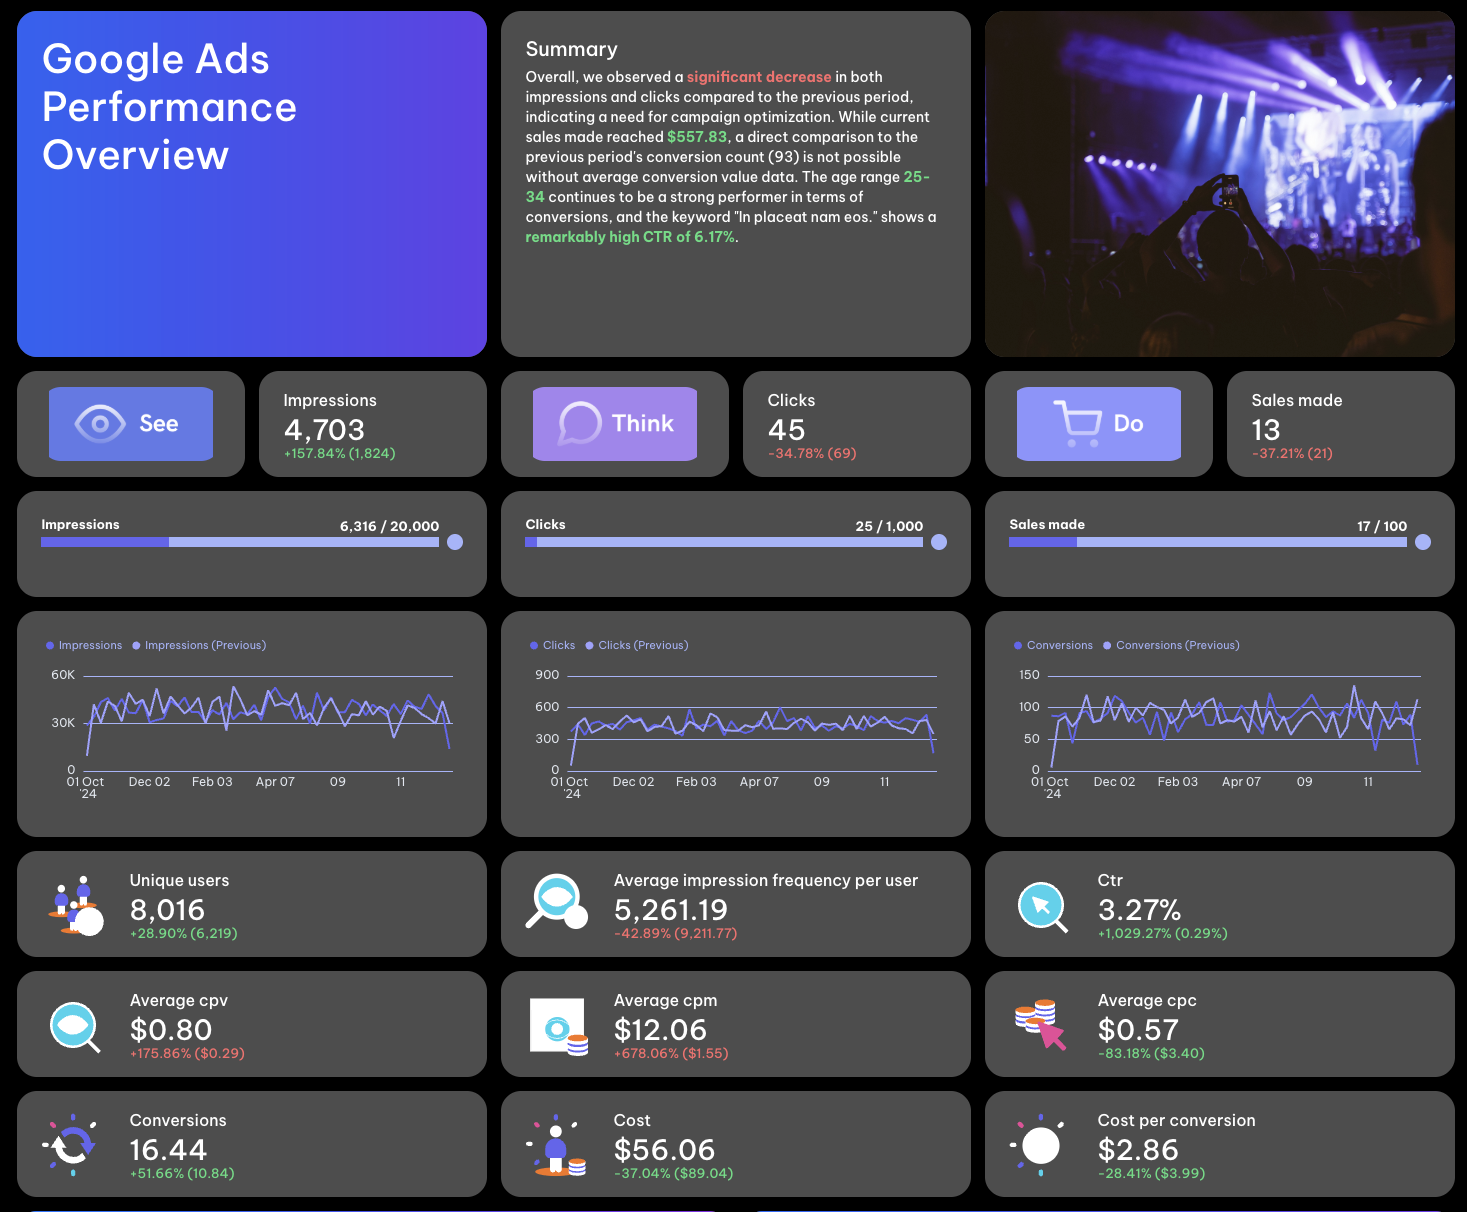
Start with a summary text that explains top-level trends, followed by headline KPIs like impressions, clicks, CTR, CPC, and conversions.
Compare performance against the previous period and show trends using graphs or line charts.
- Campaign Performance
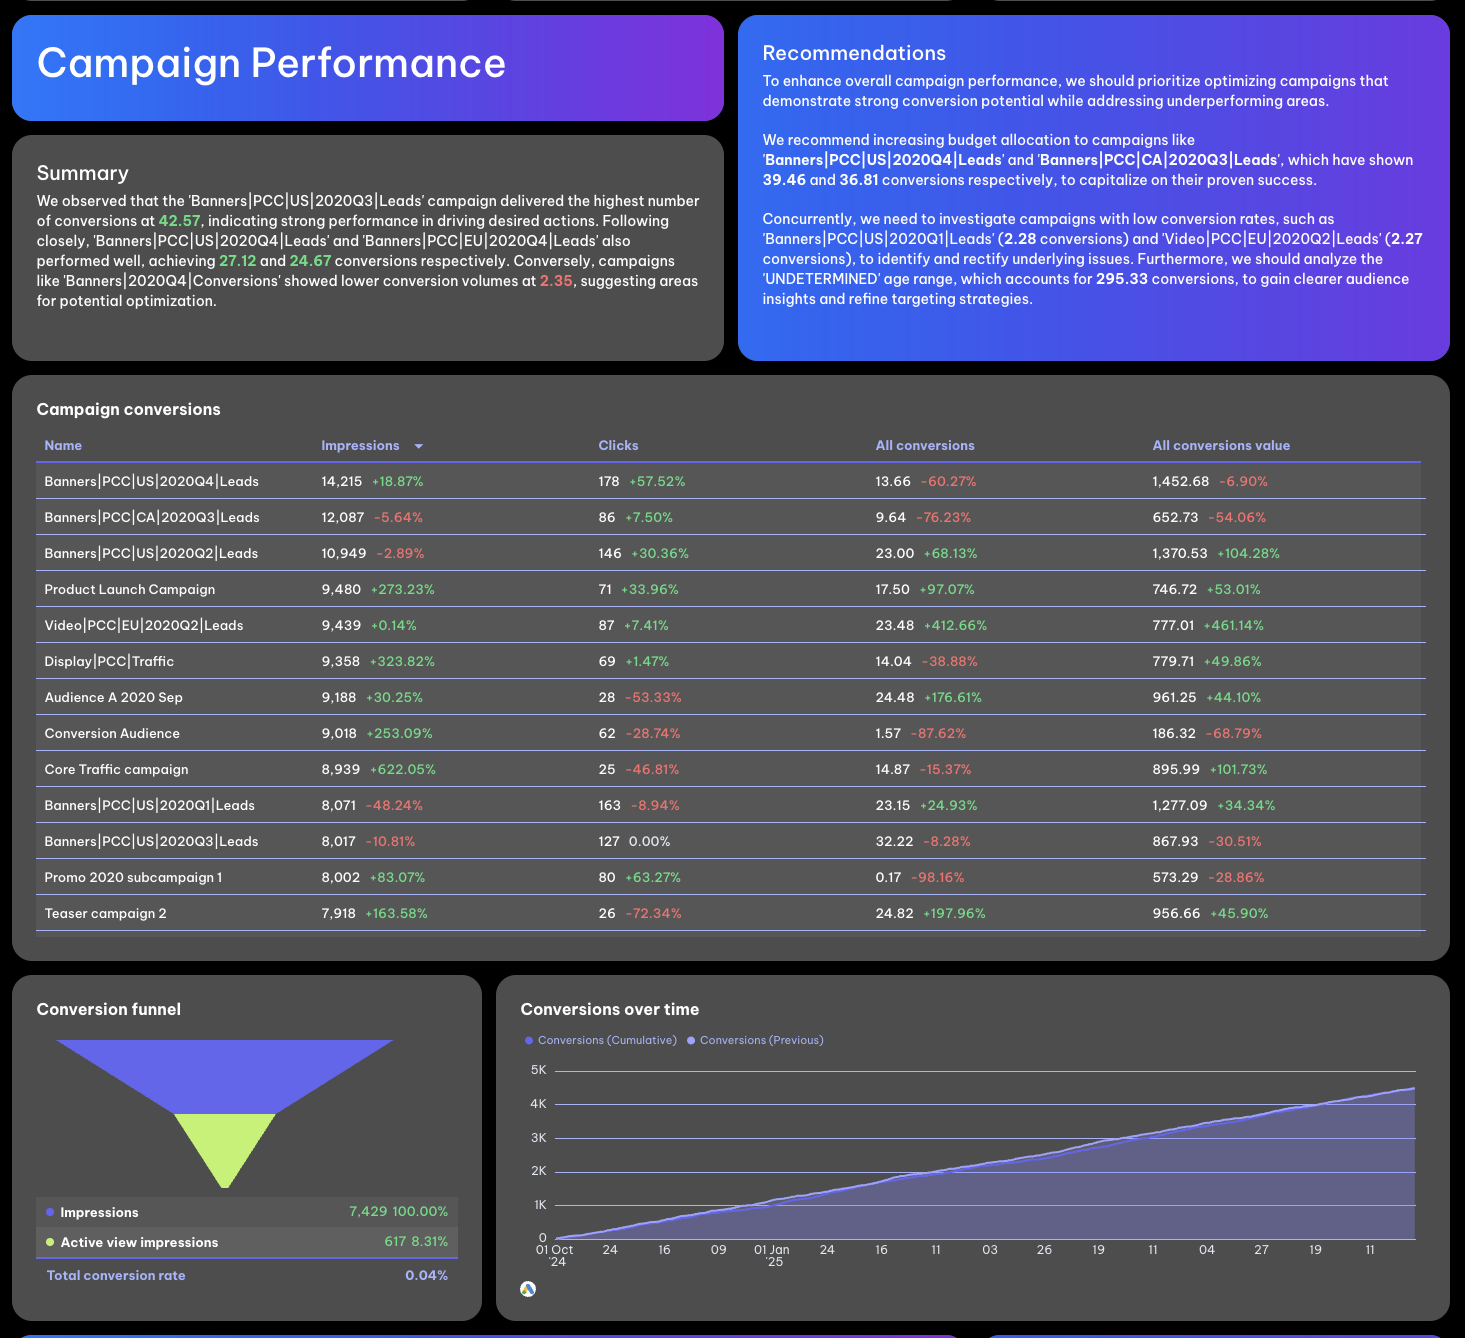
Include a short summary and recommendations. Add a pivot table breaking down campaigns by metrics like impressions, clicks, conversion value, and cost per conversion.
Visualize the conversion funnel and plot conversions over time to track improvement.
- Ads Performance
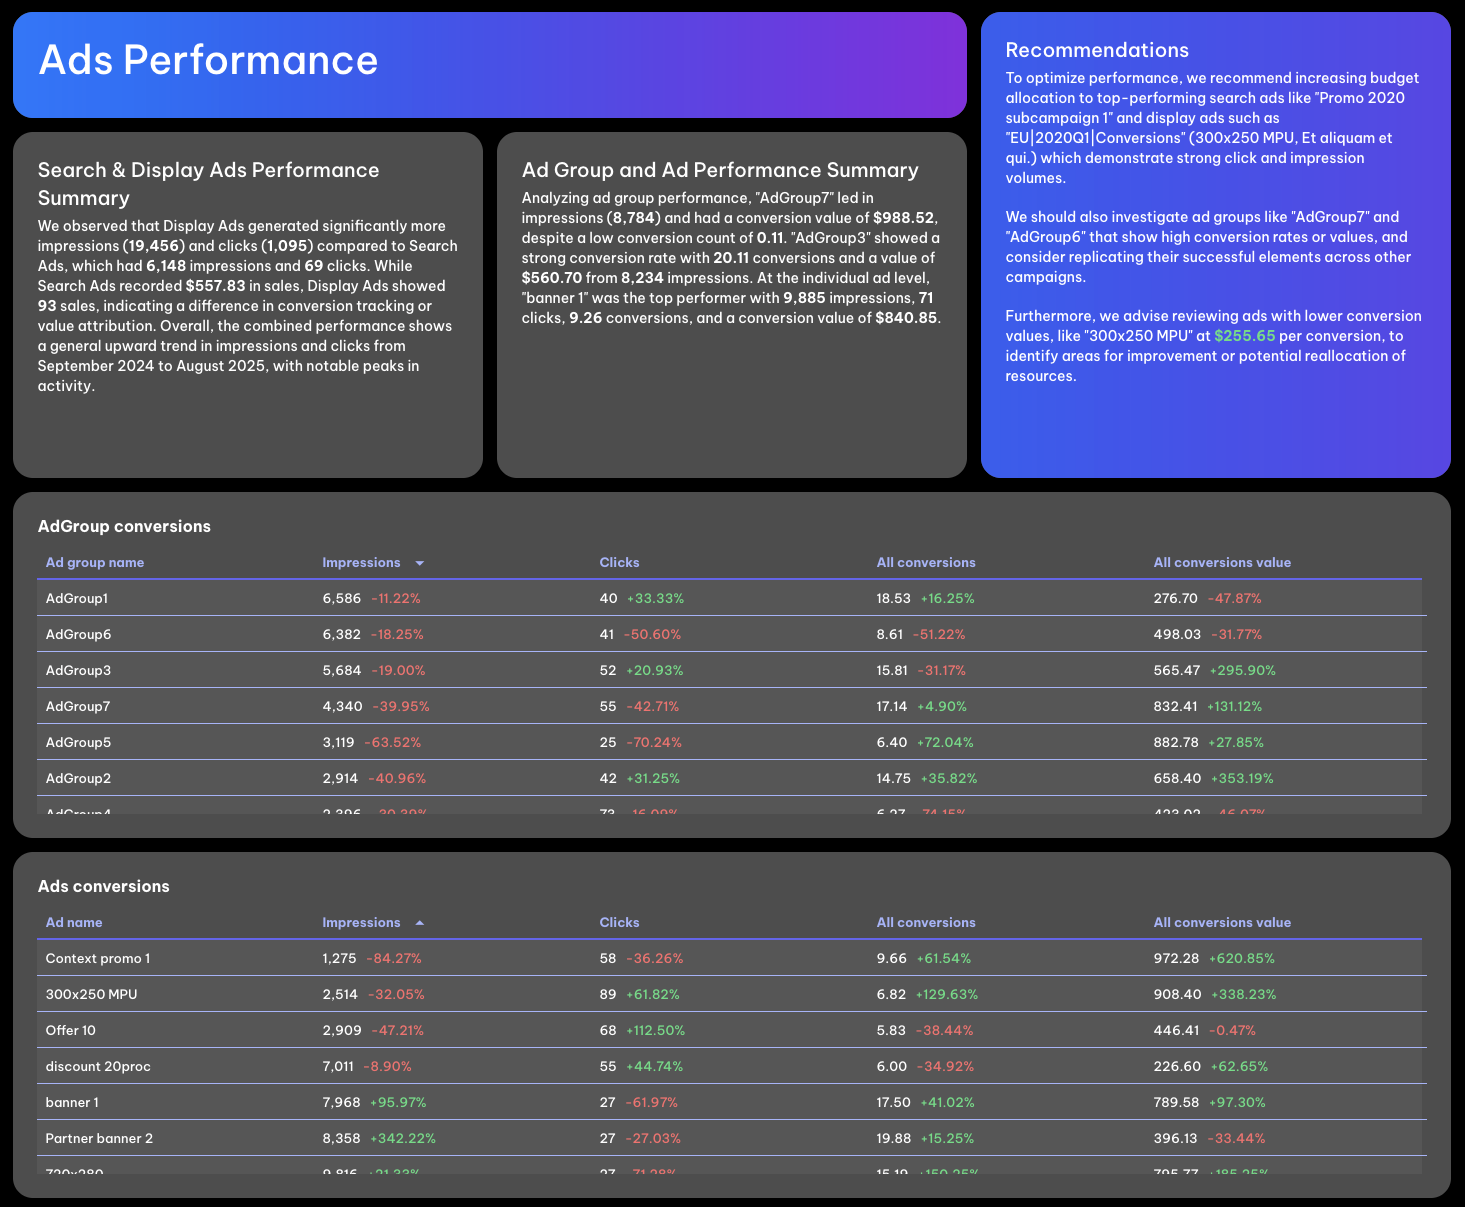
Provide summaries for both search and display ads. Include a pivot table showing ad group performance and ad-level metrics like CTR and conversion rate.
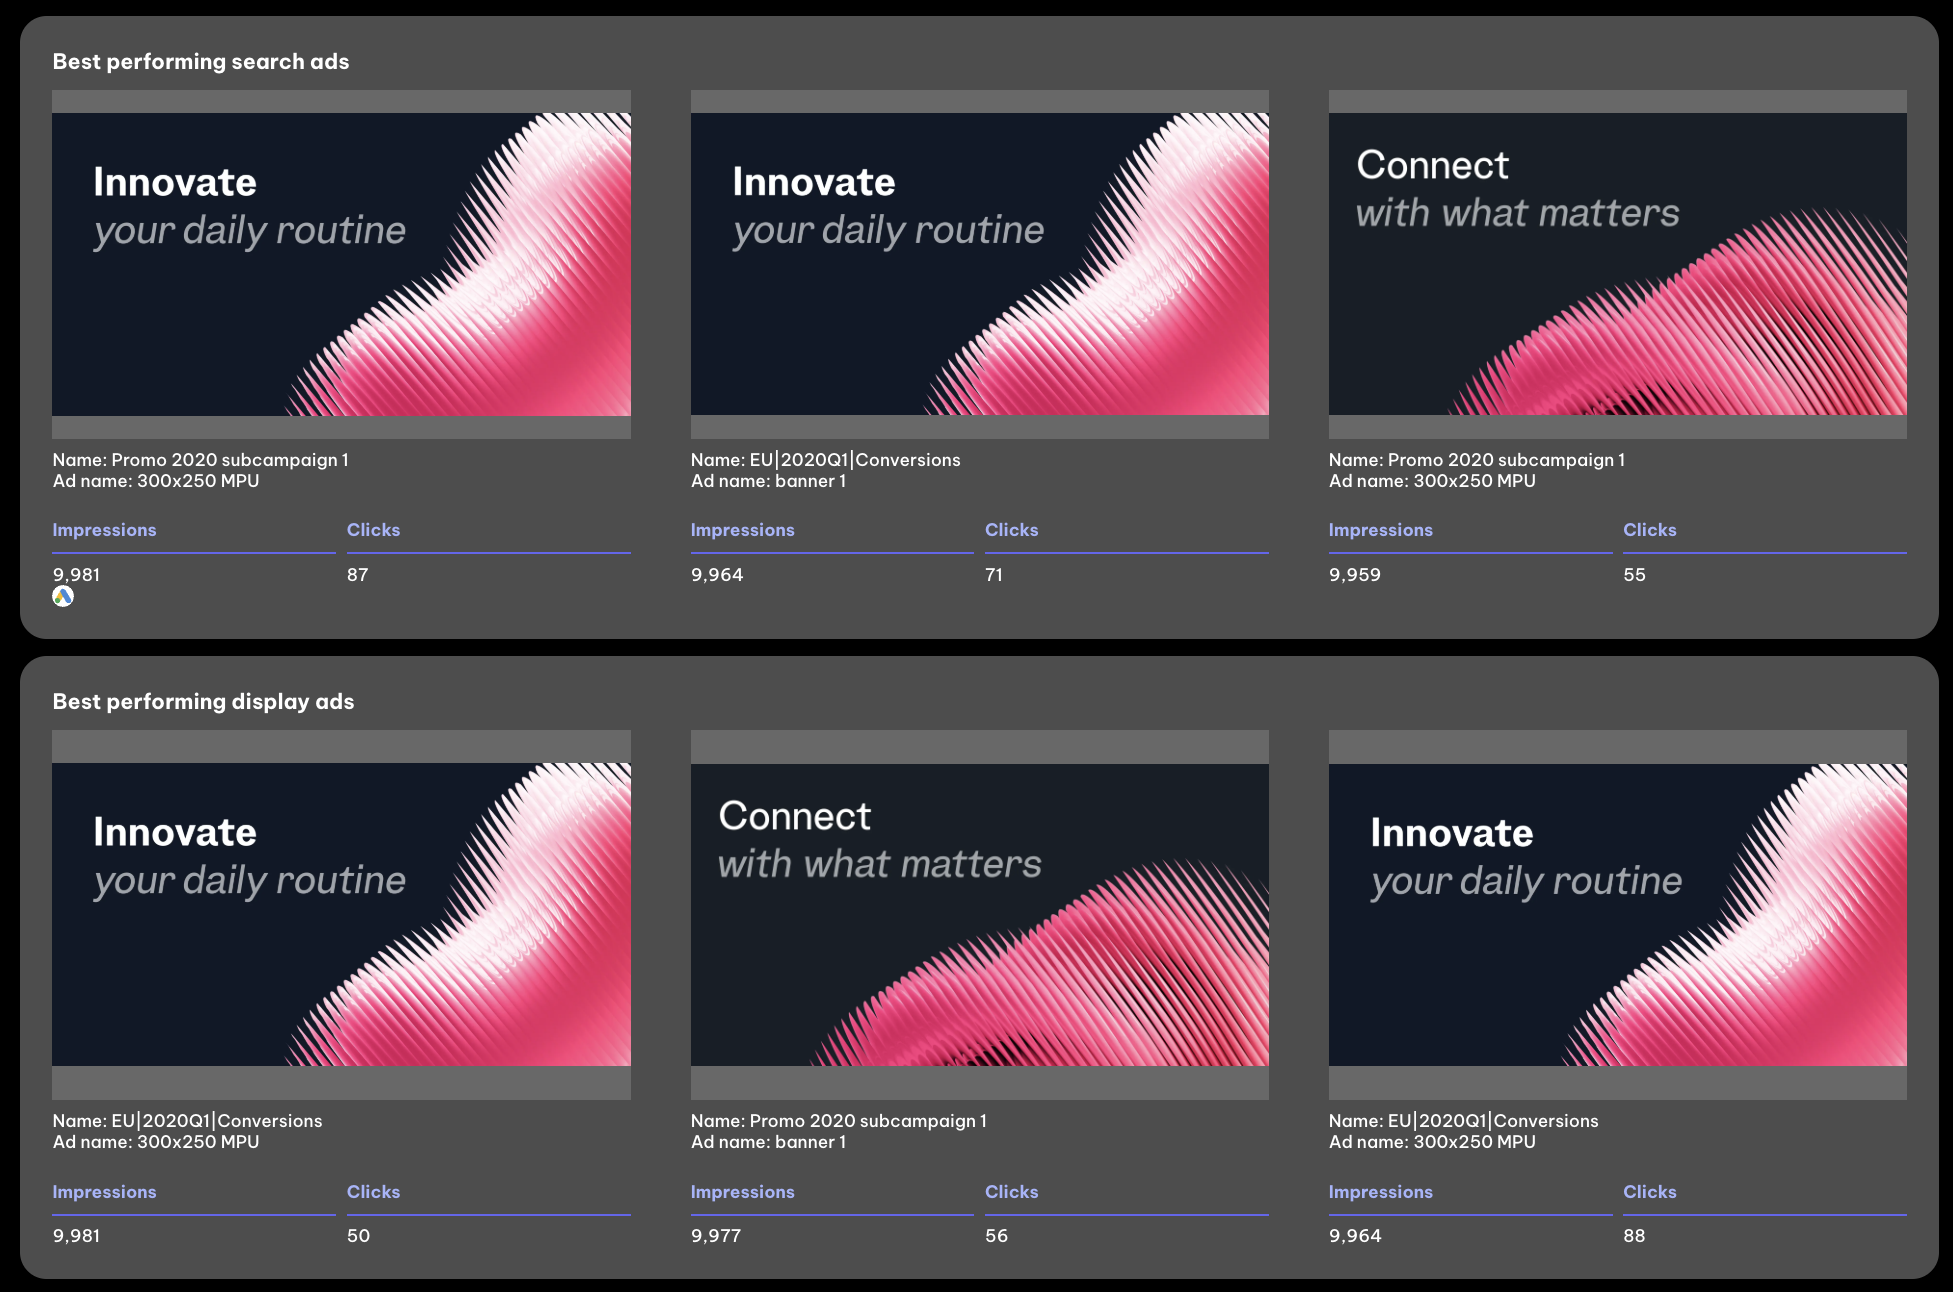
End this section with a carousel of top-performing ads: ideal for showing what creative or copy drives results.
- Keyword Performance
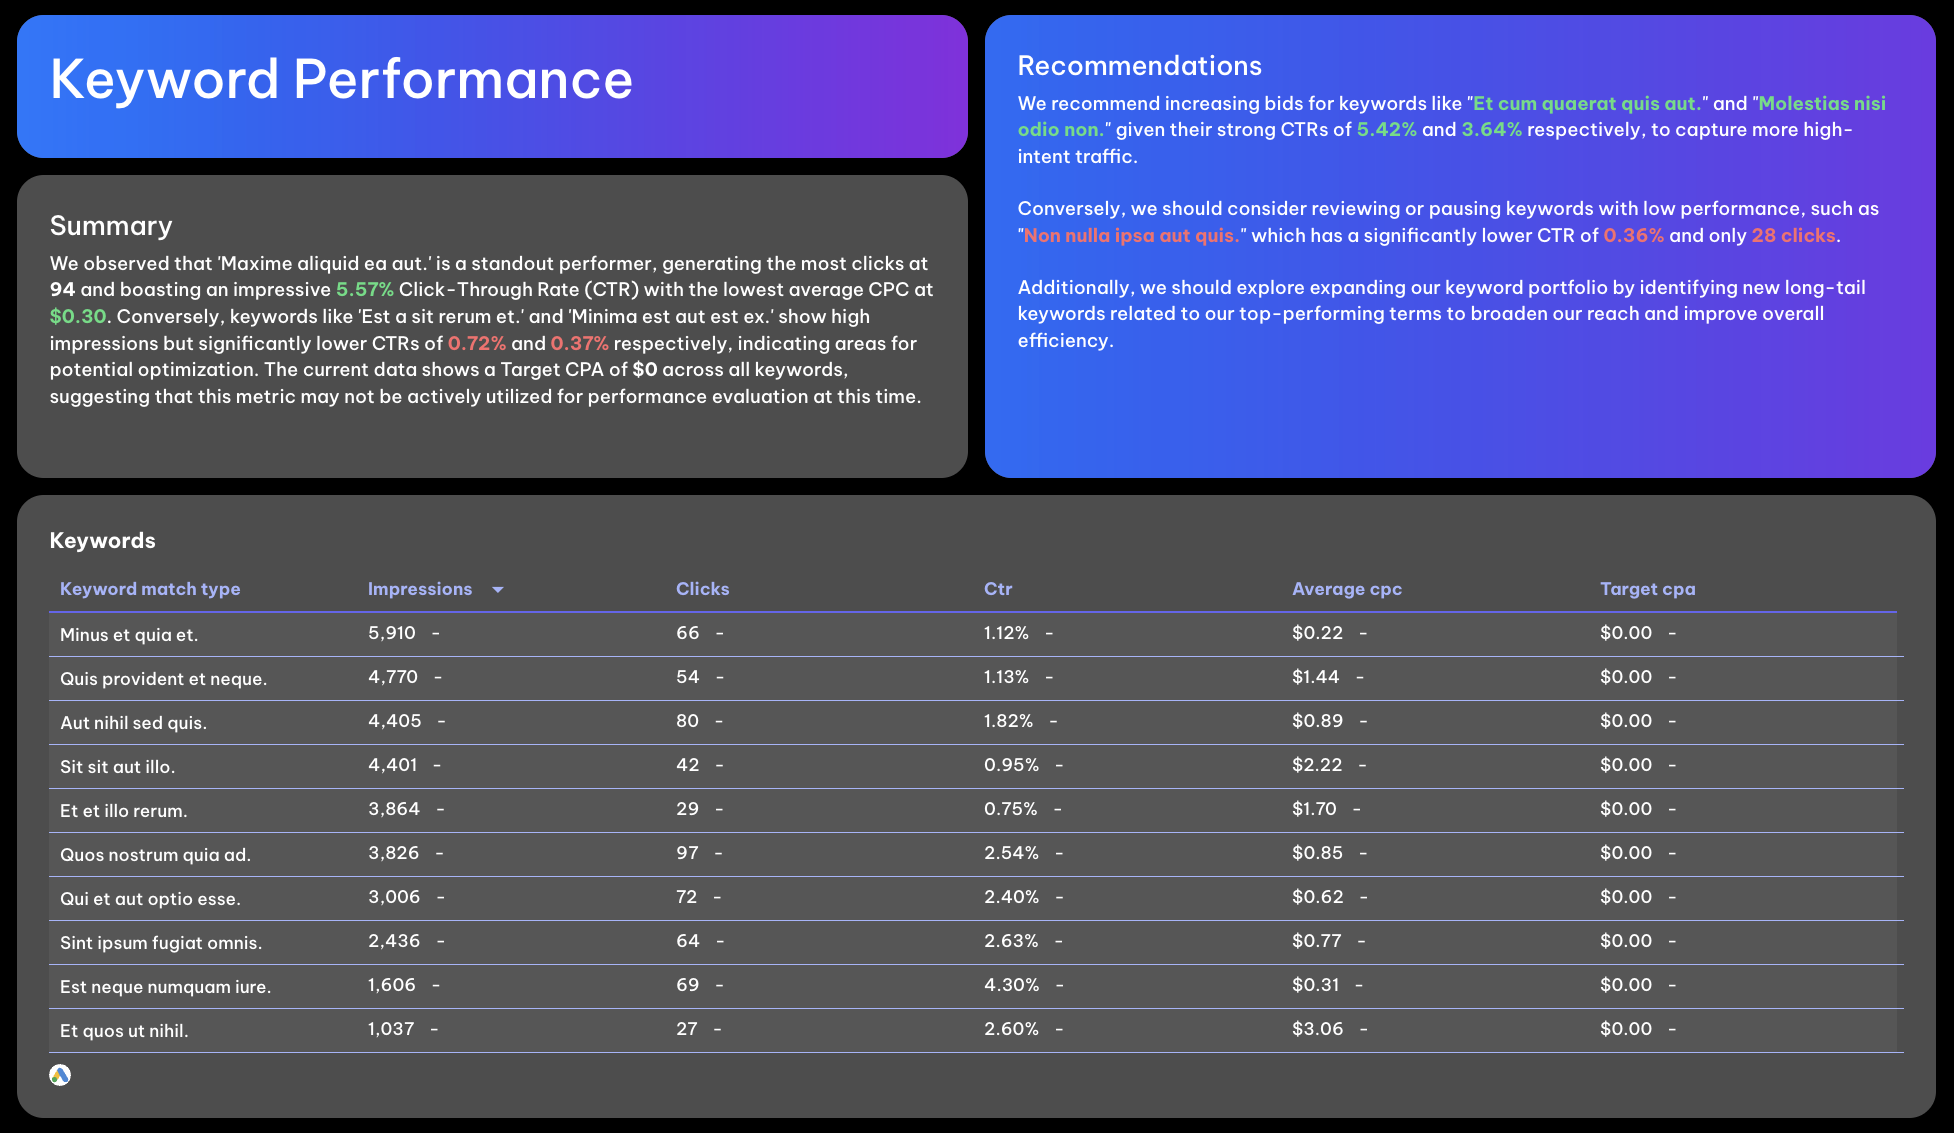
Include a summary of key takeaways. Use a pivot table to display best-performing keywords with metrics like impressions, clicks, CTR, average CPC, and target CPC.
Add recommendations on which keywords to scale or pause based on cost efficiency and conversion performance.
- Audience and Device Breakdown
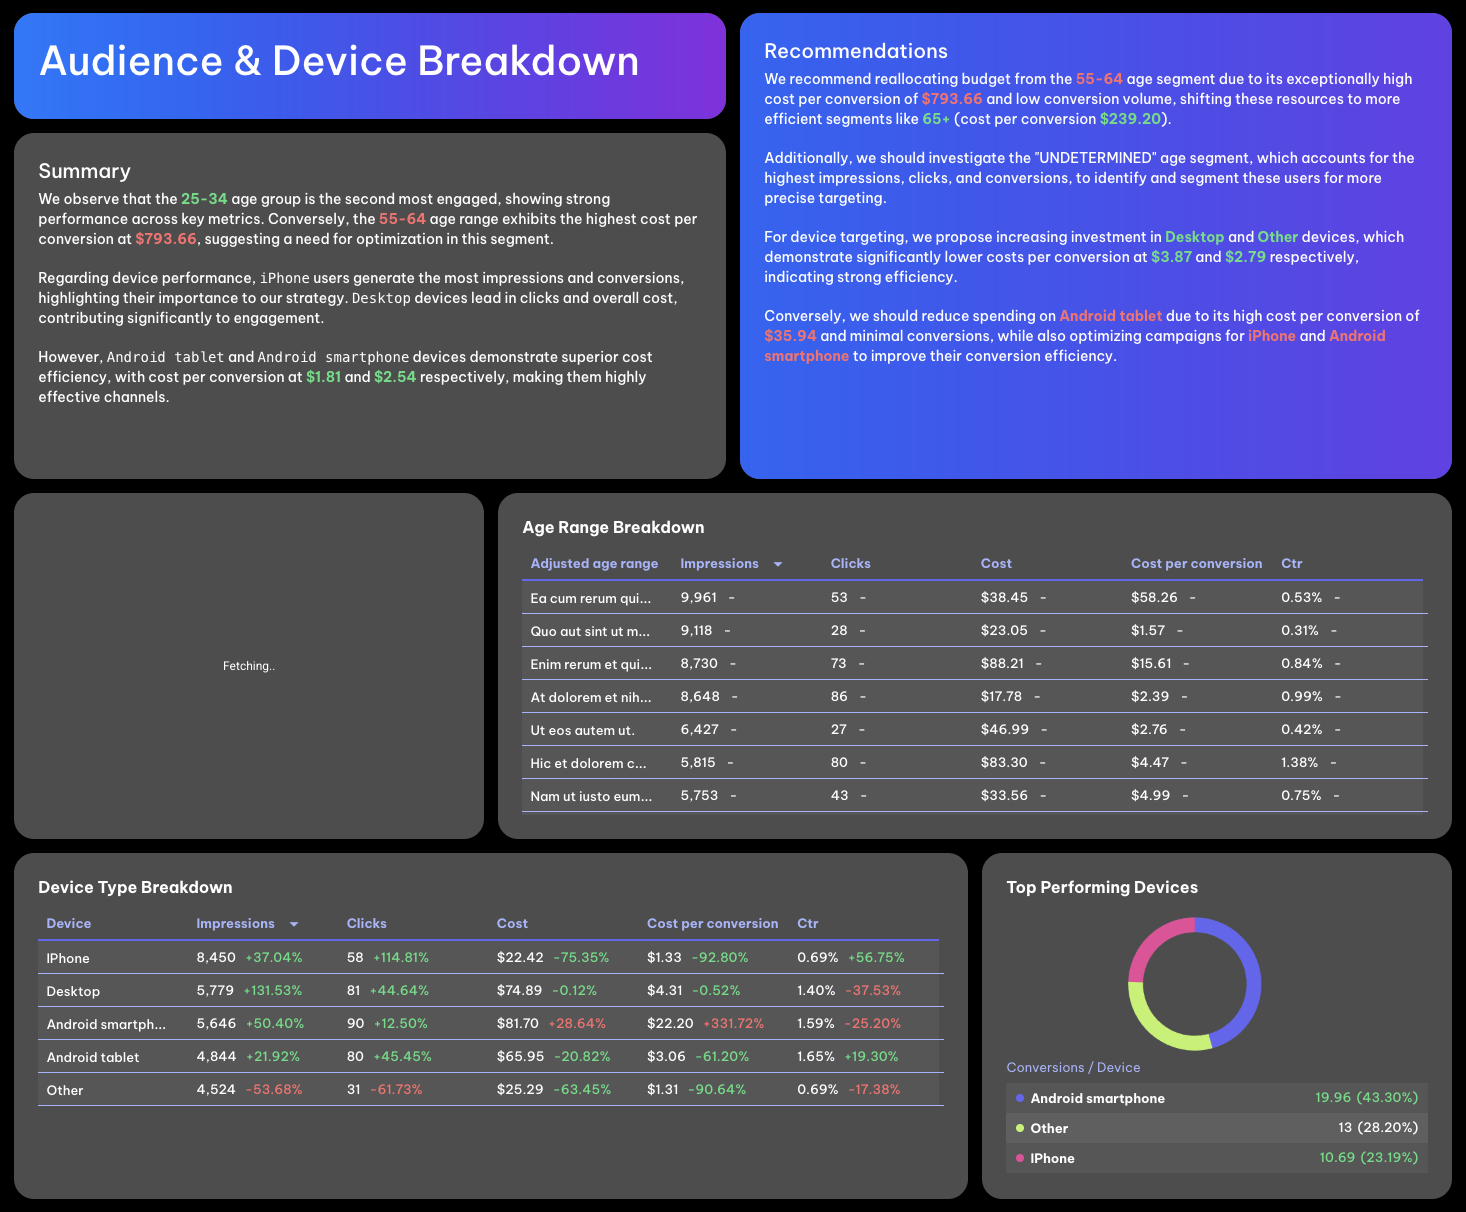
Wrap up with demographic insights. Break down age segments, device types, and other demographics by key metrics such as impressions, clicks, CTR, cost, and cost per conversion.
This helps explain where engagement is strongest and how to optimize ad spend across audiences and devices.
Repeat this structure for each of your paid channels: Meta Ads, LinkedIn Ads, TikTok Ads, and others. Keeping each tab consistent makes it easier for marketing teams and stakeholders to follow the story across platforms.


