Free White Label Facebook Report Template

Wow clients or stakeholders with a fully customizable white-label Facebook report template.

Visualize key metrics, track performance, and get actionable insights for growth.

White Label Facebook Report Template - Engagement breakdown dashboard with charts, funnels, and data visualizations.

How To Use Whatagraph’s White Label Facebook Analytics Report Template

Create Custom White Label Facebook Reports in Seconds

With Whatagraph IQ, just tell us what you need, and we'll build a stunning white label Facebook report for you in seconds. No templates or manual setup needed.

What to Include in a White Label Marketing Report Template

Based on the white label Facebook report template created by marketers at Whatagraph, here’s what your report should include to save time, build trust, and prove ROI to clients and stakeholders.

This plug-and-play format helps automate reporting, eliminate manual work, and keep performance metrics consistent across all your facebook ads accounts.

1. Performance Summary

White Label Facebook Report - A performance summary with charts and metrics.
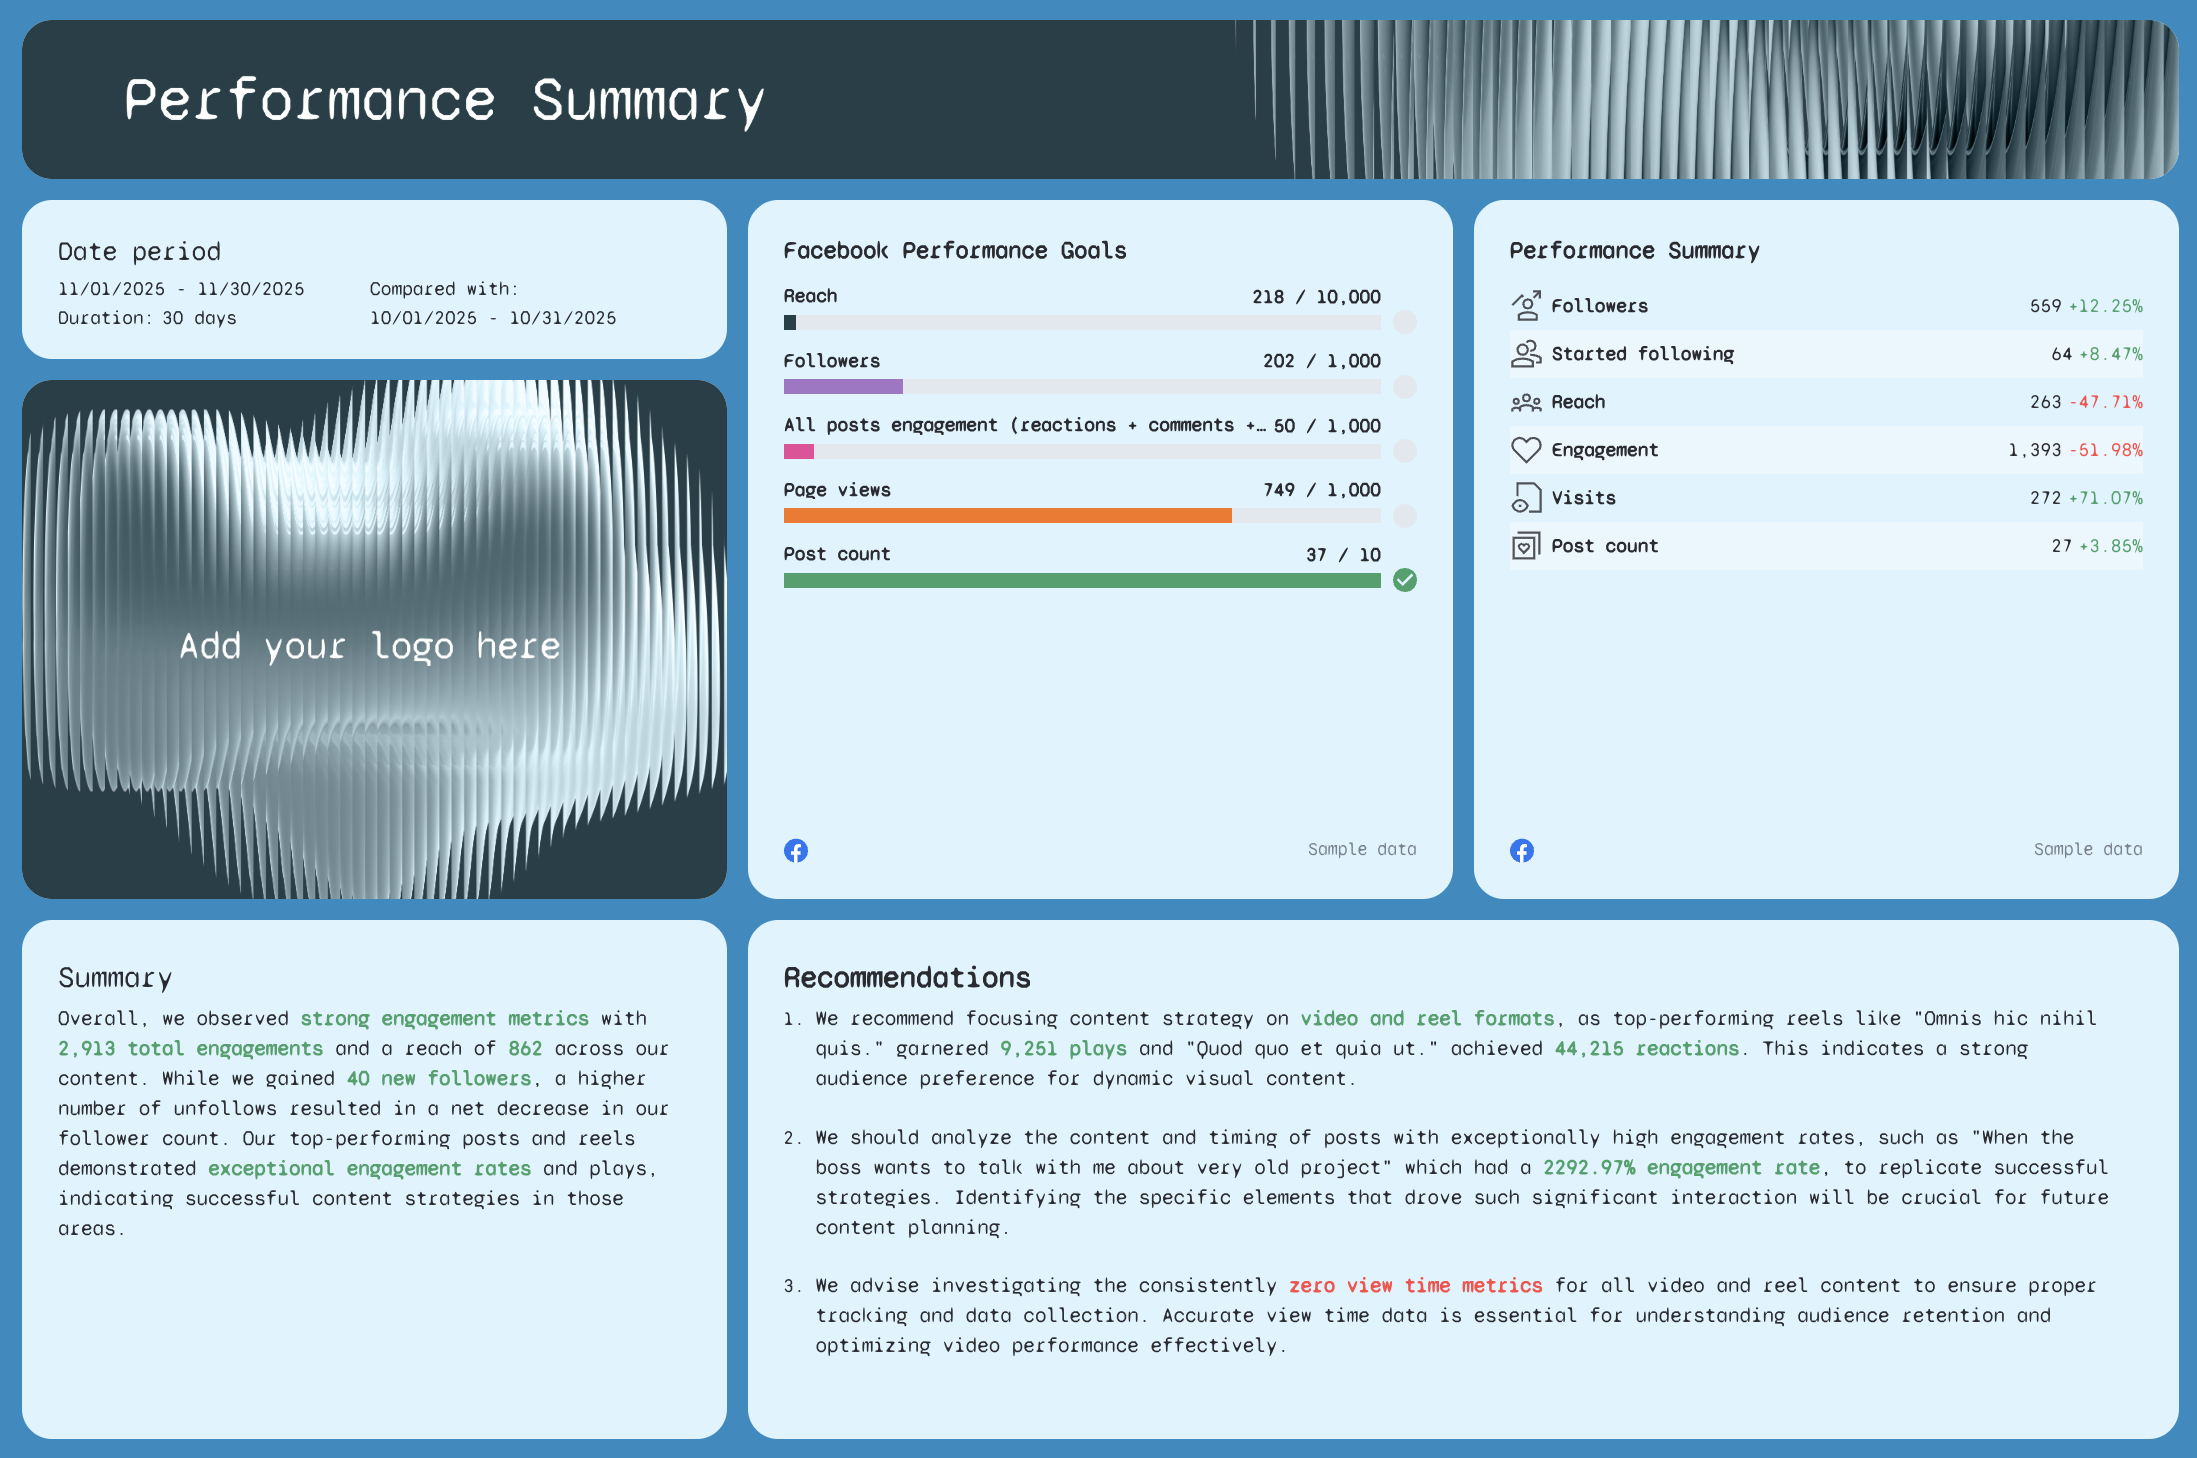
What it’s for: Gives clients or internal stakeholders a fast, executive-level overview of how Facebook campaigns performed over the selected date range.

What to include:

  • Total followers, reach, visits, and engagement
  • Conversion summary and CTR trends
  • KPIs vs. goal tracking using a progress bar or color-coded indicators
  • Written summary with key insights and wins
  • Actionable insights or recommendations
  • Date comparisons for all key metrics

Pro Tip: Add automated comment boxes or annotations to highlight performance trends in your white-label dashboard.

2. Followers Breakdown

Followers Breakdown - A dashboard shows followers, charts, and pie charts for countries and cities.

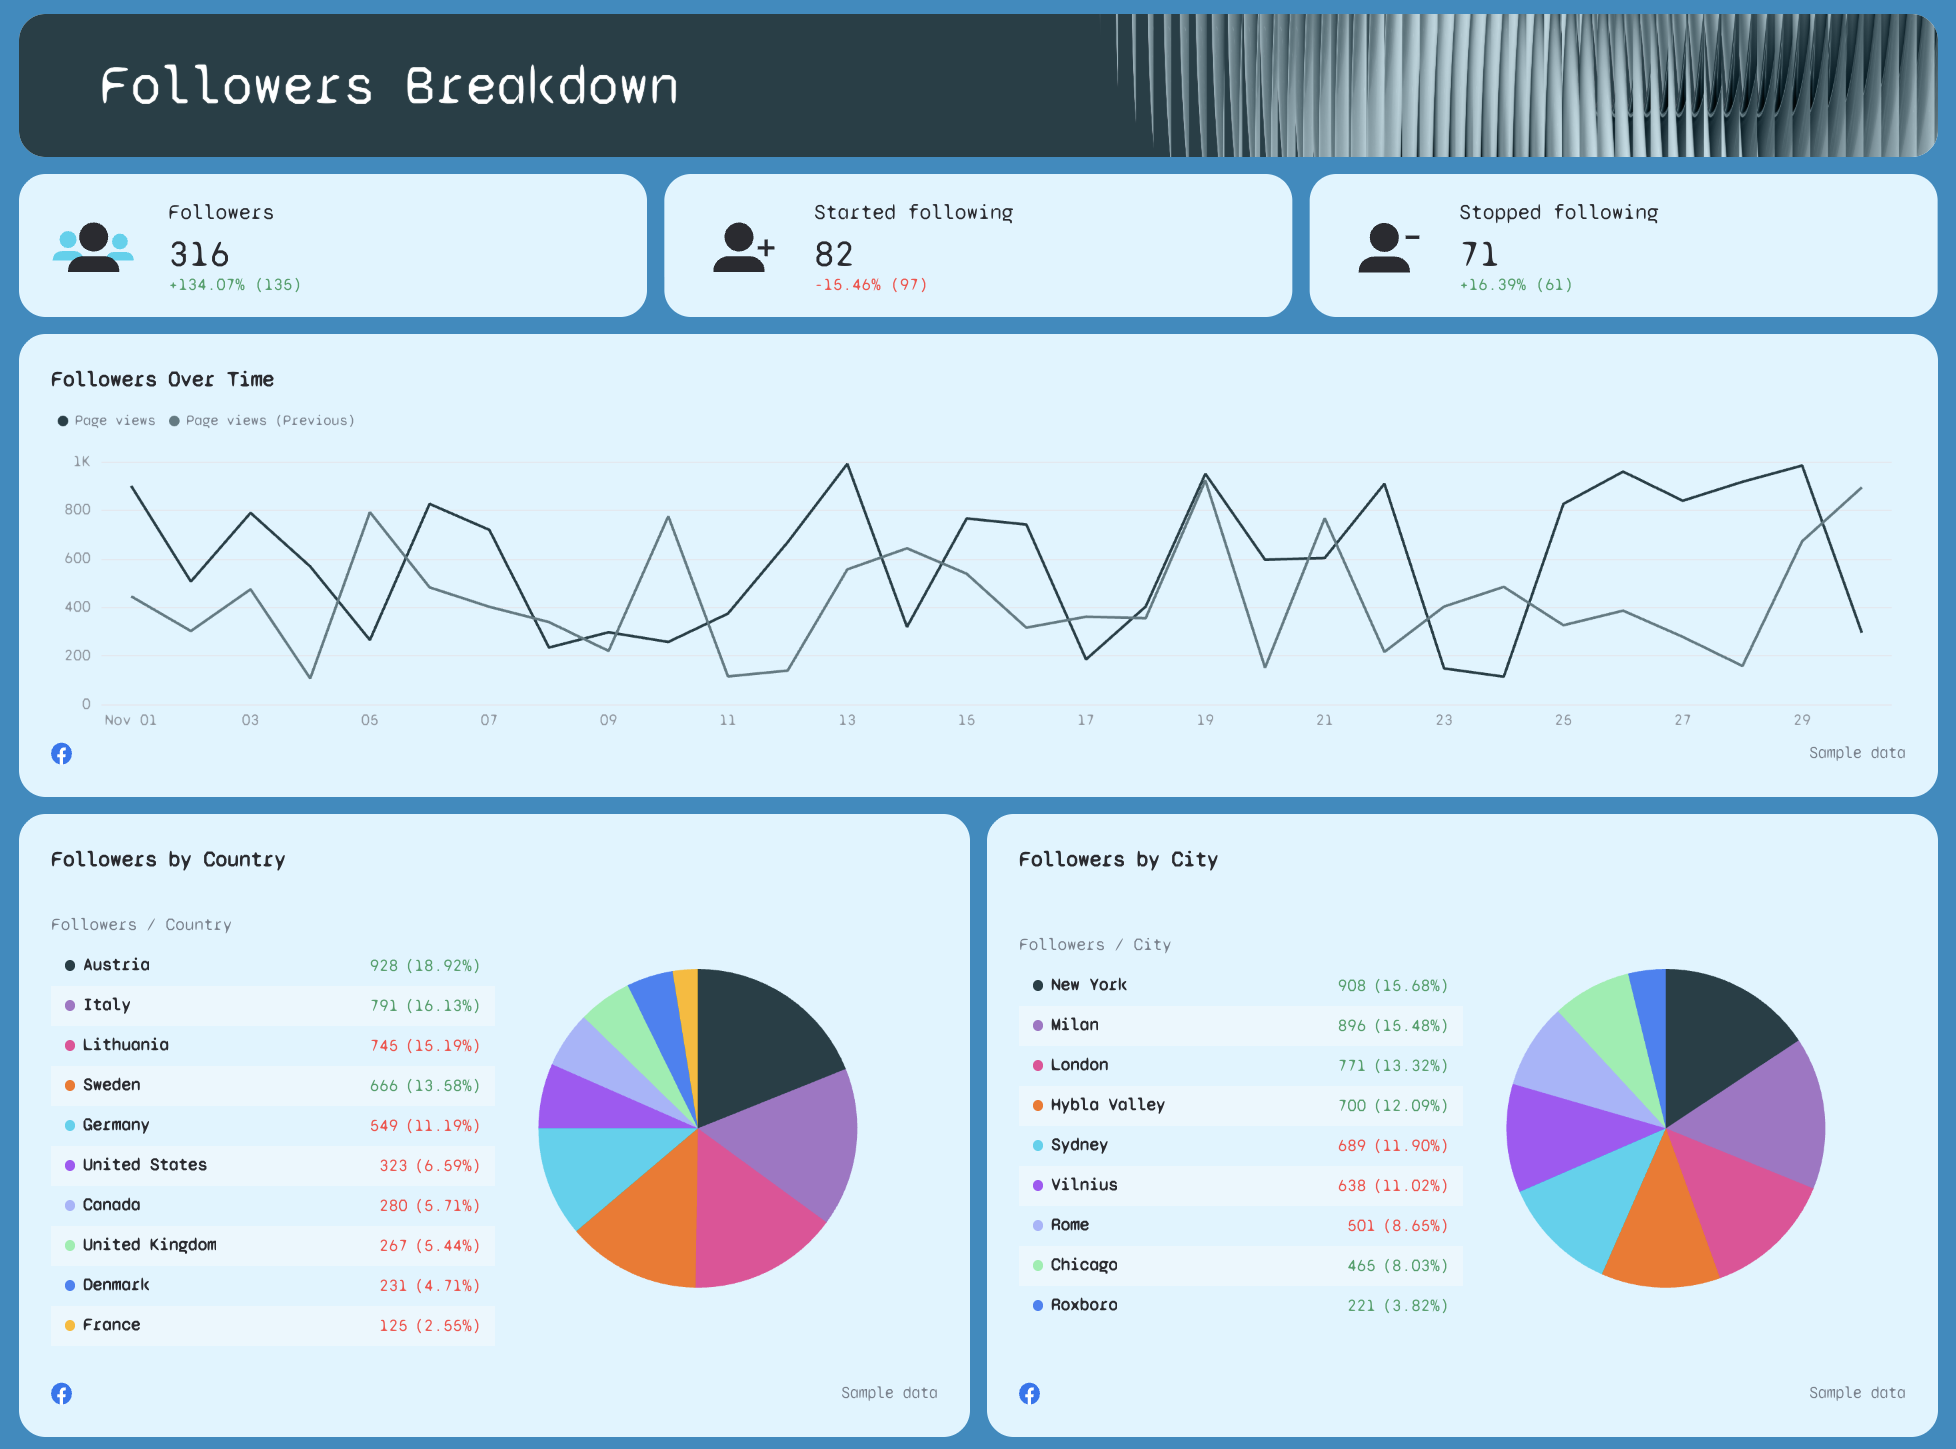
What it’s for: Show how your Facebook Page community is growing and where that growth (or loss) is coming from.

What to include:

  • Total followers, new followers, and unfollows
  • Followers by country and city with demographics charts
  • Trend graphs showing followers over time
  • Breakdown of audience shifts compared to previous periods

This section is especially useful for social media managers and marketing agencies to prove audience engagement and audience growth over time.

3. Impressions & Reach Breakdown

White Label Facebook Report - Facebook report showing impressions, reach, and page views data.

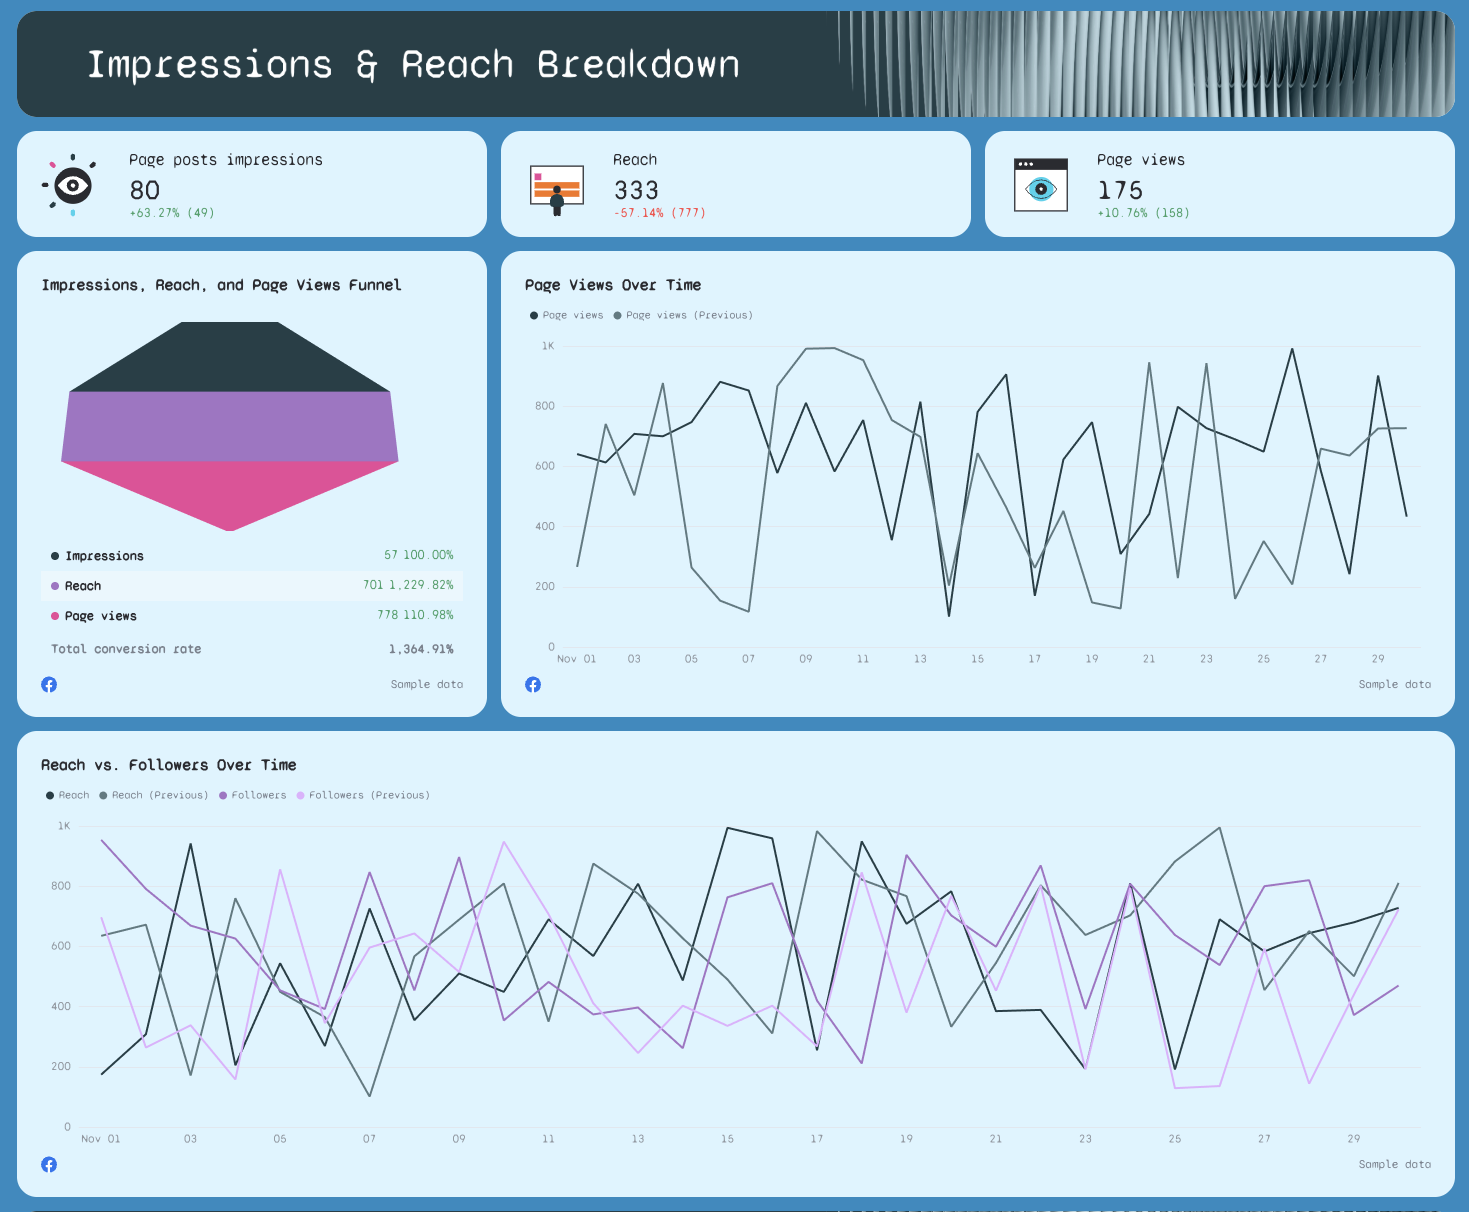
What it’s for: Measure how far your content spreads and who’s seeing it.

What to include:

  • Total impressions and reach
  • Reach vs. post engagement over time graph
  • Funnel view from impressions → reach → page views
  • Comparison with previous month’s reach data
  • Regional reach segmentation if applicable

Bonus: Add filters using integrations like Google Analytics for attribution clarity.

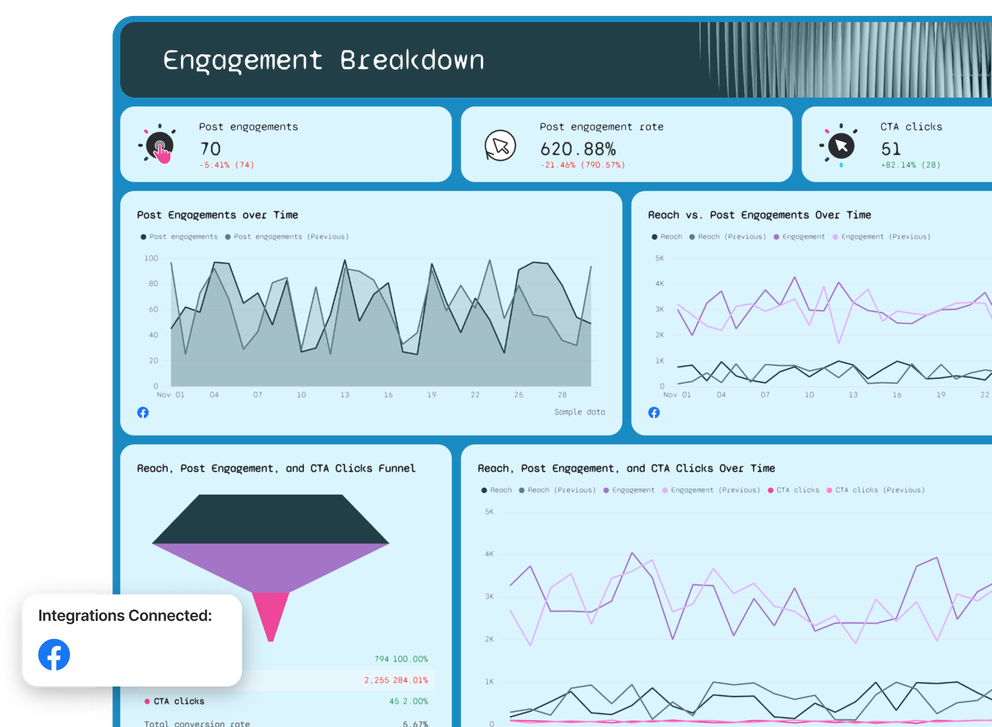
4. Engagement Breakdown

Engagement Breakdown - Dashboard with engagement metrics, line charts, and a funnel graphic.

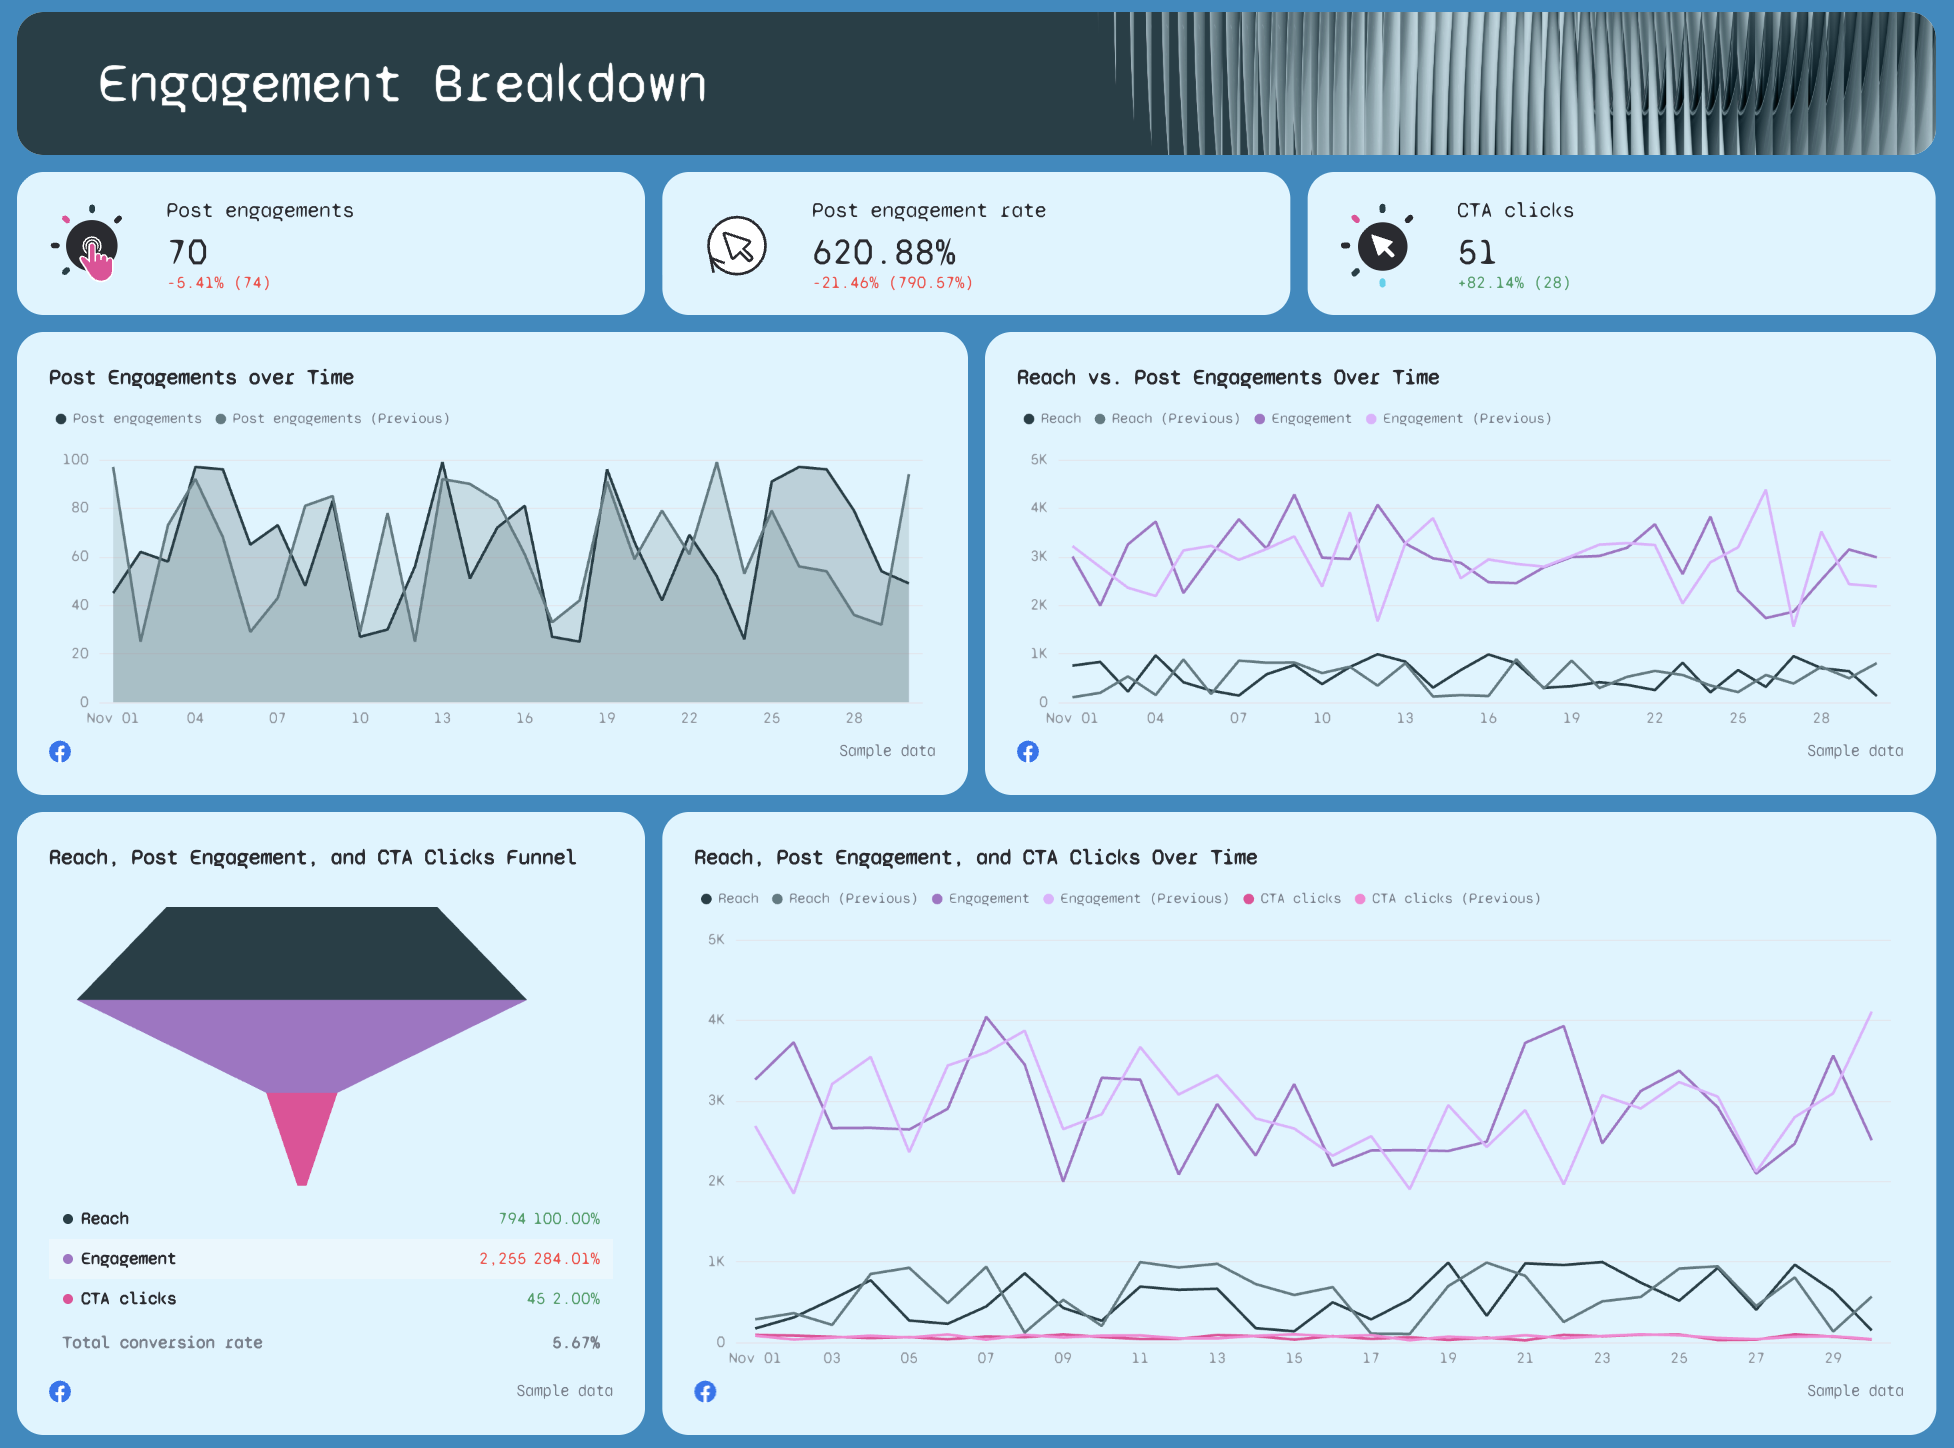
What it’s for: Evaluate how well your content connects with your target audience.

What to include:

  • Total engagement metrics: likes, comments, shares
  • Post engagement rate
  • Reactions by type (Like, Love, Wow, etc.)
  • Trend line: Reach vs. Engagement vs. CTA clicks
  • Click-through rate (CTR), engagement rate, and conversion rates

Highlight standout posts or interactions that drove performance using widgets for visual emphasis.

5. Top Performing Posts

Top Performing Posts - A table displaying top posts with metrics like views, engagement, reactions and example social media posts

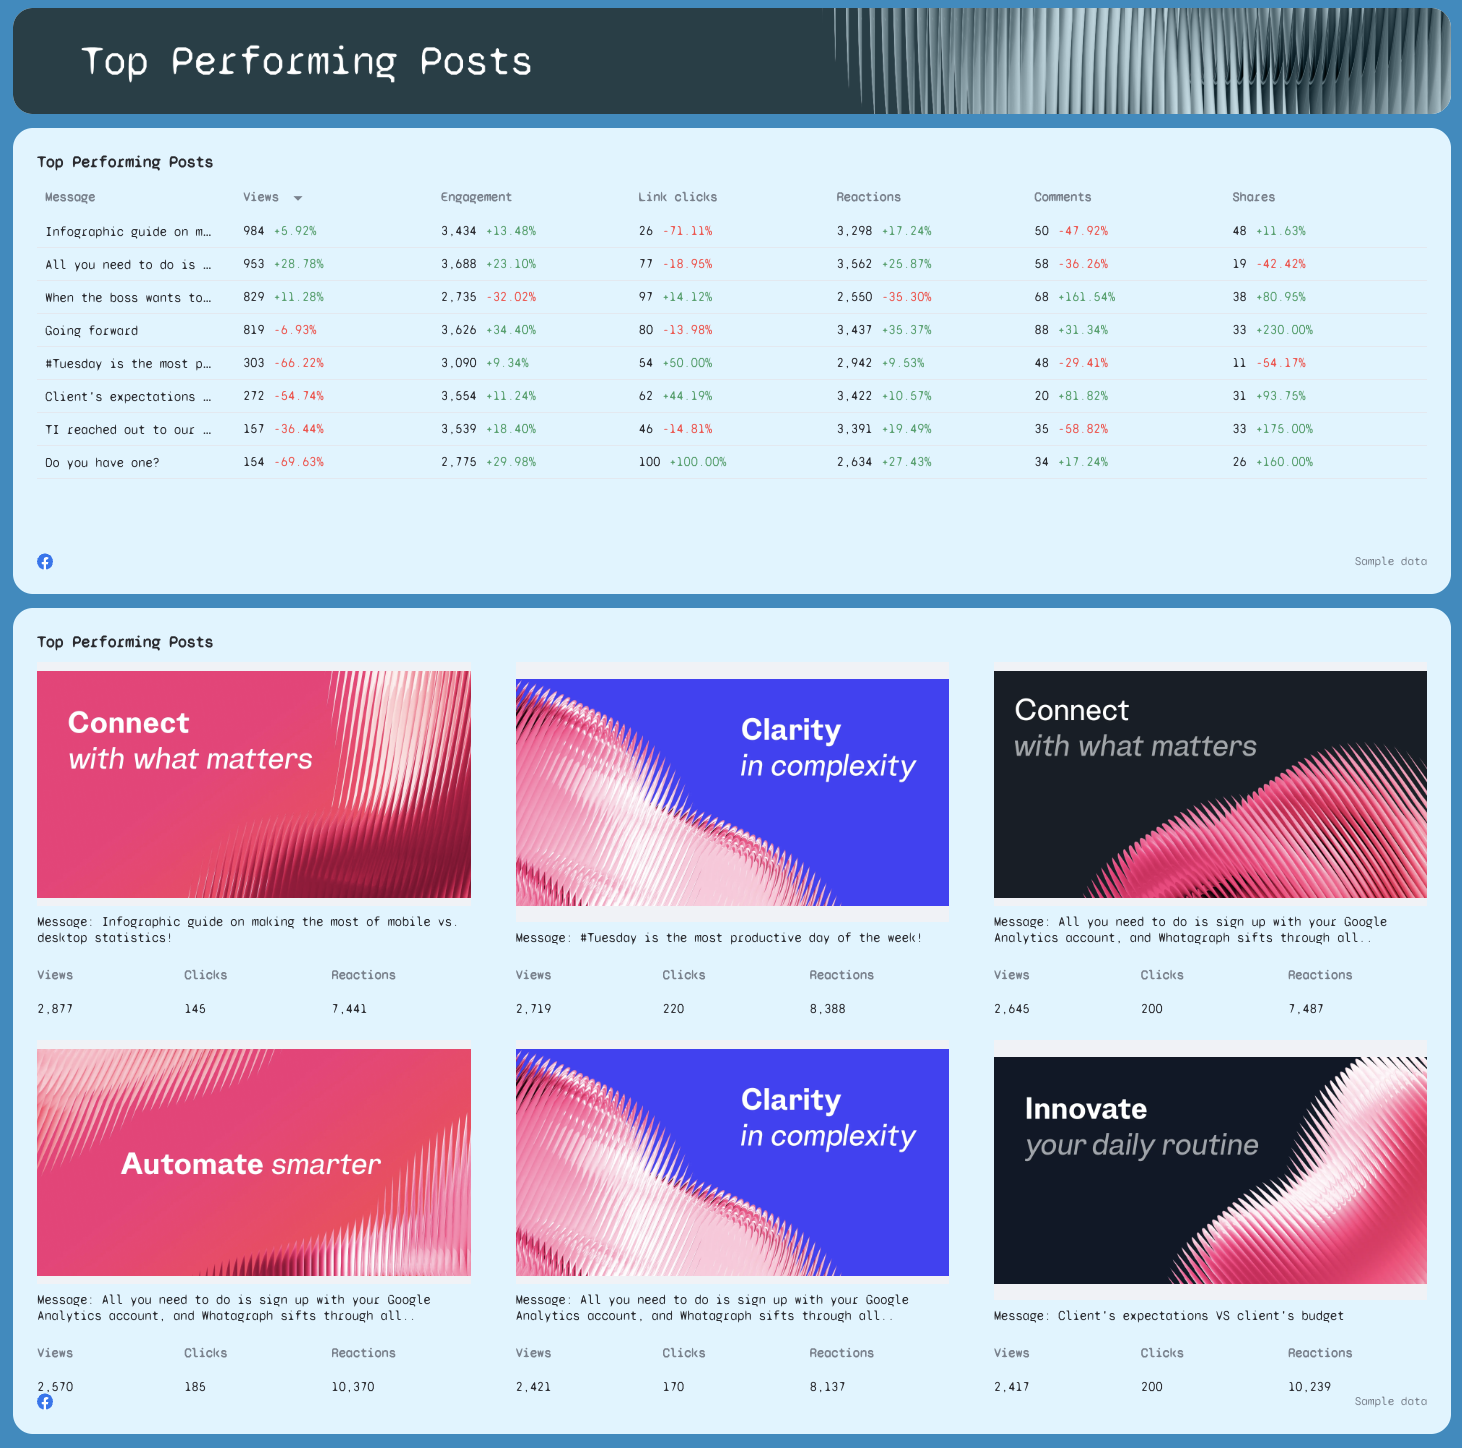
What it’s for: Prove what’s working and what to scale.

What to include:

  • Post-by-post performance table: reach, impressions, engagement, link clicks
  • Engagement rate per post
  • Side-by-side comparisons of top vs. underperforming posts
  • Thumbnails or screenshots of each post to show visuals

This section helps optimize future ad campaigns and facebook ads content based on past performance.

6. Reels Performance

Reels Performance Breakdown - Report displaying reels performance metrics with charts and data tables.

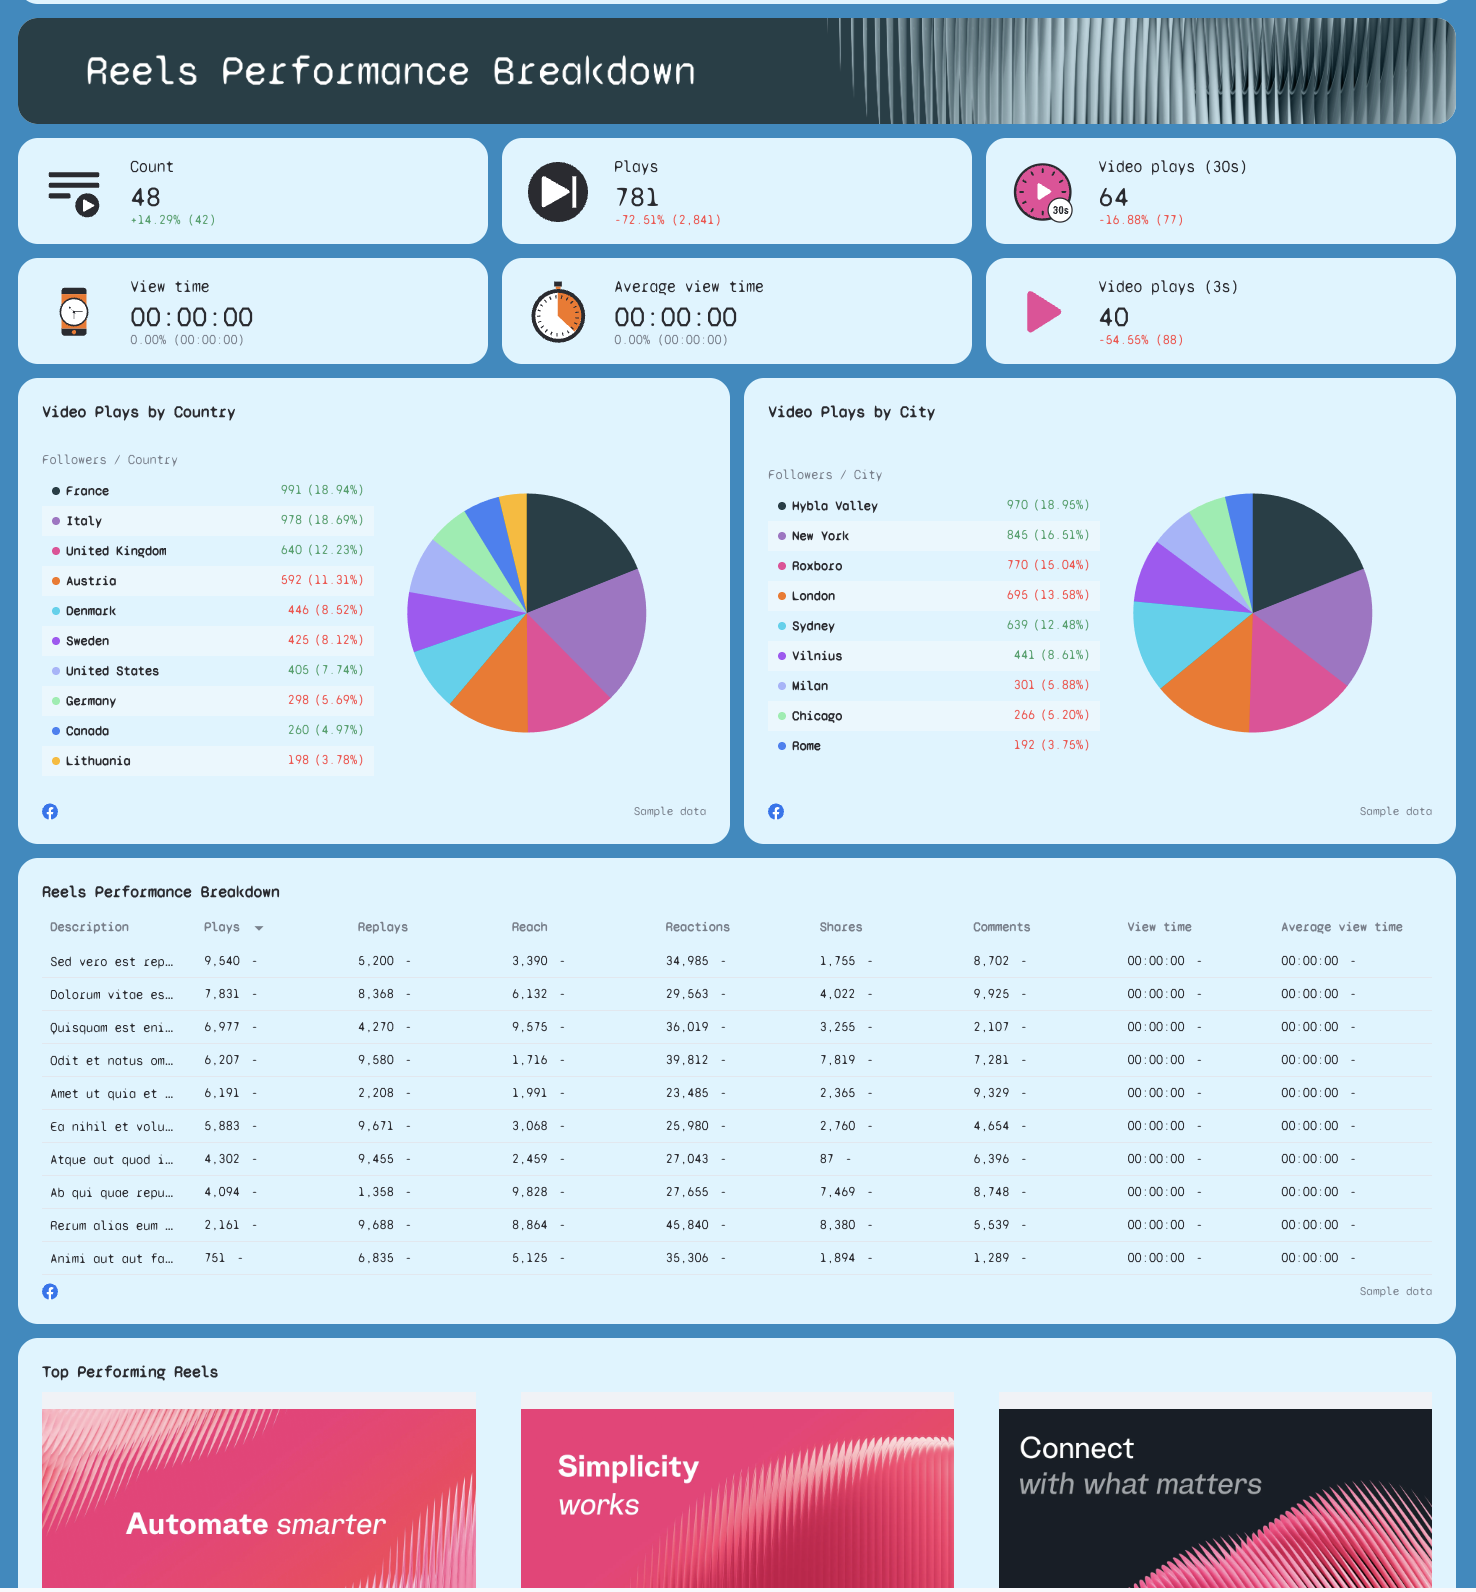
What it’s for: Measure short-form video impact—a key format for facebook ads success.

What to include:

  • Reel-by-reel breakdown: plays, reach, reactions, shares, comments
  • View time and average view duration (flag if data is missing or needs fixing)
  • Performance by country and city
  • Top performing reels table with thumbnails
  • Recommendations based on view and reaction spikes

For agencies managing e-commerce brands, reels performance can signal which content formats support conversions.

Connect All Your Marketing Data in One Place

Bring all your marketing data into one place with no-code, stable connectors that you don't need to babysit. 

Why Marketers Love Reporting on Whatagraph

Whatagraph's AI is saving so much time and energy for our marketing specialists. We now have more time to focus on strategic things that help both our agency and our clients grow.

Lars Maat

Lars Maat

Co-Founder @ Maatwerk Online

StarStarStarStarStar

Whatagraph has become an essential partner for scaling our reporting, and my teams love it because it saves so much time. We’d recommend it to any team looking to automate data reporting and use AI for insights.

Danielle Roberts

Danielle Roberts

Director of Implementation & Support @ Rentable

StarStarStarStarStar

Whatagraph is easy to use, visually attractive, and much smoother compared to tools like Looker Studio.

Stef Oosterik

Stef Oosterik

Quality Manager @ Dtch. Digitals

StarStarStarStarStar

Whatagraph took us to the next level with our clients and within our team. Our relationships with clients have been amazing, and we’ve even been able to retain them longer.

Kim Strickland

Kim Strickland

Digital Marketing Specialist @ Peak Seven

StarStarStarStarStar

Frequently Asked Questions

Have more questions? We answered them here.

What is white-label reporting?

White-label reporting lets marketing agencies and in-house teams present client reports with their own branding—logos, fonts, and colors—while hiding the underlying reporting tool. With white-label reporting, you can share automated reports via live links or PDFs, all without “powered by” logos, making it feel like your agency built the entire system.

What is white label Facebook Ads management?

White label Facebook Ads management is when an agency or provider runs facebook ads on behalf of another agency’s clients, but under that agency’s brand. This service typically includes ad setup, campaign performance optimization, and delivering branded reports using a facebook ads report template—all while staying invisible to the end client.

What is a Meta report template?

A Meta report template is a ready-made report template built specifically for reporting on Meta Ads (formerly Facebook Ads). It tracks essential metrics like CTR, conversion rates, ad spend, and engagement rate, using pre-configured widgets and visualizations. Whatagraph’s template comes fully white-labeled and can connect to your facebook ads account in seconds.

How do white-label reports work?

White-label reports work by pulling data from platforms like facebook ads manager, google analytics, linkedin, or crm tools through integrations and presenting it in a polished, branded format. On Whatagraph, you:


- Connect your data sources.


- Use a pre-built facebook ads report template or build a custom report.


- Automate delivery using automated reporting options.


- Apply your branding using a white-label reporting tool—including custom domain, logos, and styles.
 

This cuts manual work and gives your clients a consistent, professional experience.

What metrics should be included in a Facebook report?

A solid Facebook Ads report should include:


- Ad spend and impressions
 

- Clicks, CTR, and conversions
 

- ROAS or cost per result
 

- Audience demographics (age, gender, location)
 

- Top ad campaigns and creative performance
 

- Engagement metrics like likes, shares, comments
 

- Performance metrics like reach vs. conversions over time


These key performance indicators (KPIs) help agencies optimize ad spend and prove ROI to stakeholders.