
What is a YouTube analytics report template?
A YouTube analytics report template is a pre-built layout that helps you track, organize, and present performance data from your YouTube channel - without rebuilding the same report every month.
Instead of logging into YouTube Studio, exporting data manually, and reformatting everything into a Google Sheets tab or a Looker Studio template, a YouTube analytics report template pulls your channel performance data into one structured, visual format your team or clients can actually read.
The scale of YouTube makes getting this right non-negotiable. According to the 2026 report from DataReportal, YouTube is the number one online video platform in the world.
And the audience isn't passive - Sprout Social's 2024 report found that 47% of YouTube users engage with brands on the platform at least once a week, and 32% do so daily.
That kind of reach creates a real reporting obligation.
If you manage YouTube for clients, or track it alongside other marketing channels like Google Ads, SEO, or social media, you need a consistent, repeatable way to show what's actually working.
A solid YouTube analytics report template should help you:
✅ Track key metrics like watch time, views, CTR, average view duration, and subscriber growth in one place
✅ Break down video performance by content type, publishing period, or campaign
✅ Show audience demographics and retention trends, not just raw view counts
✅ Connect YouTube data to your wider marketing channels for a full-picture view
✅ Share reports through live links, scheduled emails, or PDF exports - without manual prep each time
The manual approach to YouTube reporting adds up quickly. Wise Pirates, a digital agency managing 200+ clients, found that writing out insights was taking up 60-70% of report creation time.
After centralizing their reporting in Whatagraph and using AI Summaries to automate that process, the team cut report build time significantly.
Whatagraph is really simple to use, intuitive, and perfect for marketing teams with limited technical knowledge. Even those without any technical background can quickly build reports, get fast insights, and deliver consistent, high-quality reports to clients at scale. - André Cardoso, Project and Performance Marketing Manager at Wise Pirates
Most YouTube analytics tools still require you to pull data manually and build layouts piece by piece.
Whatagraph IQ generates the full YouTube analytics report from a single prompt.
What To Include in a YouTube Channel Analytics Report Template?
A complete YouTube analytics report template organizes your channel’s most important results into clear, structured sections — from performance summaries to audience insights.
Below are the key sections every YouTube performance report should include:
1. Performance Summary
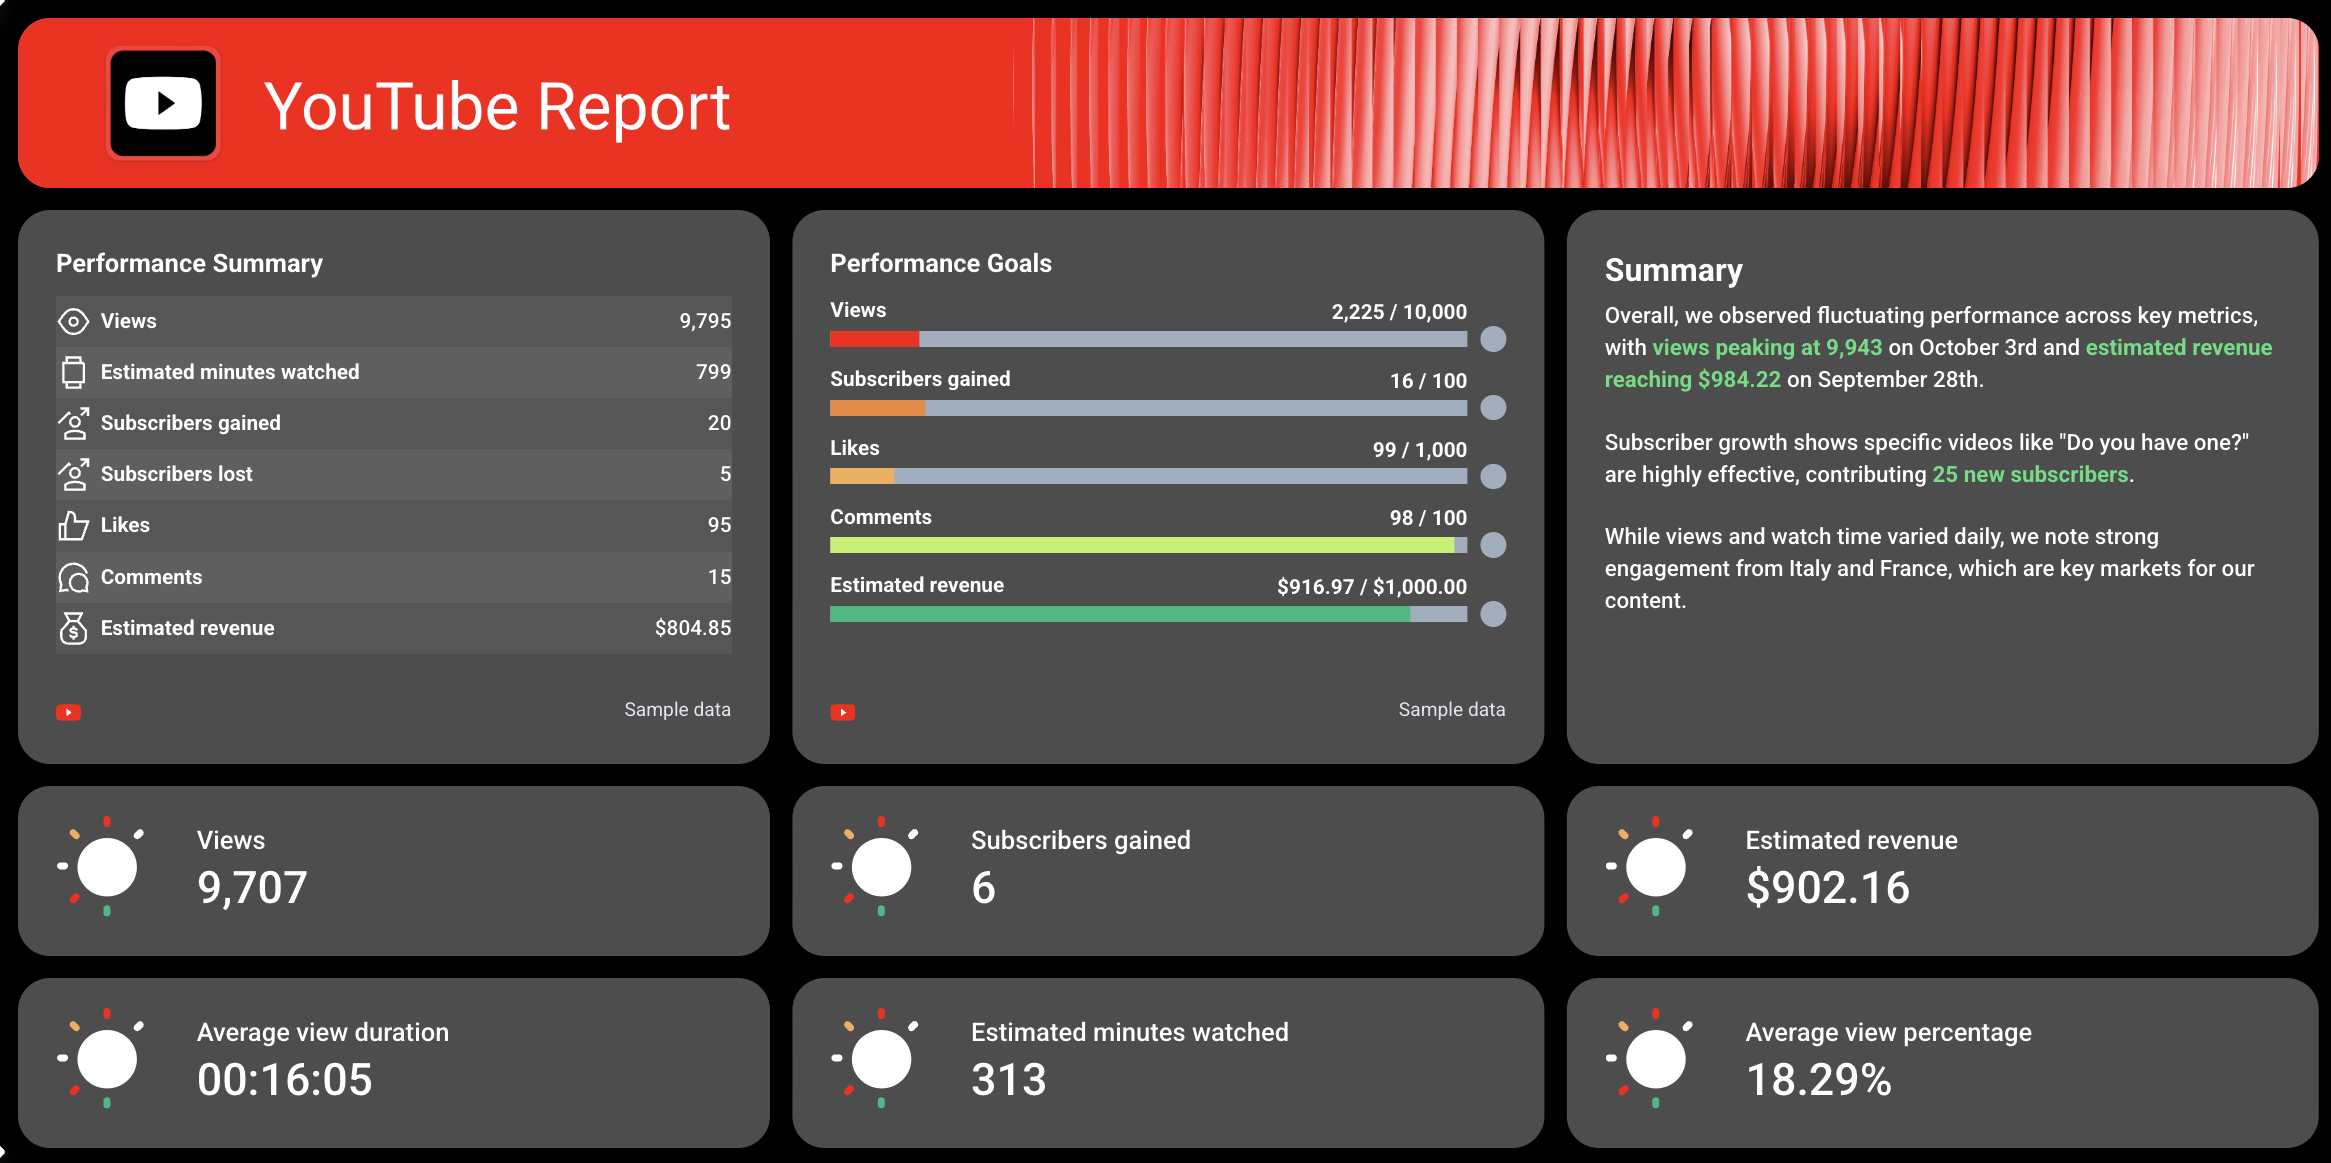
Every great YouTube dashboard starts with a Performance Summary that outlines your most important KPIs.
Include:
- A performance summary list with total views, estimated minutes watched, likes, comments, subscribers gained or lost, and estimated revenue.
- A goal widget that visually shows how close you are to reaching your YouTube channel targets, like total subscribers, views, or earnings.
- A written summary section powered by Whatagraph IQ, so you never have to write summaries manually. IQ automatically analyzes your YouTube data and generates insights like “top-performing videos,” “subscriber trends,” or “content improvement opportunities.”
You can also highlight key metrics such as total watch time, average view duration, and engagement rate to assess how well your video content performs over time.
The goal here is focus, not volume. Packing too many KPIs into the summary section makes it harder - not easier - for clients or stakeholders to read the report.
As Elizabeth Greene, Co-Founder of Junglr, puts it:
A dashboard with 27 million different metrics is often unhelpful or confusing. What we've focused on is identifying the core KPIs that help us quickly spot when something is going wrong in an account - because we want to catch negative trends as early as possible.
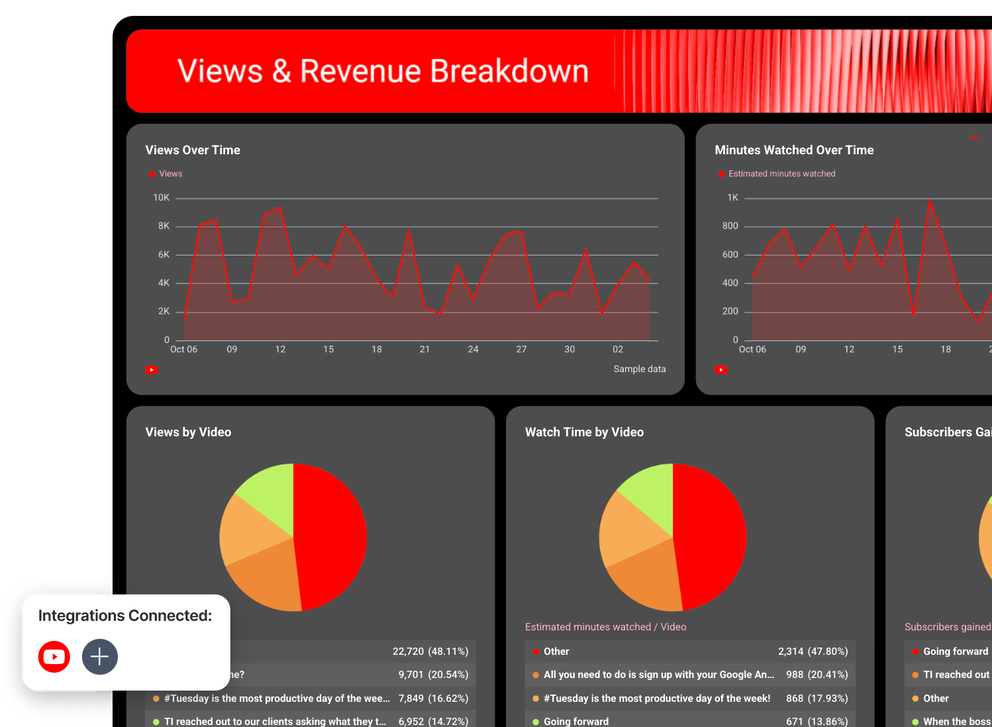
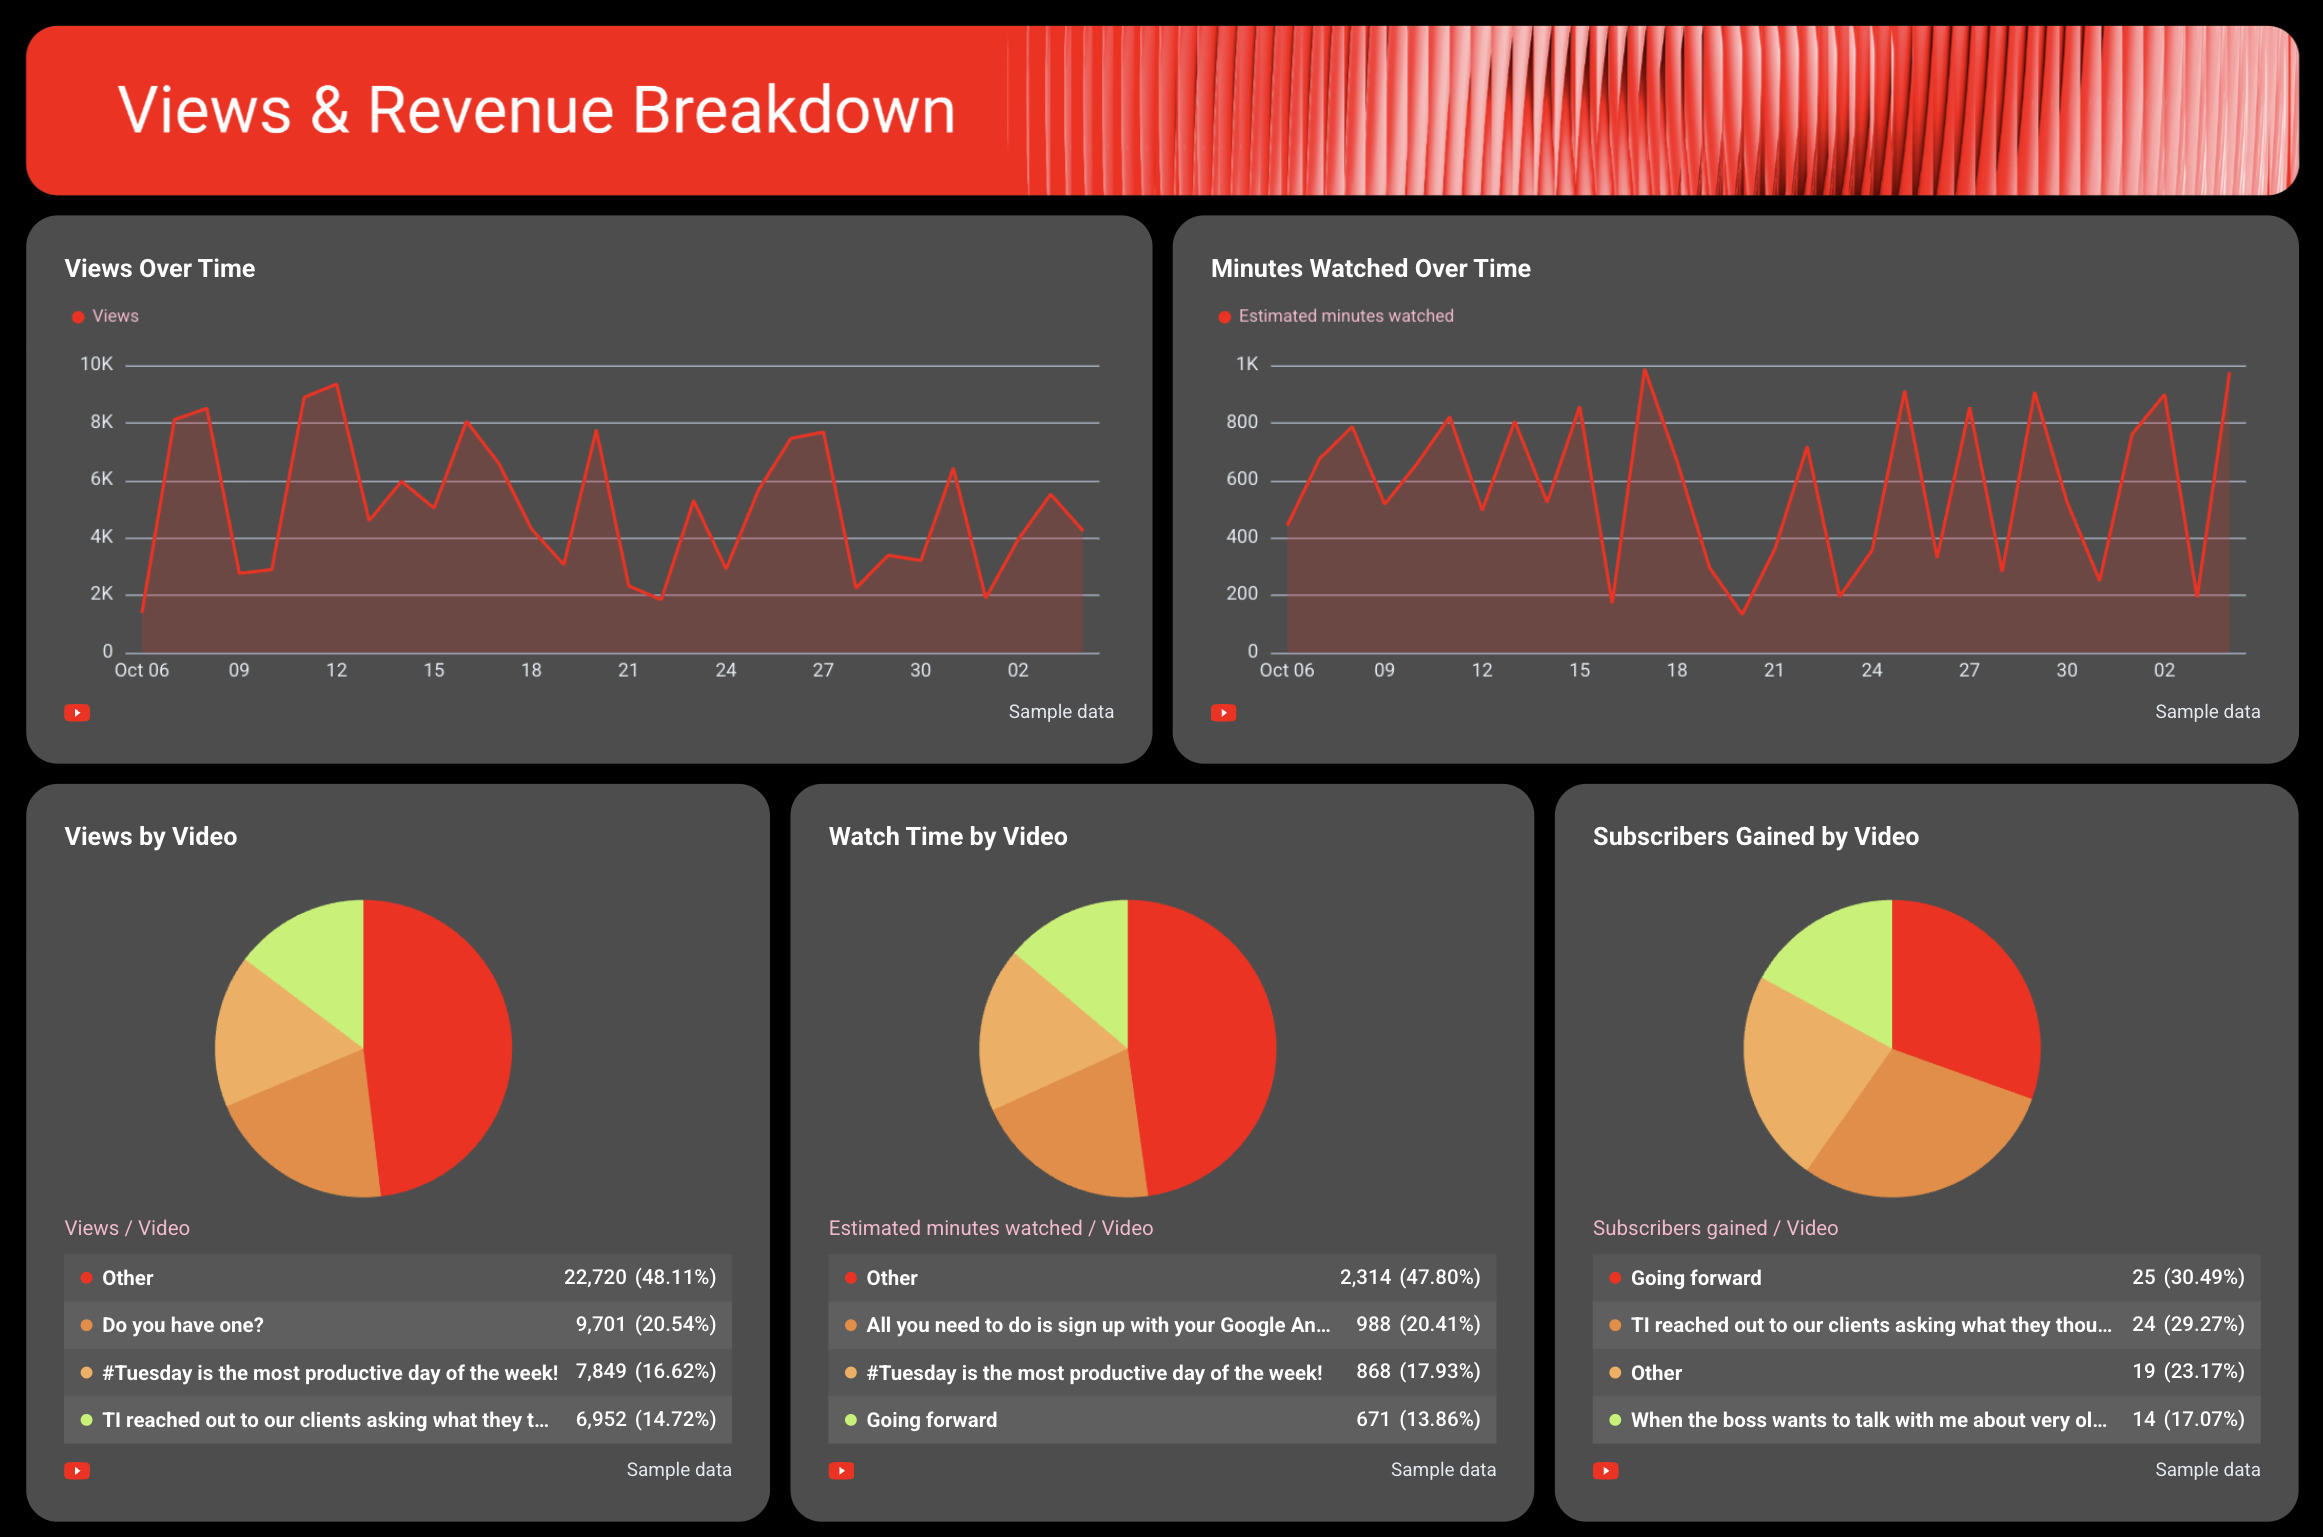
2. Views & Revenue Breakdown
The next section of your YouTube report should focus on view and revenue trends.
Include:
- Views over time and minutes watched over time to see audience engagement and retention patterns.
- Breakdown of views, watch time, and subscribers gained by video to compare how each upload performs.
- A Subscribers Gained vs. Lost trend chart to track subscriber growth.
- Video Views vs. Average View Duration Percentage, Likes vs. Dislikes Over Time, and Views vs. Estimated Revenue Over Time graphs to visualize engagement and monetization trends.
These visualizations make your YouTube analytics clear and actionable, helping you connect performance metrics to actual growth and ROI.
3. Video Performance Breakdown
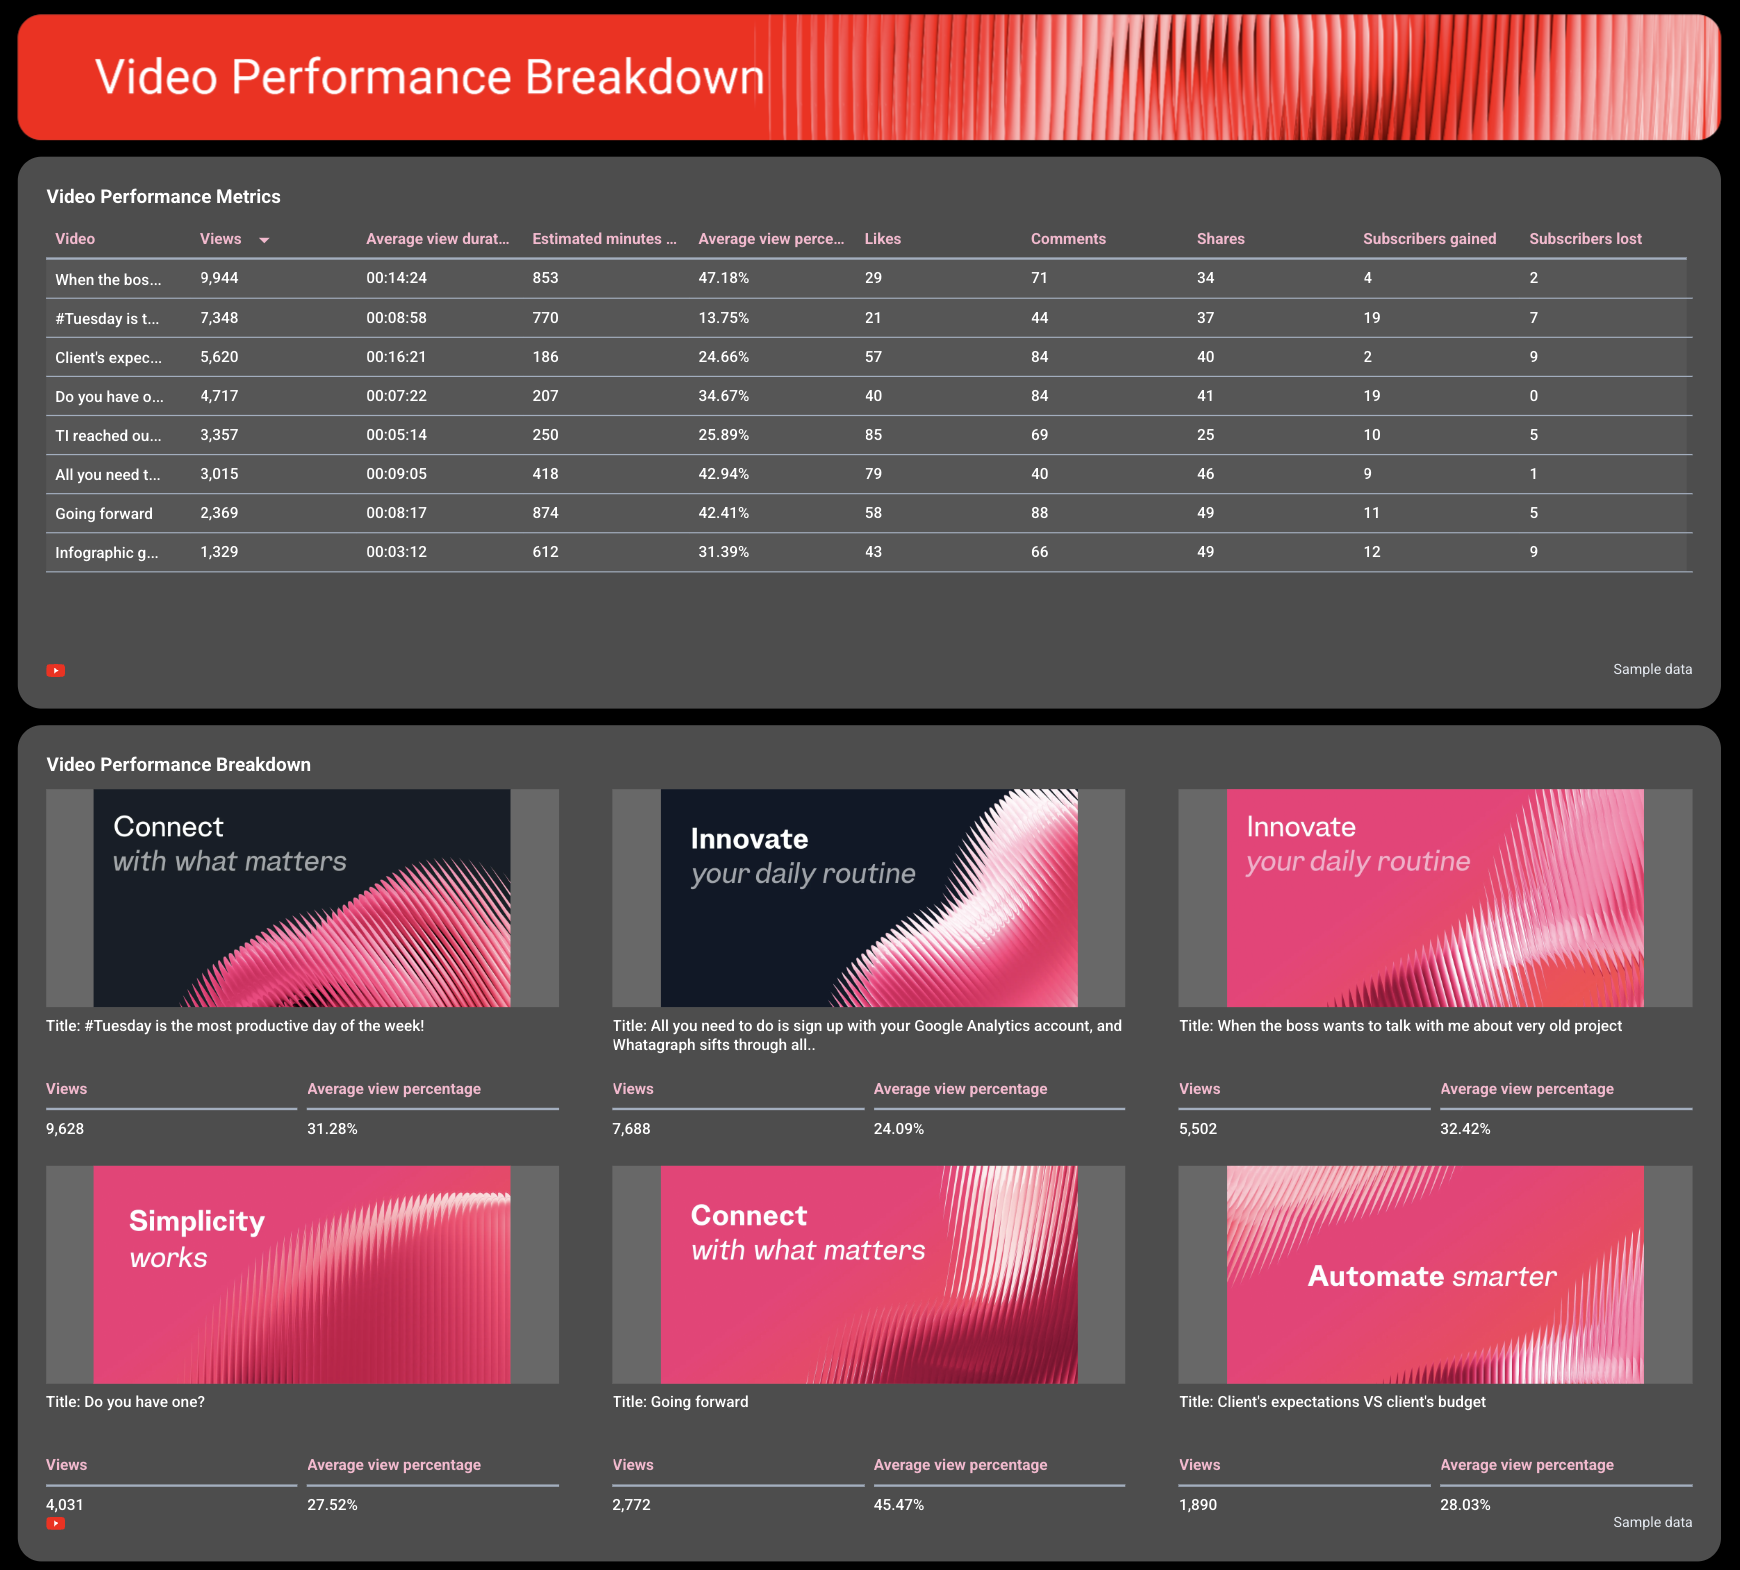
Our Video Performance Breakdown is the heart of the YouTube channel analytics report template.
Include a comprehensive table showing all your YouTube videos and key metrics for each:
- Number of views
- Average view duration
- Estimated minutes watched
- Average view percentage
- Likes, comments, and shares
- Subscribers gained and lost
Pair this with a carousel chart that displays video thumbnails and key data — like total views and average view percentage. This helps quickly identify which videos drive the strongest engagement metrics, improve audience retention, and contribute to higher conversion rates.
These help pinpoint which types of video content resonate most with your audience and which need optimization, and helps shape your future content strategy.
Maryna Barysheva, CEO of LKI Consulting, explains why tracking creative performance is important:
Creative performance is often the biggest driver of results, but most reports focus heavily on campaign-level metrics instead of analyzing which messaging or creatives are actually working.
4. Engagement Breakdown
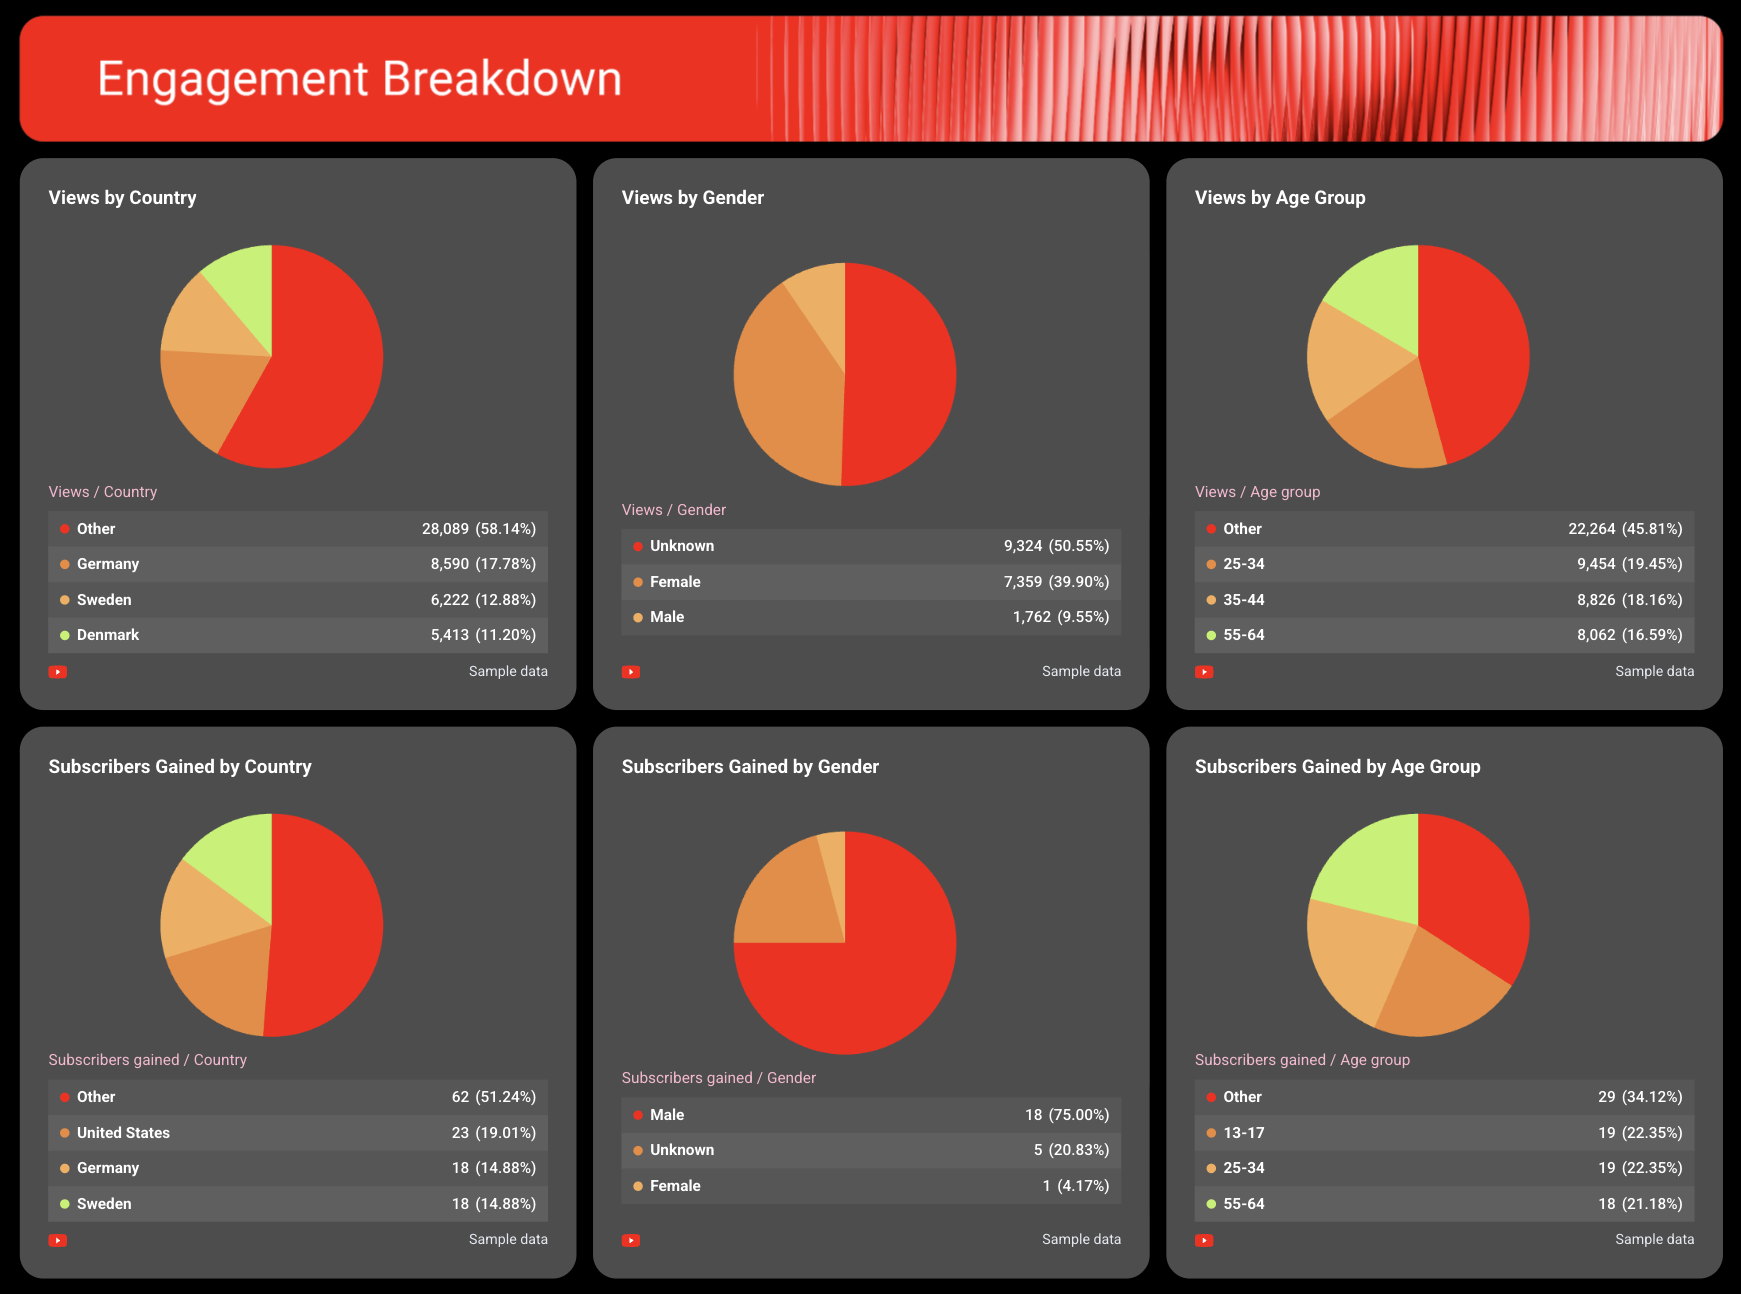
The Engagement Breakdown section of your YouTube channel analytics report visualizes your channel demographics
Use pie charts to display:
- Views by country, gender, and age group
- Subscribers gained by country, gender, and age group
This data reveals who’s engaging with your channel and where your content resonates most. Combined with other social media insights, these demographics help refine your targeting, optimize content distribution, and improve overall content performance across marketing channels.
5. Recommendations
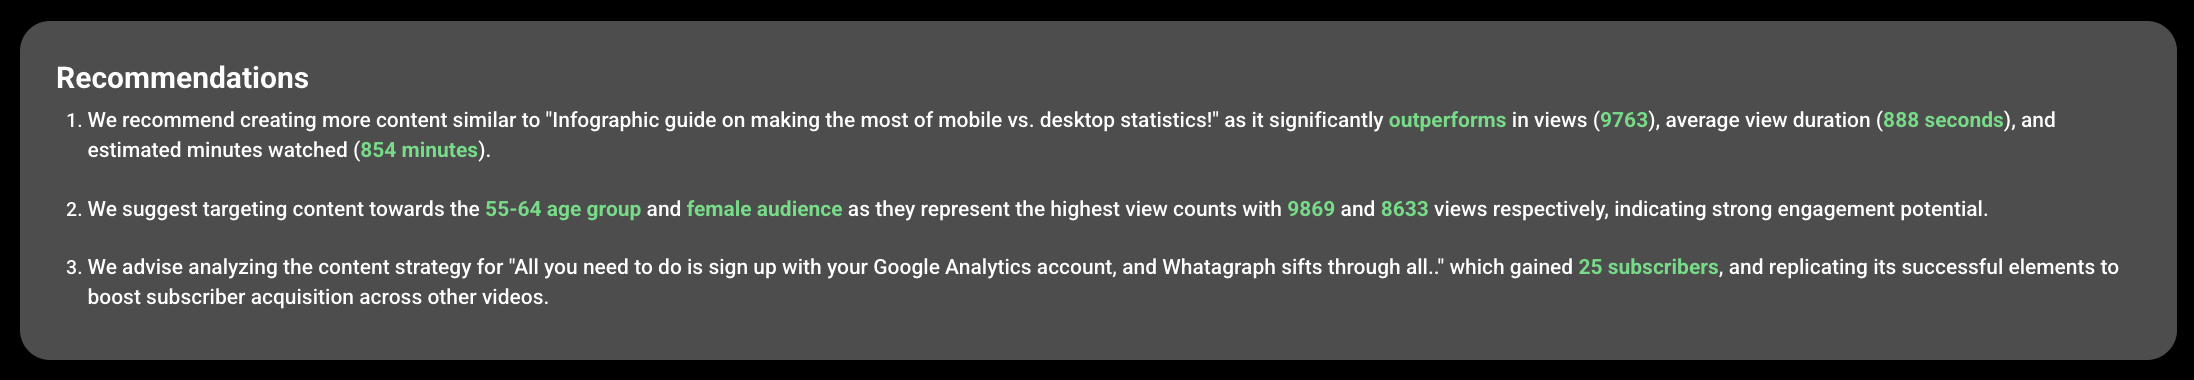
End your YouTube report with recommendations and next steps.
Without this section, even a well-structured YouTube analytics report leaves people staring at charts without direction.
If your report doesn't include 'what we're doing next', it's incomplete. - Alexander Mitrofanov, Senior Paid Media Specialist at Tag Worldwide
With Whatagraph IQ, you don’t need to write this manually. IQ analyzes your connected YouTube account data and generates instant insights for a specific reporting period.
You can choose from five content types — Summary, Wins, Issues, Recommendations, or a Custom prompt — in 18 different languages.
Whatagraph IQ doesn’t “hallucinate” because it’s based on your actual YouTube data. Also, your marketing data stays safe and sound in one platform rather than being sent to external tools like ChatGPT.
You can also fully edit the text after to make sure it’s on-brand and accurate.


