How to Build an Automated Client Reporting Machine for Your Agency in 4 Easy Steps

Nov 14 2022●10 min read

- What Is Automated Reporting for Clients?
- The 5 Benefits of Automated Client Reporting
- Automated Reporting Saves Time
- Saves Money
- More Data Accuracy
- Easier to Scale
- The Option to Charge Extra Money for Reports
- 4 Steps to Get Started With Automated Client Reporting,
- 1. Choose Your Client’s KPIs
- 2. Create a Report in Your Favorite Reporting Tool
- 3. Set a Reporting Schedule That Works for Your Clients
- 4. Use the White Label Option for a Fully Branded Agency Experience
- Wrapping Up
Have you already perfected your marketing reports for clients and looking for ways to improve them even more? Look no further, we can help you out. While focusing on your work should always be a top priority, your reports can be massively better by doing one thing only - automating them.
What Is Automated Reporting for Clients?
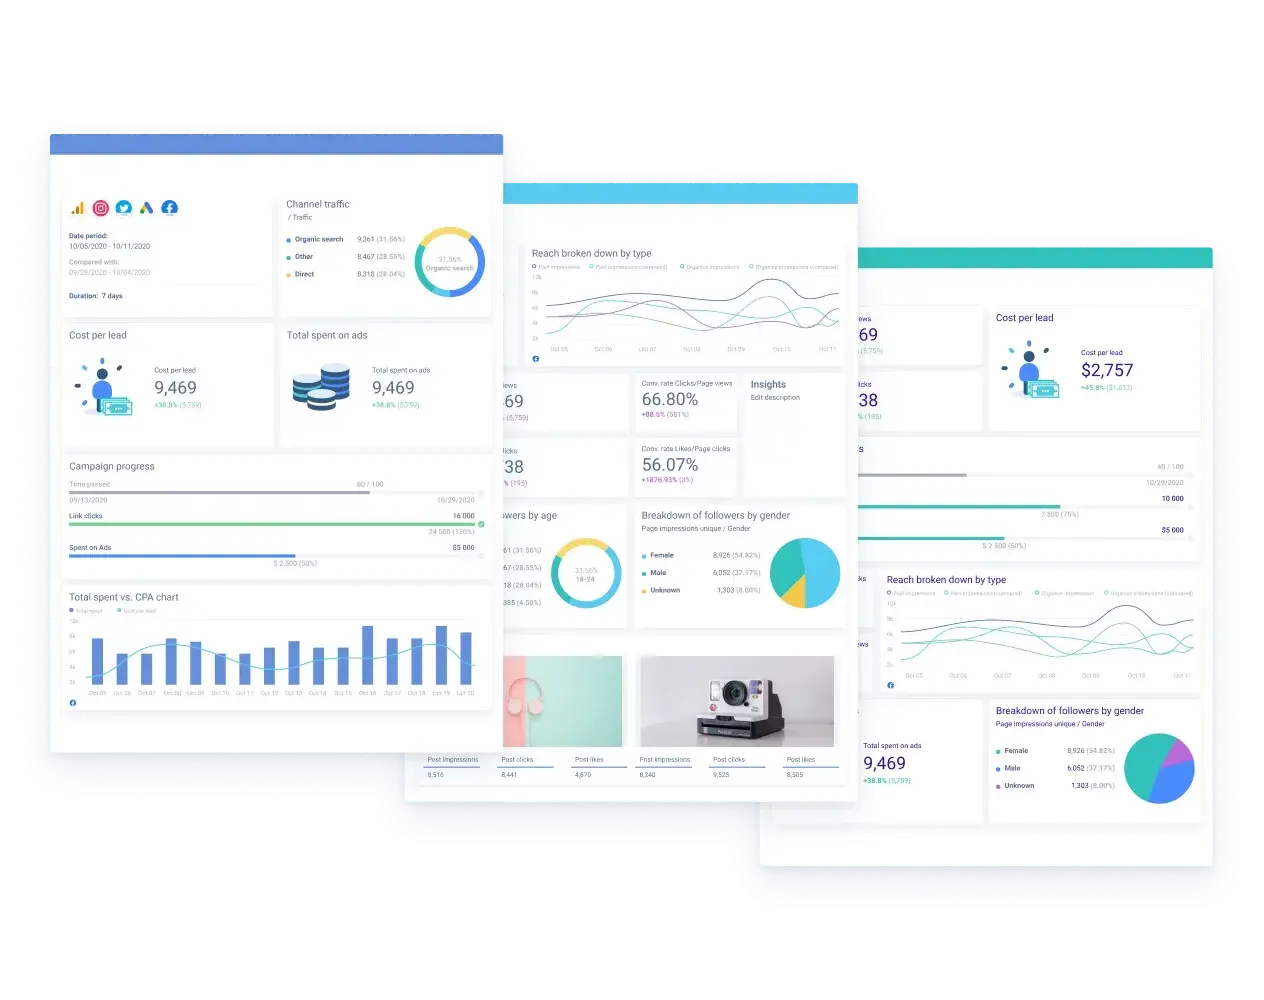
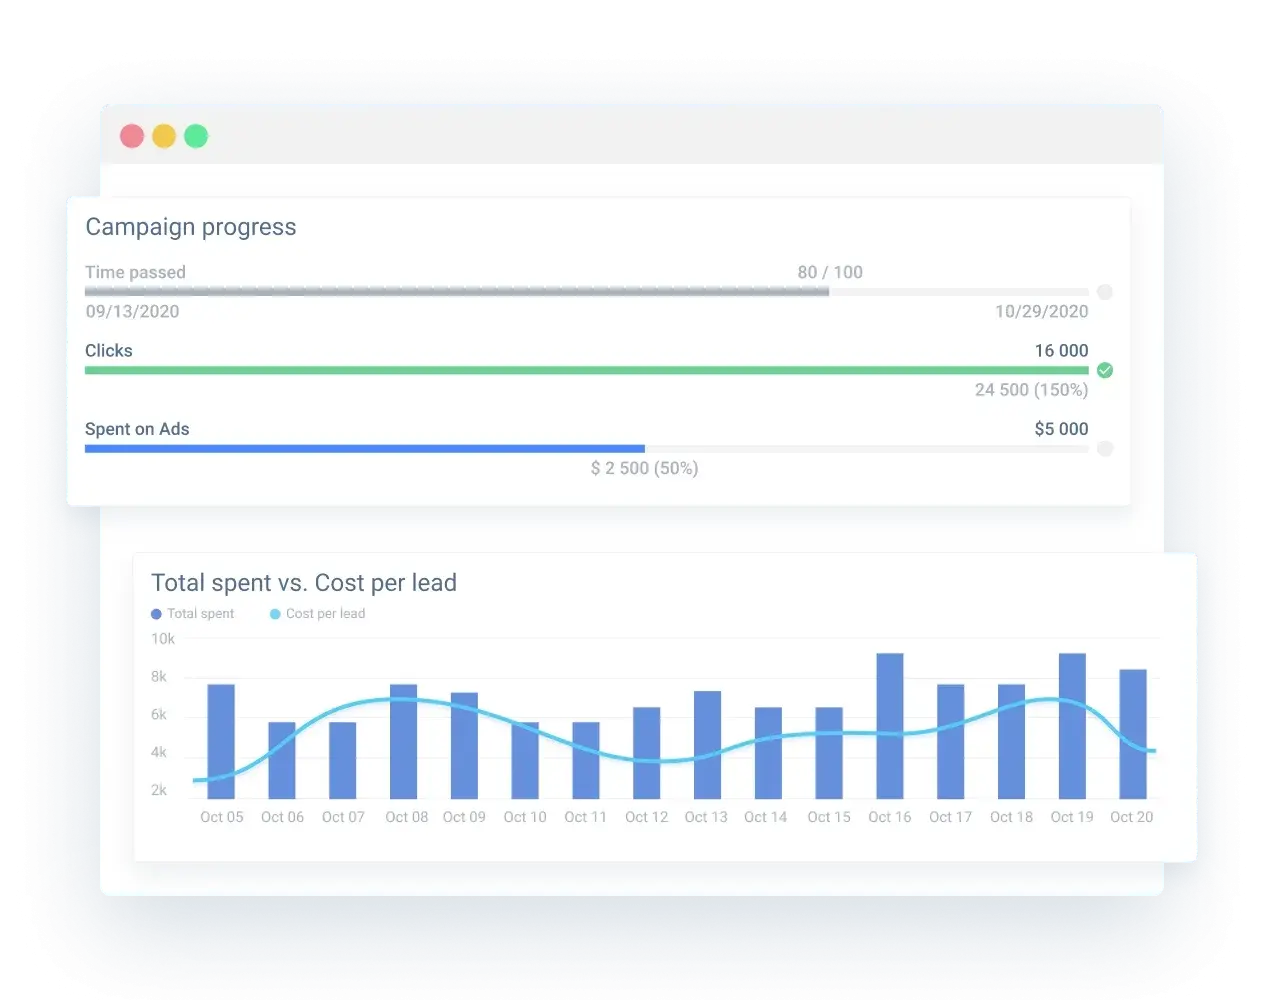
Automated reporting for clients reduces the complex and manual task of copying data from multiple platforms to create marketing reports. An automated reporting process pulls your data into one dashboard, which makes creating reports for many clients faster and easier.
The 5 Benefits of Automated Client Reporting
Creating client reports is an activity that takes quite a bit of time for marketing agencies. They try to make it visually appealing, easy to read, and simple but insightful. Even though agencies should focus their efforts on client reporting, you should still try and find a way to cut down the time spent on reports.
As an agency, you should focus more on growing business, building better data-driven strategies, and working on your client-company relationship.
This is where automated client reporting steps in. It plays a huge role in digital marketing agencies’ work and brings in a couple of valuable benefits.

Automated Reporting Saves Time
Obviously, we had to mention how much time automated client reporting saves.
It’s clear and unquestionable that people are quite slower than today’s technologies.
For example, MarketSolutions, a Swedish marketing agency, serves 150+ clients with a team of only 15 people and saves 30-70% of its time on reporting by using automated client reporting. Moreover, UpTick Marketing - a digital marketing agency from Alabama, were able to reduce their monthly report-building workload from 60 hours to around 20 hours.
As you can see, manual reporting necessitates considerable effort and time to create and send reports. But with automated reporting software, all the agencies mentioned can now forget about manually pulling data and creating tables and graphs in Excel.
Instead, both agencies can now dedicate more time to data analysis.
To the agency, this means better and more optimized marketing strategies. Furthermore, rather than losing time on data reporting, invest it in developing client relationships with your clients. Increase your time spent communicating with clients to get even more valuable feedback that will help you improve your proposal and positioning.
To your clients, this means better results, more revenue, and sales.
Saves Money
I know what you’re thinking. How could you possibly save money by purchasing yet another tool?
The problem is that from a short-term standpoint, it may appear to be a bad investment. However, it is a long-term investment that will save you money over time.
A tool such as Whatagraph can save you hours every week on creating reports and it practically pays itself off.
More Data Accuracy
Human-made errors, inconsistencies, and lack of depth and accuracy. These are the things that manual reporting manifests and is vulnerable to.
Not ideal, right?
Instead, allow the technologies to create and send reports that are presentation-ready.

No matter if you need real-time or historical data reports, automation tools automatically pull, aggregate, and send visual reports without a single human touch. And they’ll do it with utmost precision.
Although it is obvious that having accurate data is critical, it is also important to mention your agency's image.
And while your clients may not notice that your reports are flawless and error-free, we can assure you that they will notice mistakes. Which, if they keep reoccurring, can and will damage your image, reputation, and credibility.
Easier to Scale
We mentioned that you can save time with automated reporting. Well, there is an additional benefit - more time to focus on acquiring new clients.
No matter what stage your marketing agency is in or how many clients you currently have, there will always come a time when the business must grow.
Consider using automation services before you have to deal with the disaster of not being able to approach client reporting for more clients properly. Work on your workflow now to avoid existing and future clients not receiving reports or receiving inaccurate reports.
The Option to Charge Extra Money for Reports
Now, this option is mainly for the agencies that decide to use Whatagraph as not all reporting tools in the market have white-labeling, customization and automation features in one platform.
Because Whatagraph allows marketing agencies to create a new source of revenue.
Here is a recipe for you:
- Make Whatagraph disappear. The white-label feature allows removing everything related to our company’s branding. That is - logos, colours, domains, report themes, headings, etc.
- Include some personalization. The customization feature allows the creation of new widgets, new formulas for them, and actionable summary notes to explain your client's different metrics and patterns.
- Send the report your client’s way. The automation feature allows us to build a report, and set it to be sent out on required days, on needed frequencies, to multiple recipients. Do this once and forget it.
This process will take you an hour, maybe two, depending on how heavy you go with creating widgets, new formulas, etc. But the key thing here is that you don’t need to repeat the process whenever you want to send a monthly report. Pair this with an AI appointment setter to auto-schedule debrief calls with stakeholders whenever a report goes out.
The last thing to mention here is that our recipe opens ups the opportunity for you to sell this report.
Demonstrate the value you deliver to your client by providing simple, direct, and clear data as well as high-level insights.
“We see our customers as invited guests to a party, and we are the hosts. It’s our job daily to make every important aspect of the customer experience a little bit better.” –Jeff Bezos.
You can earn extra money by charging an hourly rate or charging a fee per report. Talk to your customers and inform them of your fees.
4 Steps to Get Started With Automated Client Reporting,
So, you feel compelled to begin automating client reporting right away but don't know where to begin? Or maybe you do, but you just want a checklist of things to make sure you're ready to go. Here are four simple procedures to go over again:
1. Choose Your Client’s KPIs
You can’t build a report without having key performance indicators that measure your success and progress.
It’s advised not to choose them yourself; rather, consider your client’s objectives and advice them on the KPIs they should be paying attention to.
There are many digital marketing KPIs to consider, but depending on short and long-term goals and different marketing campaigns, you’d track KPIs accordingly.
For example, if your client wants to increase their eCommerce profits, you’d probably measure things such as:
- Average spending;
- Capital expenditure;
- Customer satisfaction;
- Revenue;
- Profit.
Or maybe they want to improve their social media presence. Then the right KPIs would be:
- Return on ad spend;
- Page views;
- Impressions;
- Likes;
- Engagement.
Once you determine those goals and KPIs, you get the green light to create a report.
2. Create a Report in Your Favorite Reporting Tool
There are many great reporting tools available in the market. Here are a few of them:
Whatagraph
We would love for you to use Whatagraph, but we understand that one product cannot be a solution for all businesses. But please, allow us to promote ourselves a little bit; we have what it takes to be one of the best marketing agency solutions.
As you may know, Whatagraph allows you to automate, white-label, and customize reports.
However, you can also gain access to 40+ integrations (such as PPC tools like Google Analytics, or automated SEO tools like SEMRush), and 95+ ready-to-use templates, which will save you even more time.
We also care about our customers, which is why we offer personalized onboarding and a dedicated account manager. Why? To simply be there for you. We are eager to share our knowledge with our customers, whether they want to create the best-tailored report for their clients or learn the best reporting practices.
OK, that’s enough about us.
Megalytic
Some agencies use Megalytic - a reporting tool that white-labels and automates your reports.
Long story short, this tool has similar features to Whatagraph:
- Real-time data;
- Custom metrics creation;
- Automated reporting process;
- White-labeling;
- Data visualization;
- Custom reports.
Just keep in mind that only more expensive Premium and Enterprise plans allow client reporting and that they limit how many reports you can create.
NinjaCat
Lastly, let’s mention NinjaCat. This tool creates cross-channel reports and integrates with more than 150 data sources and marketing channels. However, on the other hand, it also offers PowerPoint style report building that is slow, complex and has no auto-save, which could be a big disadvantage compared to Whatagraph.
It also has features such as:
- White-labeling feature;
- Automated reporting templates;
- Dedicated account manager;
- Report and dashboard automation.
3. Set a Reporting Schedule That Works for Your Clients
Once you've decided on a reporting tool and created the report you want to send to your clients, it's time to automate the process.
Depending on what the client requires and what you as an agency see fit, it is possible to set a reporting schedule on daily, weekly, bi-weekly, monthly, bi-monthly, quarterly, and yearly frequencies.
We're not sure about other reporting tools, but one advantage of Whatagraph is that the reports are interactive regardless of frequency. This means that your clients will be able to change the reporting time and look around.
4. Use the White Label Option for a Fully Branded Agency Experience
The last step is to white-label your dashboards and reports.
White-label reporting is now a significant component of a company's branding practices. Mainly for the recall factor.
The more often your client sees your agency’s branding elements, the better they’ll recall your company and the more they’ll trust your brand.
Adding your agency's branding elements to automated client reports is simple in Whatagraph and allows you to instantly improve your professionalism.
Wrapping Up
Client reporting is a critical component of establishing and growing a successful agency. However, manually creating reports can frequently be a time-consuming and inefficient bottleneck. But you can easily scale your agency with automated client reporting.
All you have to do is start reporting with Whatagraph and amaze your clients with the most beautiful, easy-to-understand, interactive live reports.

WRITTEN BY
Dominyka VaičiūnaitėDominyka is a copywriter at Whatagraph with a background in product marketing and customer success. Her degree in Mass Communications/Media Studies helps her to use simple words to explain complex ideas. In addition to adding value to our landing pages, you can find her name behind numerous product releases, in-app notifications, and guides in our help center.