How to Use the Behavior Flow Chart in Google Analytics
It does not matter whether the business is operating in the eCommerce or B2B landscape. It’s well-established or just starting to pick up first customers. The success of the business relies on the actions of users. Google Analytics provides the Behavior Flow feature to understand better how users interact with the company’s website and what influences them to make a purchase decision.

Aug 09 2021●7 min read


Tracking and analyzing the user’s behavior can pinpoint the parts of the website, who are calling for improvement. If the user finds the business’s website with the help of PPC (pay-per-click) advertising, enters the home page, browses through the product page and opts out, there is a big chance that the product page is simply not good enough to sell.
Google provides a handful of metrics and tools for marketers to use. One of the key indicators of the website’s performance is “Behavior Flow”.
Behavior Flow fundamentals
Behavior Flow is an analytic tool under the umbrella of Google Analytics. If the business has installed Google Analytics script into the website, the marketer can log into the Analytics account and head to the left-hand column under the “Behavior” tab. A “Behavior Flow” tab in the expanded section showcases all the valuable information.
Google Analytics’ behavior flow visualizes the path a user travels in the business’s website. A behavior flow graph can consist of many pages or just a single page view during the user’s session. In the beginning, the whole behavior flow monitoring may seem complicated and hard to understand. However, once mastered, it can help to spot the critical website’s performance errors.
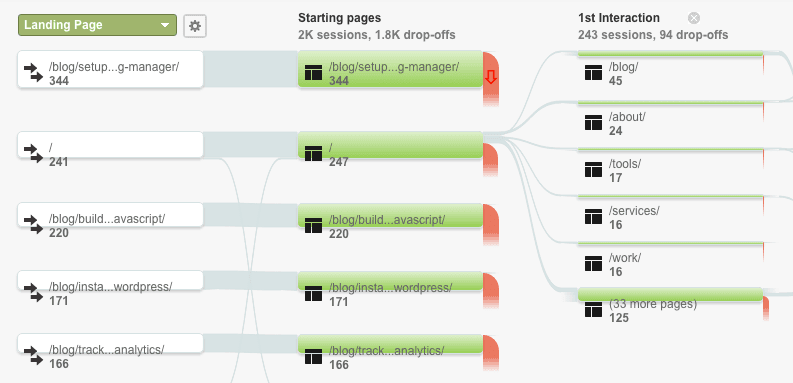
The green boxes represent pages the user opened. The gray lines between the boxes are connections, demonstrating how users flow from one page to another. The red lines flowing away from the green pages are bounces — the people who left the site at some point. Each page is grouped into columns based on what stage of the process a user’s process, with a user’s point of entry on the left and a progression moving toward the right side.
 Source: MarketLytics
Behavior Flow Stages
The Behavior Flow is showcasing multiple user’s activities throughout the session. There are four main click paths, which are displayed in the chart:
- The Entry Point, which Google calls the “Starting Page”, is the first page the users visit when entering the website. Depending on the user’s acquisitions, this could be a home page, blog page, or a specific landing page exposed to users using advertising. Understanding the entry point can help marketers determine how and why users continue with the site.
For example, if the primary page is the home page and many users bounce off, while the second one is blog and users continue browsing, marketers can conclude that the home page doesn’t do a good job convincing users. Comparing starting pages should give a clear idea of which pages effectively draw users further into the site.
- The First Engagement or “Interaction”, as Google Analytics calls it, is the first page visitors hit after the Entry Point.
For example, after reading the blog post, users may continue reading other articles, or after visiting the home page, they may check the contact page.
This first interaction should closely align with the business’s goals. Suppose the company is looking to sell products with the shortest purchase journey. In that case, the most popular first interaction should be an online store or registration page, so people have an immediate opportunity to convert. If they’re going somewhere else, the business needs to make adjustments to redirect potential customers properly. Similarly, if the company aims to increase brand awareness, visitors should head to a blog, testimonials, or the case study page.
- The Second Engagement (and beyond). If the first engagement doesn’t get potential customers where you want them to go, the second should pick them up.
For example, 80% of website visitors head to the business’s goal destination on the first engagement. In that case, the majority of the remaining 20% should lead to the initial goal on the second interaction. If they are not, the company should take a closer look at the conversion funnel.
Suppose users are getting to a third or fourth interaction without getting to the intended destination. In that case, there could be a serious problem with funneling.
- The Bounce. If an overwhelming percentage of users leave the site after visiting a specific page, that should be a red flag that there’s a problem with that page. It could be a lack of convincing information, an outrageous design flaw, or a lack of links or CTAs that draw users to continue interacting with the website. Bounce rates can be the biggest problem, but they’re also one of the easiest problems to identify and eliminate.
Insights made using Behavior Flow
Data is an ultimate source of success. Google Analytics provides marketers a handful of tools to view and analyze the data. Behavior flow monitoring and reporting allow marketers to:
- Identifying the most engaging content on the website. Various pages and content can drive users to learn more about the business’s products or services. For example, one blog article can lead to another closely related to the company’s product. If the content is written well, the bounce rate is low and the conversion rate is high.
- Spotting the problem areas and potential issues by reviewing the pages with the highest bounce rates. If the client leaves the website after reading one article, it could mean that the content was not engaging enough and needs an audit.
Behavior flow combined with other analytics can improve both the marketing campaign and the overall business performance. If Google Analytics seems too complicated, marketers can use simpler reporting tools. It allows marketers to gain data-backed insights by automatically gathering all of the marketing campaign’s data and presenting it in a visual, easy-to-understand report.
Understanding the information and gaining insights into the users’ behavior is only the first step. The businesses will need to make meaningful changes to the site to improve their conversion rates. It’s useful to look at the most successful pages with the lowest bounce rate and those leading the most users to the initial goal.
Bottom line
It’s impossible to know what the website’s visitors are really thinking. Still, the Behavior Flow can help get a better picture of how visitors interact with the website and convert them into valuable customers. The data provided by Google Analytics can help advertisers to optimize their marketing efforts and drive ICPs at lower acquisition costs.
We recommend using the reporting tool to ease the pain of labor-intensive, time-consuming tasks like data gathering, aggregating and reporting. All of the Google Analytics, Facebook Ads and other marketing channels data is automatically collected, cleaned and presented in one visual report.
Published on Aug 09 2021
WRITTEN BY
Benediktas KazlauskasBenediktas is a detail-oriented writer with a passion for marketing and technology. Using his vast experience in Business Management and Sales, he approaches every blog with the same idea: How to make readers come back for more?