The Ultimate Guide to Facebook Ad Analytics in 2026
If your goal is to make even better marketing decisions, take a pen and paper with you because a lot of useful information will be thrown at you. This article will help you learn about Facebook ad analytics and key metrics to better understand how your Facebook ad campaigns are performing.

Jan 24 2020●10 min read


- What is Facebook Ads Analytics?
- What is Ads Manager?
- Use Ads Manager To Track Facebook Ad Campaigns
- How to Set Up Ads Manager?
- 6 Important Facebook Ads Metrics
- Facebook Ads Analytics Tools
- 7 Reasons to Report on Facebook Ad Analytics
- How to Create Facebook Analytics Dashboards?
- A Perfect Alternative to Facebook Analytics
- Bottom Line
What is Facebook Ads Analytics?
Facebook Ads analysis helps you understand the health of your Facebook Ads campaigns by monitoring key metrics such as reach, impressions, clicks, click-through rate, cost per click, conversion rate, and return on ad spend (ROAS). This data helps you understand which strategies are most effective for your campaign.
The list of Facebook Ads analytics is endless. Think about some of them:
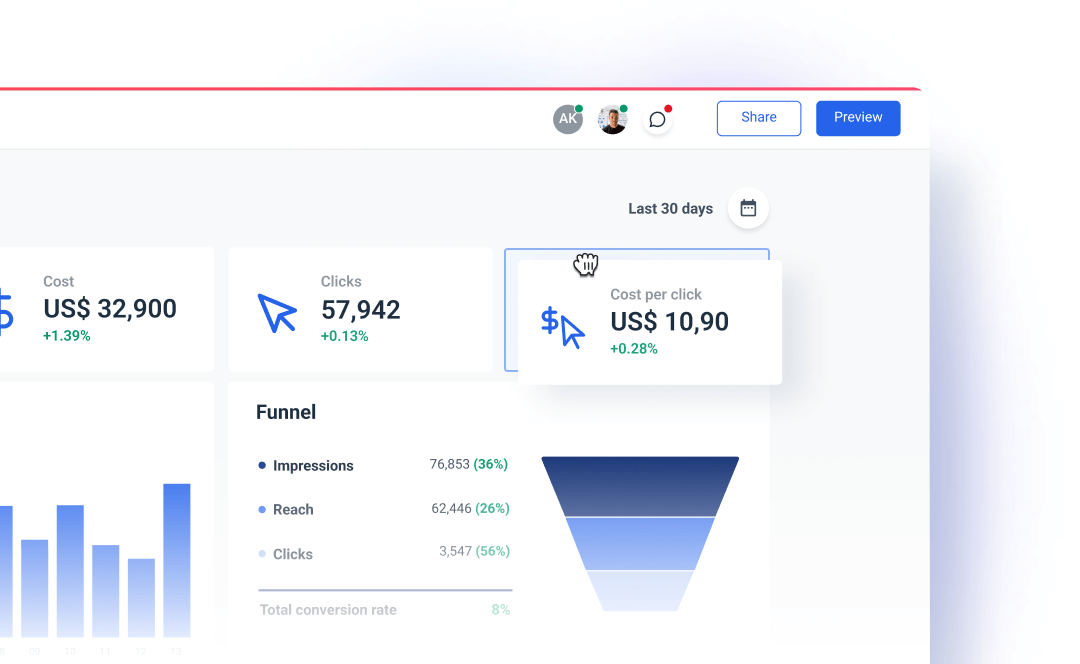
Clearly visualized sales funnel will provide valuable data into customers’ time spent in each stage. Set up a funnel on Facebook analytics and monitor the user journey from the first click to the last one (which is achieving your conversion goal). It lets you see how long it takes for conversions to appear.
Here’s how to create a funnel. Go to the left menu and click the drop-down arrow next to Activity. Select Funnels, and click on Create Funnel on the right side of the screen (the green button).
Here, you can see the checkout flow from Page Views (how users enter the funnel). After Page Views, you have Content View.
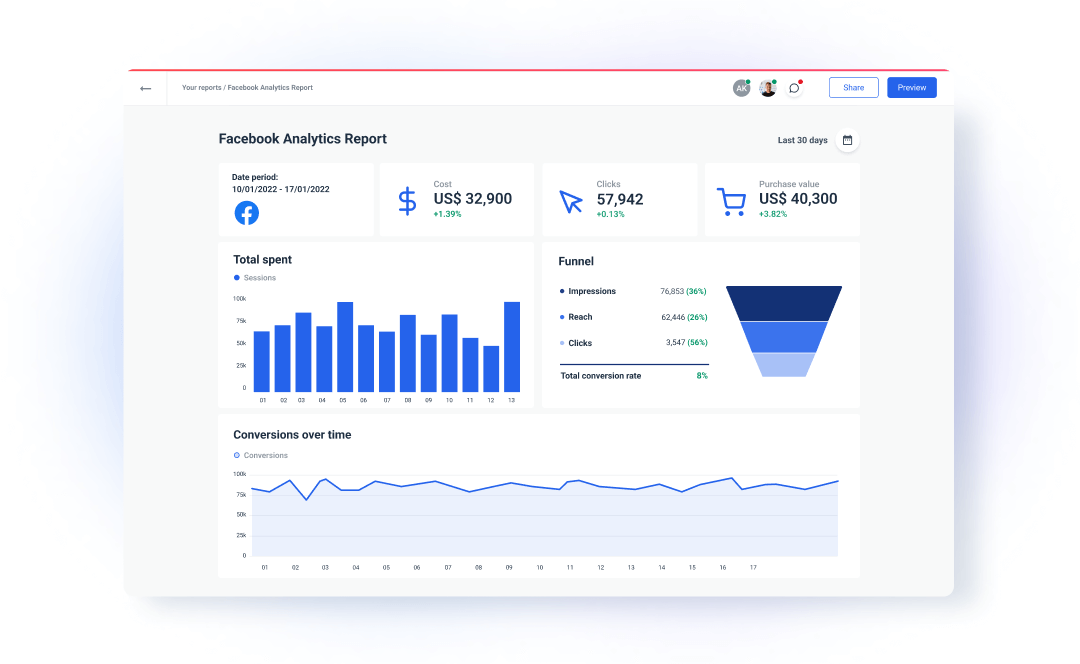
As you can see in the example above, the funnel conversion rate is 8%. You can always save a report to your dashboard by clicking the "pin" button in the top-right corner.
Increased retention can be achieved by creating retention reports and learning how long long users stay on your product and website over a specific period of time. Understanding retention will determine how many users return for your products and to your website.
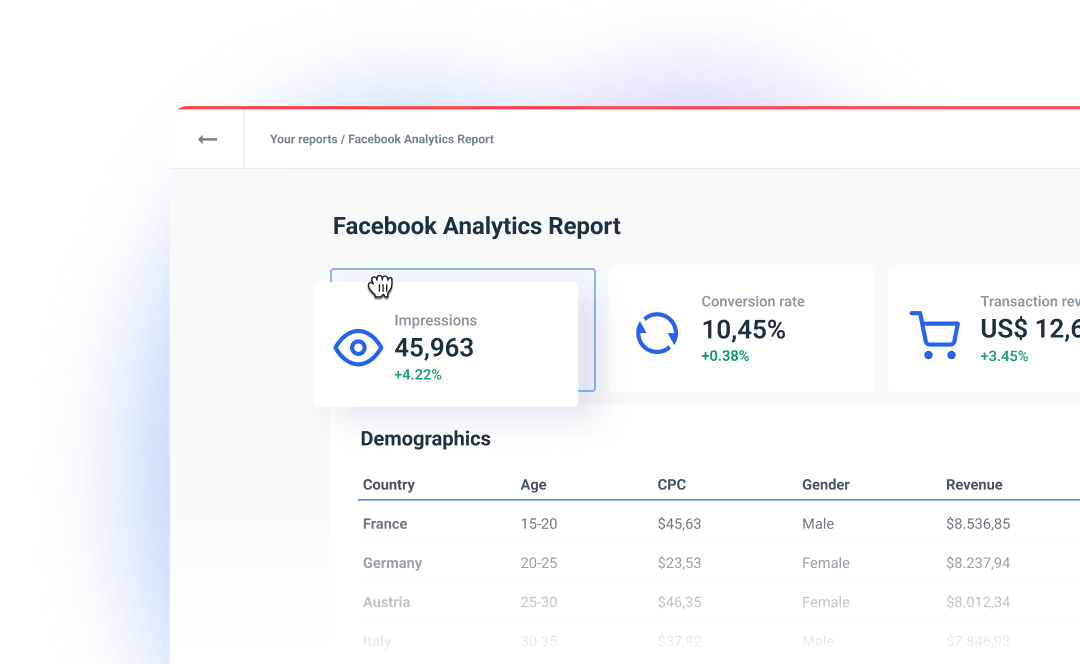
To properly understand this point here is a visual of Facebook Ad analytics.
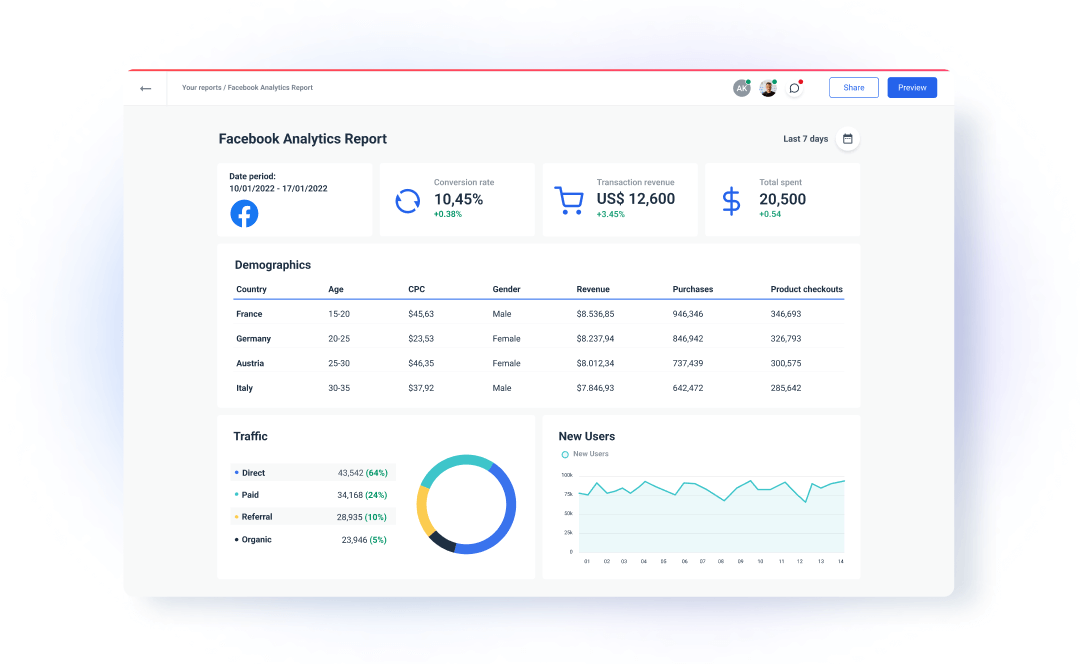
This report reveals how many people have made a purchase, as well as their age and gender. Having this information will benefit any marketer when planning future strategies and steps.
Increased revenue can be achieved by creating revenue reports. The sooner marketers learn about their total revenue, total purchases, avg. revenue per purchase, etc., the sooner they can optimize ads according to the data.
What is Ads Manager?
Ads Manager is a tool offered by Facebook that allows for 2 things: (1) Develop & manage ad campaigns and ad sets; (2) Track their performance. Key features Facebook Ads Manager have include:
- A/B testing. Allows to determine the best performing strategies and ad campaigns;
- Targeting key demographics. Ads Managers has the functionality to locate and target key audience;
- Ad placement. Choose where on Facebook page want your ads to appear (Right-Hand Column, News Feed);
- Ad placement. Choose which device is the most appropriate for your ads (Mobile, Desktop, or both).
Use Ads Manager To Track Facebook Ad Campaigns
Two convenient and useful features of Ads Manager are tracking and reporting. Ads Manager displays the changes and progress of Facebook campaigns, as well as provides lots of data needed for ad optimization. Here are 3 things you can get out of this data reporting tool:
View data by campaign, ad set or ads
It goes without saying that after you launch your ad campaign, you'll want to know how it's doing. Fortunately, Facebook Ads Manager includes a reporting tool that allows you to view data by campaign, ad set, or ads. Because this tool provides both historical and real-time data, you can learn not only about the performance of your previous campaigns but also how people are reacting to your current ones.
Create reports
It is preferable to use a 'create a report' function to view data productively. Reports will synthesize, pull, and analyze the results of your campaign in an easy-to-understand format. This data includes metrics such as:
- Cost per Lead;
- Cost per Action;
- Leads;
- Ad impressions;
- Engagement;
- Result rate.
Get actionable insights
By viewing your campaign performance reviews, you can easily get an understanding of where you are at and where you are heading. Reports provide actionable and valuable insights that can and should be used in the development of future campaigns.
How to Set Up Ads Manager?
Once you set up a Business Manager account (Go to business.facebook.com and create it in 3 steps), set up advertising access.
- Navigate to Business Manager Settings.
- Click on "Ad Accounts" under People and Assets.
- Click "Create a New Ad Account" after selecting "Add New Ad Accounts."
- After you've entered your payment method and billing information, you'll be able to access Ads Manager.
You've now created the foundation layer upon which you'll build actual ad campaigns. Now all you have to consider and choose are your:
- Objectives;
- Target audience;
- Budget;
- Ad placement.
After you've completed these steps, you're ready to create your first ad (or ad campaign). Place your order, wait for it to be approved, and then begin monitoring ad performance as soon as your ads go live. The question is, what should be monitored? Let's take a look at the most important key metrics to keep an eye on.
6 Important Facebook Ads Metrics
Cost per Click (CPC) - It is a digital marketing revenue technique in which advertisers charge marketers based on the number of clicks their advertisements receive. By tracking this metric marketers will be able to identify the right keywords for their campaign and learn what can be achieved with their budget. The goal of CPC is to constantly optimize ad campaigns so that the click-through rate increases while the money spent on those clicks decreases.
Reach - This metric indicates how many people have seen your ad. This does not imply that they clicked, liked, or otherwise interacted with your ad. Reach is basically a number measuring unique ad views.
Reach metric is important for social media campaigns as by tracking it a better understanding of the effectiveness of your ad. If the reach is low (average benchmark is considered to be 40%) reconsider your: copy, frequency, design, and target audience.
Impressions - This metric counts the number of times your ad has appeared on users’ feeds.
Depending on the ad campaign's goal there are different reasons why you should be tracking this metric. One of these objectives could be to raise brand awareness. The marketer evaluates and measures ad impressions during and after the ad campaign to determine whether it is necessary to increase ad spend and frequency. Alternatively, a marketer may choose not to monitor this metric. However, there is a risk of not meeting the target and overspending on advertising.
Click-Through Rate (CTR) - This metric compares the number of link clicks to the total number of people who saw your ad. By tracking this number marketers get insights into the effectiveness of their ad. This includes the appropriateness of keywords, Facebook user behavior (what they choose to click on and what they scroll through), and the copy's success.
The ad's Facebook analytics involve 2 CTR columns. The very first column, CTR (All), demonstrates all ad clicks. The second column, CTR (Links), displays the links that were clicked within the ad. You now have a better understanding of how effective your ads are at generating clicks.
Conversion Rate - This metric measures desirable actions taken by Facebook users. A conversion occurs when a user interacts with your ad and then, for example, clicks a link or purchases your product. Marketers are interested in the rate at which this process occurs. The conversion rate answers the question of how frequently we need to display ads in order to persuade a user to take that 'desirable action.'
Return on Ad Spend (ROAS) - This metric showcases the total profits made by your Facebook ads divided by the total amount spent on ads. ROAS is critical to monitor in order to determine whether your marketing campaign and eCommerce business are generating revenue. There is a risk of losing money if this metric is not monitored.
Facebook Ads Analytics Tools
When it comes to Facebook ads analytics tools, Facebook provides 3 tools that can help with metrics and KPIs tracking.
1. Ads Manager.
We covered it already but to sum up, this tool lets you create and manage all your ad campaigns, ad sets, and ads.
2. Facebook Business Suite.
This platform is where you’ve got to manage your Facebook business account and learn about your audience.
3. Events Manager.
This tool is a little helper when it comes to setting up and managing Conversions API and Facebook pixel. If needed, it can alert when certain actions are taken on your site or app.
7 Reasons to Report on Facebook Ad Analytics
Facebook created this platform to help you understand your audience and every step your customers take on your website to achieve a conversion goal, such as a download, lead, or purchase. The tool allows for the segmentation of traffic, the examination of revenue drivers, the examination of conversion funnels, and the collection of other valuable data. The best part is that it is completely free.
Facebook understands that it is the first place many businesses introduce their brand or service to new customers, whether through paid ads or organically. That is why Facebook Analytics was created – to keep things that way. Both marketers and users will benefit from the free tool.
The data Facebook Analytics provides can assist marketers in tracking the effectiveness of their ad campaigns, allowing them to make better decisions in the future. Using the data given by Facebook Analytics, you can create ads and ad campaigns with specific goals in mind, thus increasing your ROI.
The strongest reasons why you should use Facebook Analytics are:
- To understand your customers' journey through your website;
- To find out how much time elapses between repeat purchases or conversion path steps;
- To better understand the behavior of cross-device conversions;
- To track social engagements in relation to the desired conversion;
- To be aware of the possibility of delayed conversions from display prospecting campaigns;
- To monitor the effectiveness of paid and organic marketing across multiple devices and sessions;
- To improve your ROI and avoid wasting ad dollars.
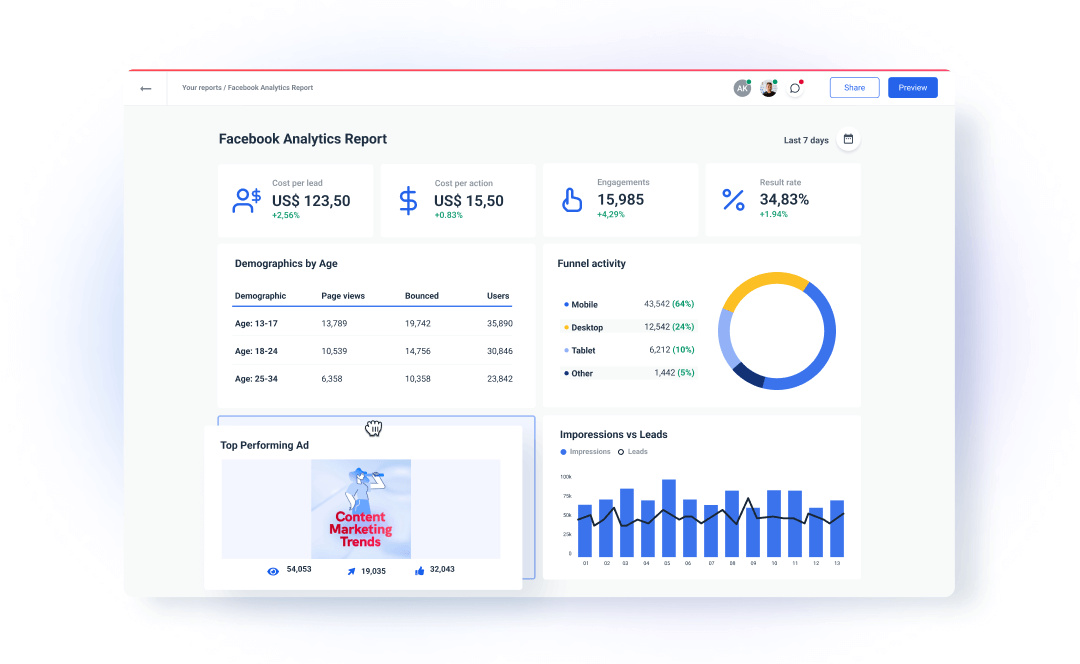
How to Create Facebook Analytics Dashboards?
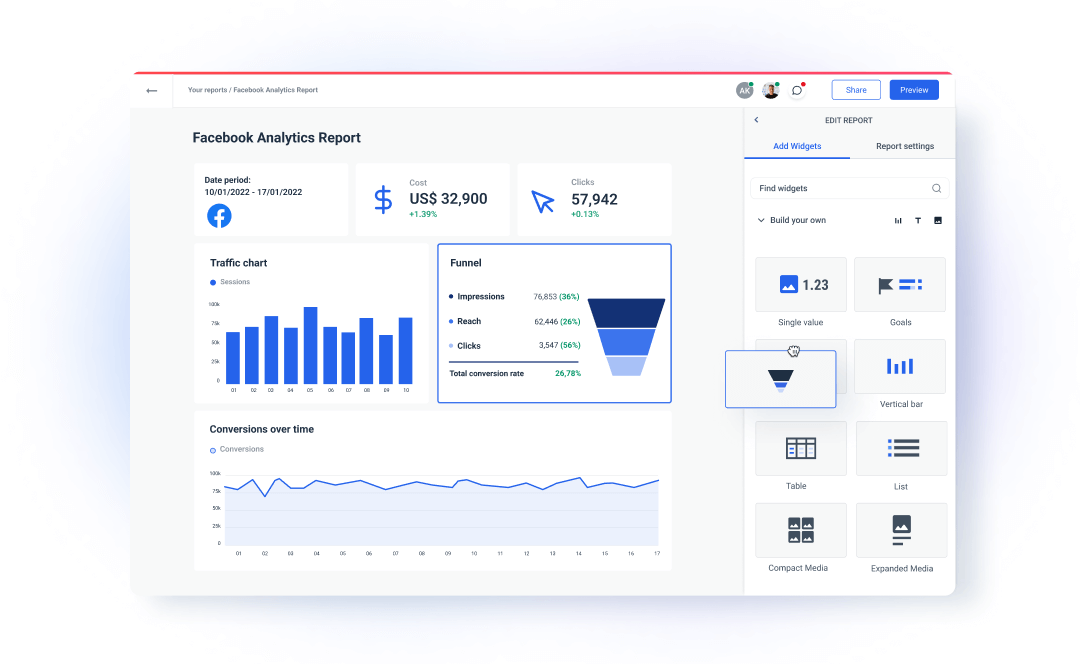
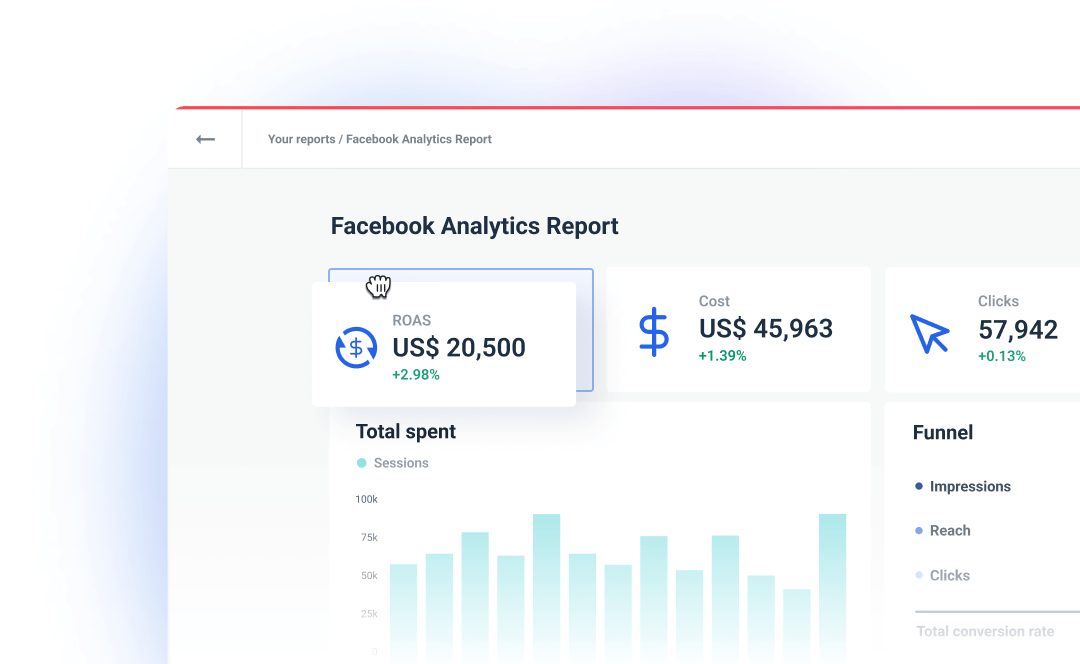
You no longer have to rely solely on native platforms for analytics and reporting. You're probably better off using a third-party platform to help you or your in-house team aggregate performance metrics. If you only use Facebook Ads and no other marketing platform, the native analytics dashboard should be adequate. However, as you begin to incorporate additional tools into the mix or work with a larger client base, you may begin to notice some growing pains associated with the native platform.
Using third-party dashboard tools to track Facebook Ad campaign performance saves time and provides a lot of flexibility. You can create your own dashboard that only displays important data points and does not overburden you or your client with vanity metrics.
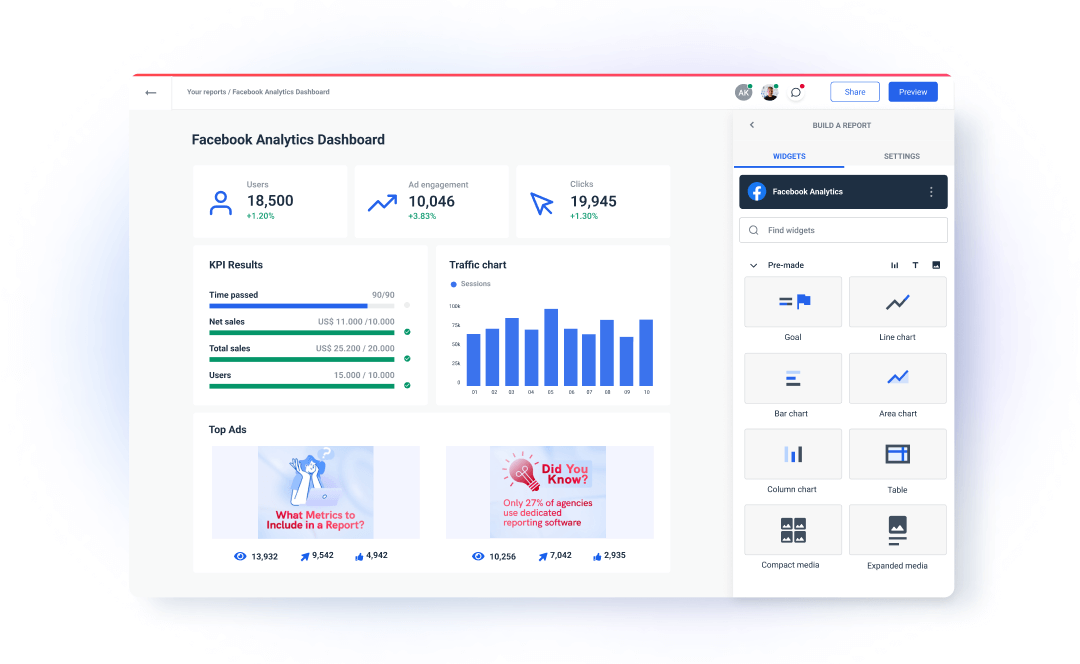
In the example above, you can clearly see how a dashboard tool outperforms native Facebook Ads analytics. It's simple to use and understand, regardless of your level of data literacy.
A good dashboard tool will also allow you to view the performance of individual ad campaigns and compare it to previous reporting periods. Switching between client dashboards is also extremely simple, and you can compare one platform and its ad metrics to another - all in one place.
You can choose to use our pre-built Facebook Ad dashboard to help you aggregate critical performance metrics in one place. Ad set metrics and budgets can be tracked in one place and in real-time.
A Perfect Alternative to Facebook Analytics
While Facebook offers 3 data analytics tools, they aren’t ideal for marketing agencies and PPC specialists. They lack flexibility, you cannot compare the performance of other paid channels to that of Facebook, and there is no automation feature. So, if you're looking for these characteristics, look no further. We have everything you require.
Whatagraph’s automation feature is one of those features already appreciated by marketers. It is super simple to implement and saves hours of manual labor. This automation feature enables you to schedule and send reports directly to your or team members' inboxes. Any time period and frequency can be covered simply by checking a few boxes on the platform.
Another useful feature is cross-platform reporting. This feature is a lifesaver when comparing Facebook's performance to that of other social media platforms (or when looking at your overall digital marketing performance). Whatagraph has over 40 of the most popular integrations. This means that this data analytics solution may be the only one you ever require.
As for flexibility, Whatagraph has it too. You can customize any dashboard or a report:
- Change colors, fonts, and themes;
- Upload images;
- Use a drag and drop feature to place widgets where needed.
Bottom Line
Facebook Ad Analytics can seem overwhelming. Not to mention the whole reporting process. However, we want to reassure you that if you follow this guide, you will have everything under control and nothing will be overlooked. If you have any questions or would like to speak with a marketing professional, please contact us. We want to assist you in leading your business to success and making data-driven decisions.
Published on Jan 24 2020
WRITTEN BY
Dominyka VaičiūnaitėDominyka is a copywriter at Whatagraph with a background in product marketing and customer success. Her degree in Mass Communications/Media Studies helps her to use simple words to explain complex ideas. In addition to adding value to our landing pages, you can find her name behind numerous product releases, in-app notifications, and guides in our help center.