How to Build a Facebook Analytics Report + [Free Template]
The easiest (and fastest) way to create a Facebook analytics report is to use a dedicated marketing reporting tool to automate the whole process. In this article, you’ll learn how to choose the right data and reporting tool and use it to structure your reports to be the most useful for clients.

Jan 31 2025●7 min read


![How to Build a Facebook Analytics Report + [Free Template]](https://media.whatagraph.com/Facebook_Analytics_Report_5782cb584c.png?width=992)
Sure, you can always export the Facebook Analytics report from the Meta Business Suite and mail it to your clients.
But at the end of the day,
- Will they even understand those reports?
- Will they clearly see the progress you’re making?
- Or ask for clarification every time the report lands in their inbox?
And what if your client has 50 Facebook accounts you need to track and report on?
It can become overwhelming for both your team and your clients.
We asked 3 agency experts:
Peter Murphy Lewis, CEO @ Strategic Pete
Iryna Melnyk, Marketing Consultant @ Jose Angelo Studios
Kyle Morris, CEO @ LawTurbo
… these questions and compiled their insights in this article.
Plus, we'll also share two resources: a free Google Sheets template for Facebook analytics reporting and Whatagraph's Facebook report template.
Let's dig in.
How to Build Facebook Analytics Reports Your Clients Will Love
Talking to marketing agency leaders, we’ve heard many times that clients don’t pay much attention to the reports they get.
After all, they only care about results, right?
This is true, but keeping your clients engaged with reports has many benefits.
Let’s mention a few:
- Lower churn: Engaged clients are less likely to shop around for other agencies, especially if they see value in your work.
- More informed decision-making: When clients understand the reason why, they are more likely to approve budget adjustments and strategies that you recommend.
- Tighter collaboration: Clients who participate actively are more likely to share their feedback or preferences, which leads to increased satisfaction.
So, how do you create Facebook marketing reports that will swipe them off their feet?
Let’s start with the simplest tip—choose what you put there.
1. Use KPIs that Matter to Clients
Every client will have different goals and different KPIs tied to those goals.
It makes no sense to overwhelm them with data they don’t care about, like this:
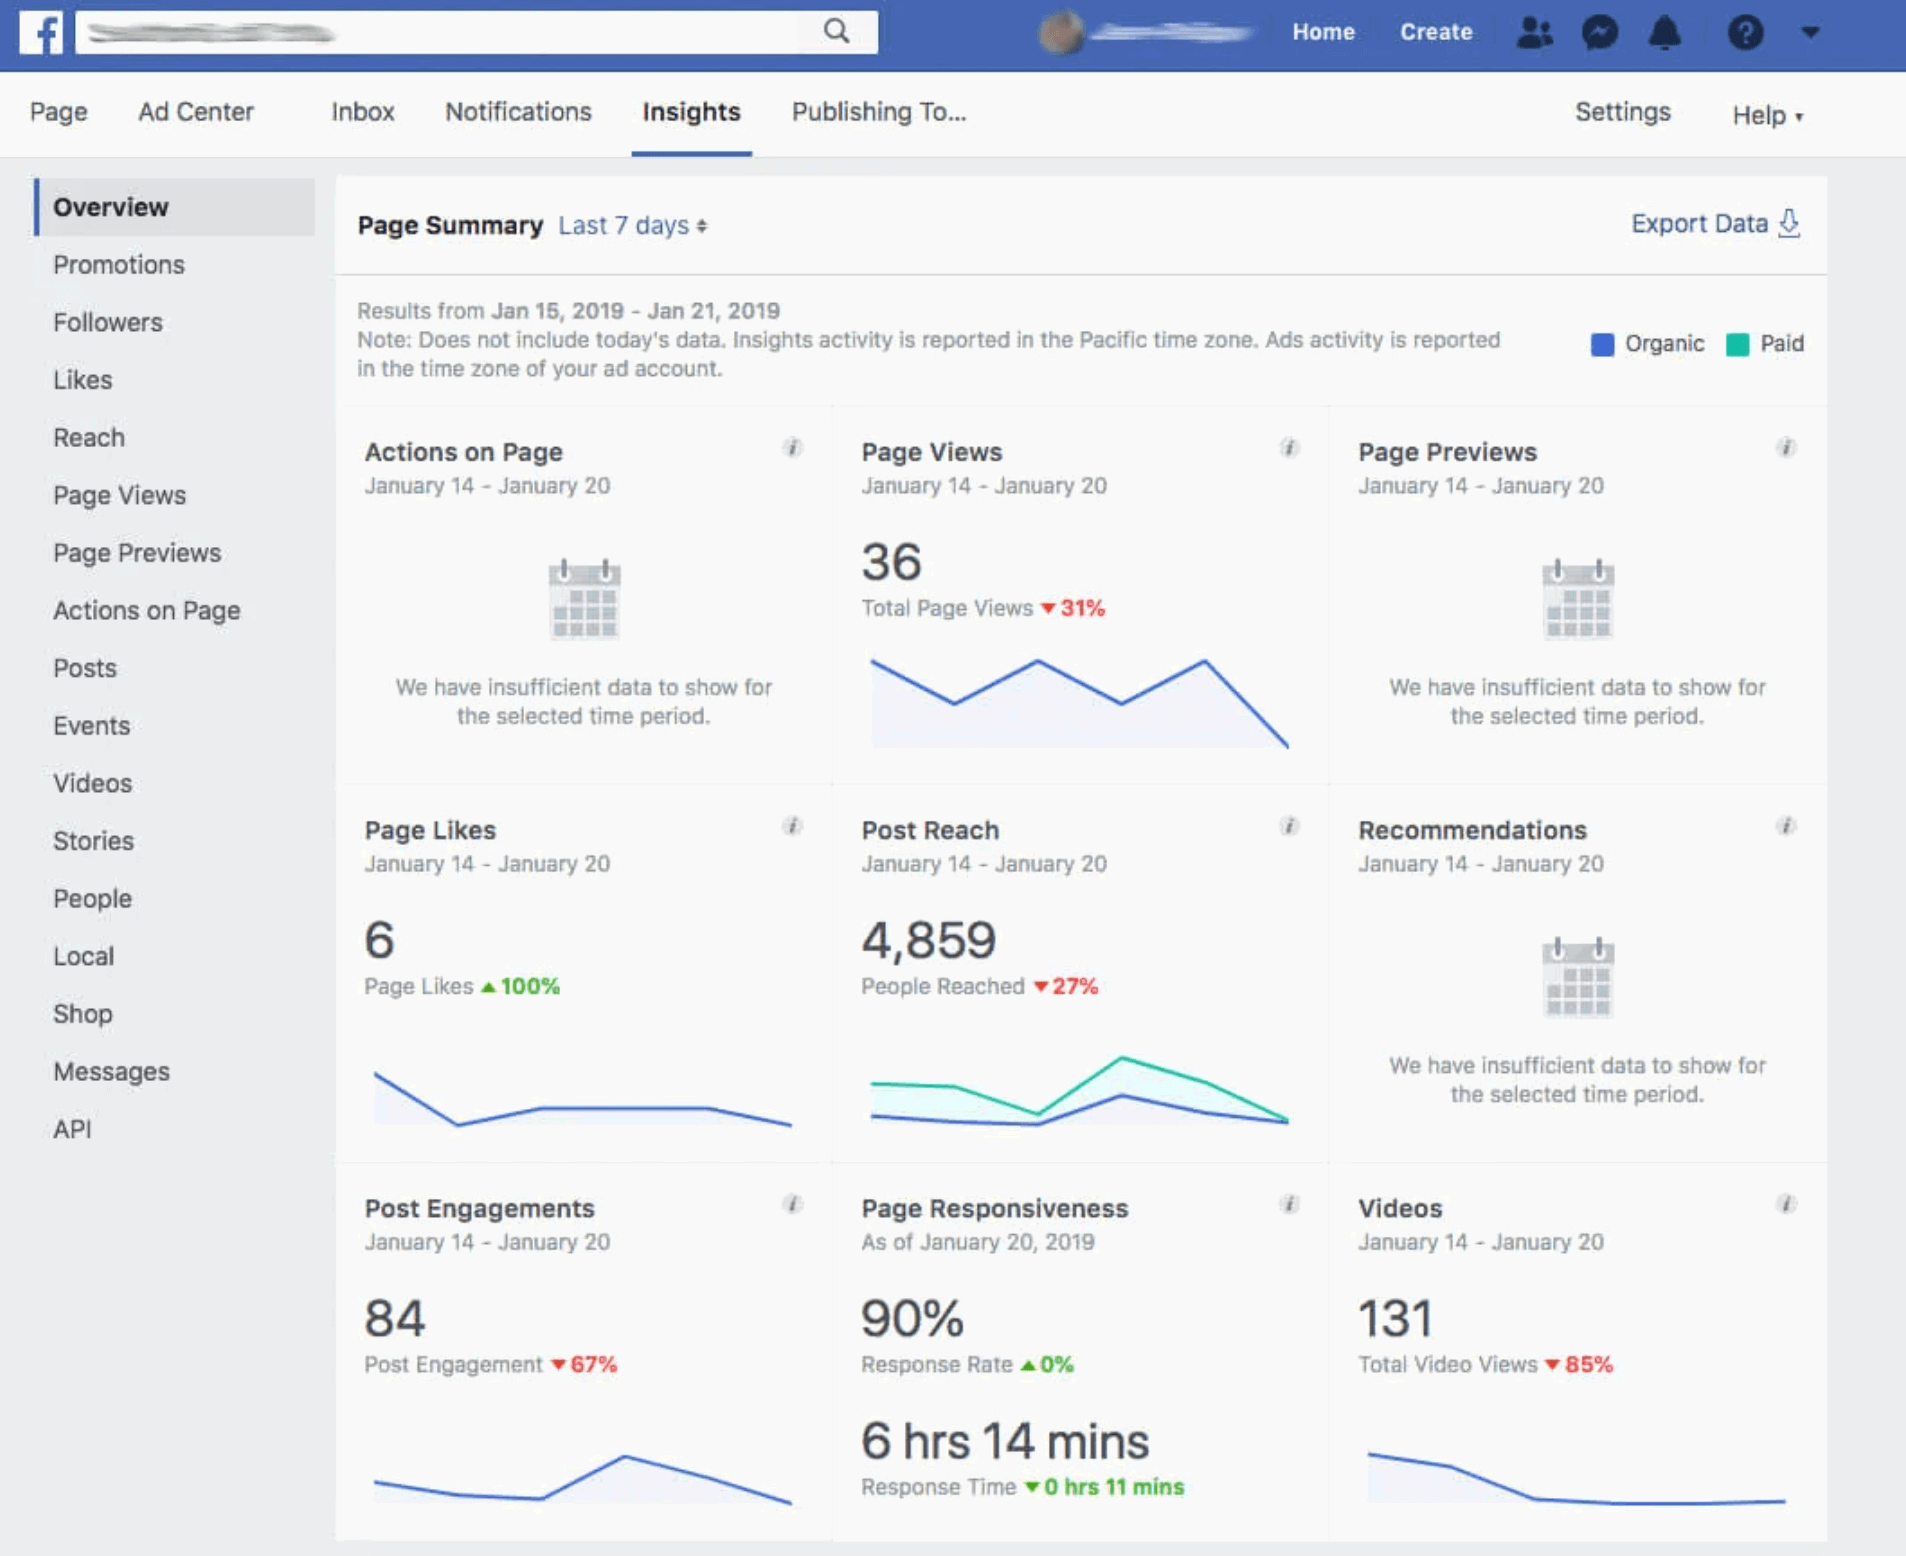
Facebook Insights report: So many tabs, so much data.
For example, Kyle Morris, CEO of LawTurbo, a digital marketing agency specialising in the legal market, says:
We structure Facebook reports to focus on what matters most: leads and ROI.
And explains which metrics their clients want to see:
For attorneys, conversions—such as form submissions, phone calls, or booked consultations—are the gold standard. We focus heavily on Cost per Lead (CPL), Conversion Rates, and overall Return on Ad Spend (ROAS).
Engagement metrics like Clicks and Reach are always there, but Morris says they only provide context for how the campaigns drive actual results.
In his words, lawyers care about one thing: leads that translate into cases:
This means we emphasize conversions and ROI in every report. We spotlight the campaigns that generated the most leads and provide insights into how their ad spend translated directly into client acquisition. By keeping the focus on tangible results, we build trust and show the value of their marketing investment.
Iryna Melnyk, Marketing Consultant at Jose Angelo Studios, also structures every Facebook analytics report for clients depending on their goals:
For brands focused on building awareness, I’ll emphasize Reach, Impressions, and audience demographics. For those prioritizing engagement, I track Likes, Shares, Comments, and Click-through Rates.
To her, the key is to align metrics with the clients’ objectives, so they see how their investment pays off:
Conversion-focused campaigns get a deeper look at ROI, Cost per Result, and Website Traffic generated through Facebook.
Peter Murphy Lewis, CEO at Strategic Pete, also handpicks the metrics depending on the client's goals. Still, he says, these “core metrics” always provide valuable insights:
Engagement metrics in terms of likes, comments, shares, and saves that identify the resonance of the content among the audience; reach and impressions for visibility; and click-through rates (CTR) for ad and post efficacy.
From there, everything depends on what you want to achieve with the campaign.
In campaigns designed to drive revenue, I add in conversion metrics like leads or purchases to measure the return on investment. These are complemented by ad spend and ROAS metrics that provide a clear picture of cost efficiency, adds Lewis.
After the money metrics, you can offer more insight into your client’s Facebook account performance:
Beyond these, I often include audience demographic breakdowns to refine targeting strategies. If a certain age group or location is driving better results, that data becomes actionable for future campaigns.
2. Tell the Story of the Client’s Facebook Data
Once you’ve decided which KPIs to use in your report, you should structure your report in a way that tells a story.
Start with high-level page insights and expand into more specific KPIs with comparison charts, audience distribution donuts or pies, breakdown tables, etc.
Morris likes to break down his Facebook analysis reports into for key sections:
1) Executive summary highlighting the most critical metrics, 2) Detailed performance overview, 3) Campaign-specific breakdowns, and 4) Actionable recommendations. This structure ensures clients can quickly identify the success of their campaigns without getting bogged down by unnecessary data.
Lewis, on the other hand, likes to go with three sections headed by the Performance Summary.
In this section, he puts top-level insights with very clear visuals, such as bar graphs or pie charts:
This section is designed to immediately answer the client's primary questions of "How are we doing overall?" and "Are we improving?" For example, showing month-over-month engagement growth through a chart helps clients see progress at a glance.
The second section is Detailed Analysis, in which he breaks down campaign performance and audience demographics:
What it does is explain not just what transpired but why certain trends surfaced. For instance, a campaign may show a very high click-through rate yet poor conversions; I'll analyze the landing page experience to identify the problem.
The good thing about Whatagraph reports is that you can slip in a note with actionable insights anywhere in the report.
That’s a quick and easy way to point out a campaign’s success or areas for growth.
(Btw. Whatagraph’s AI Summary makes it super-easy to grasp the high points of presented data.)
Lewis finalizes each report with Recommendations and Next Steps:
Clients don't just want to see results; they want to know what they should do. I provide specific, actionable insights, such as reallocating budget to video ads if those are outperforming static images.
3. Keep the Reports Visually Engaging
So far, you selected the metrics you want to use and decided how to organize your report to tell a story.
Now, it’s time to make your report visually appealing.
Sure, Excel charts do the job, but there are a lot of things you can do to make your reports look professional and easier to read.
The biggest change you can make is to choose a Facebook analytics tool that has clean and sleek visuals out of the box.
Still, when building a Facebook insights report for clients, the best advice is to stick to a minimalist layout.
You can be tempted to fit more KPI widgets onto the page, but remember which ones matter the most.
Group the related data visually and avoid clutter by using plenty of white space.
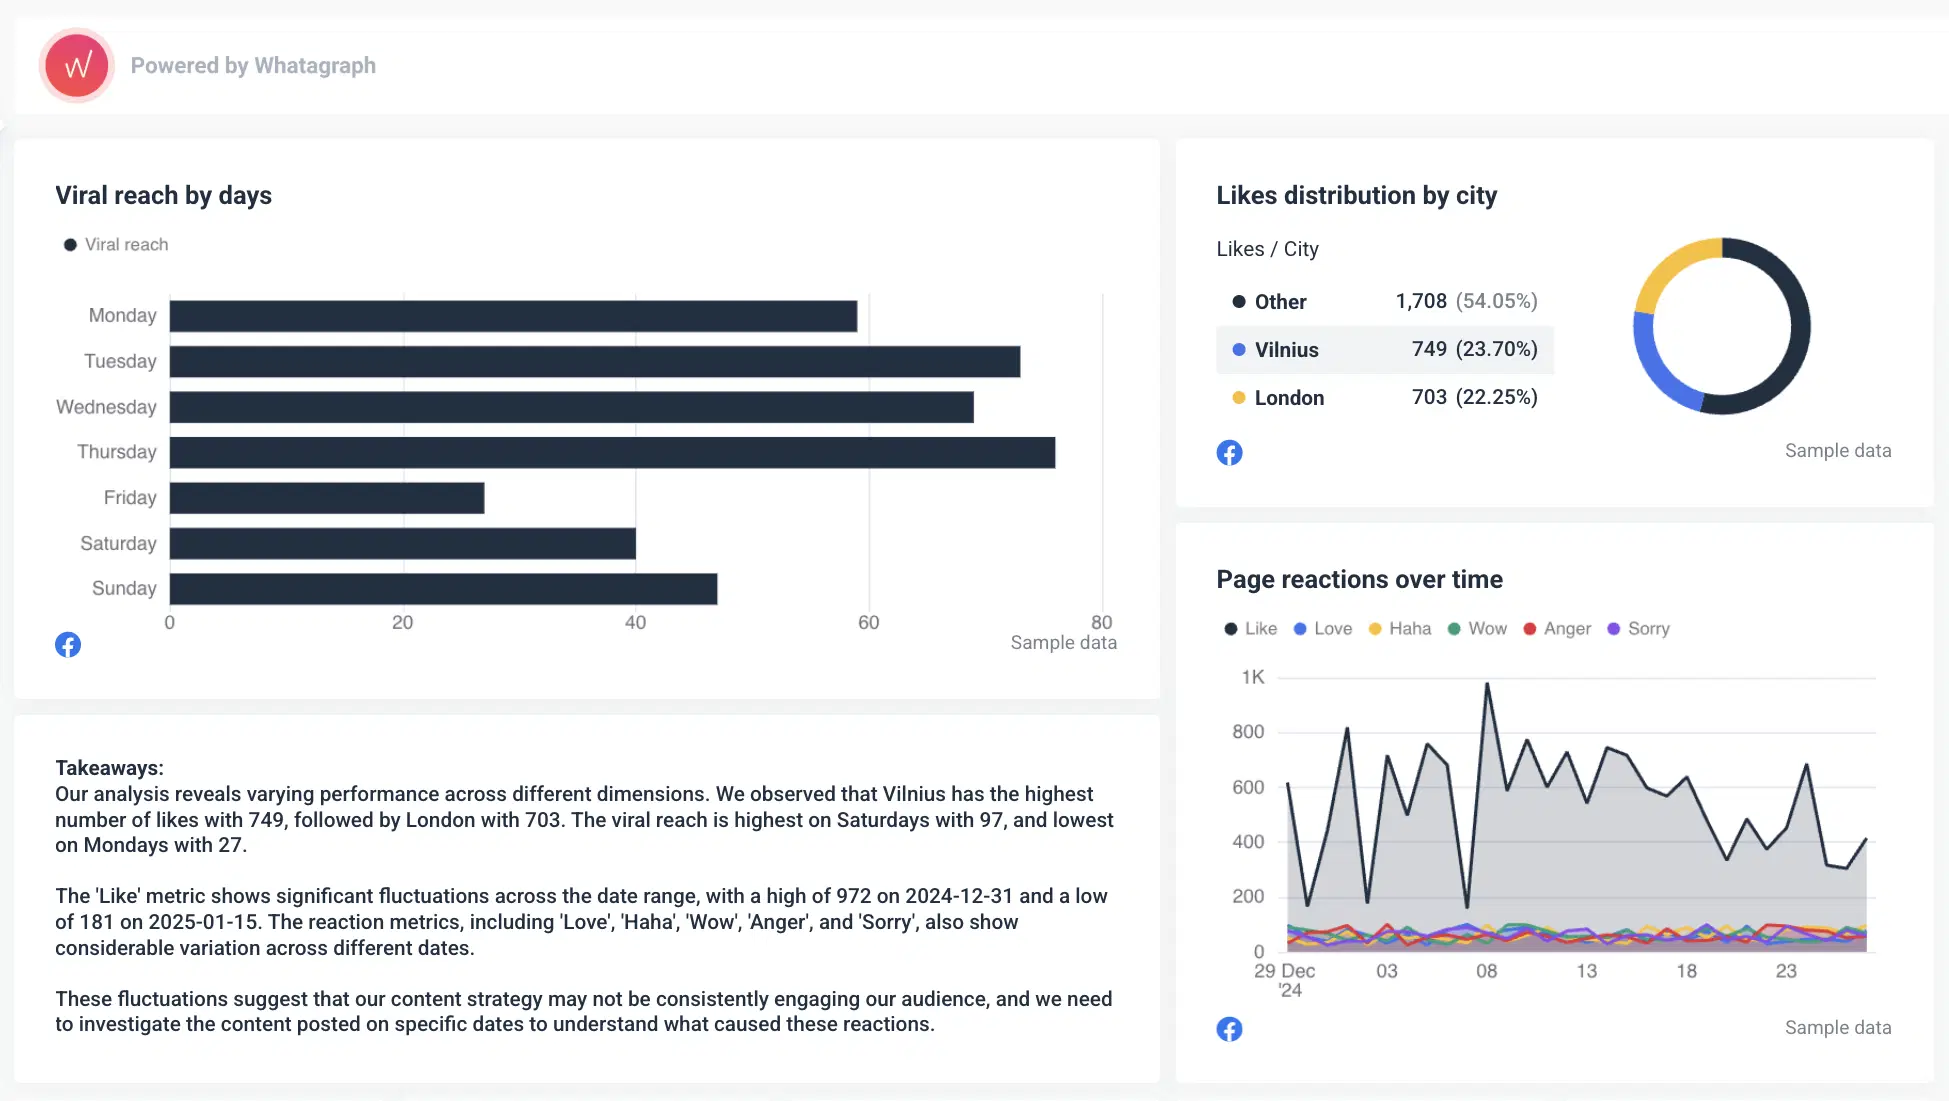
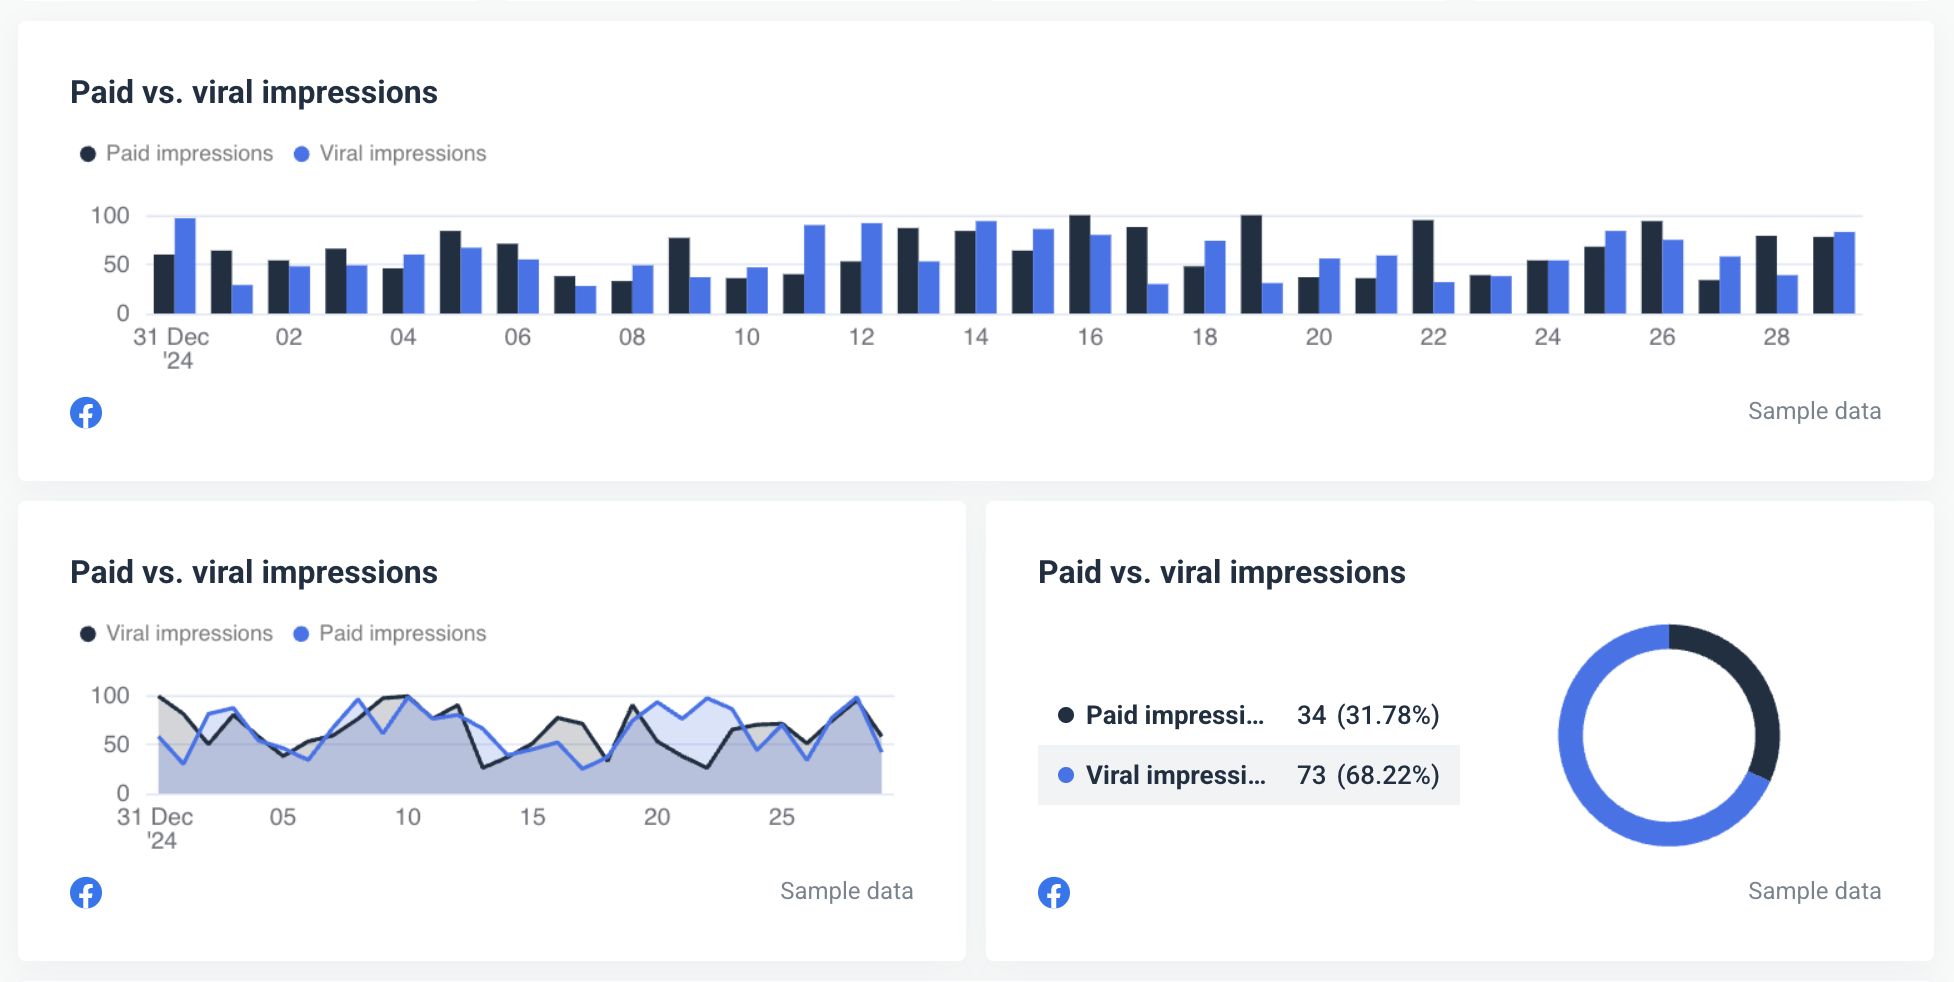
Charts and graphs are your best friends when showing trends. For example:
- Bar graphs for campaign comparisons month-over-month
- Pie charts for audience demographics
- Line charts for performance trends over time or comparisons
Even better if you highlight key data with different colors, like, for example, green for improvements and red for drops. This way, you can draw attention to important changes.
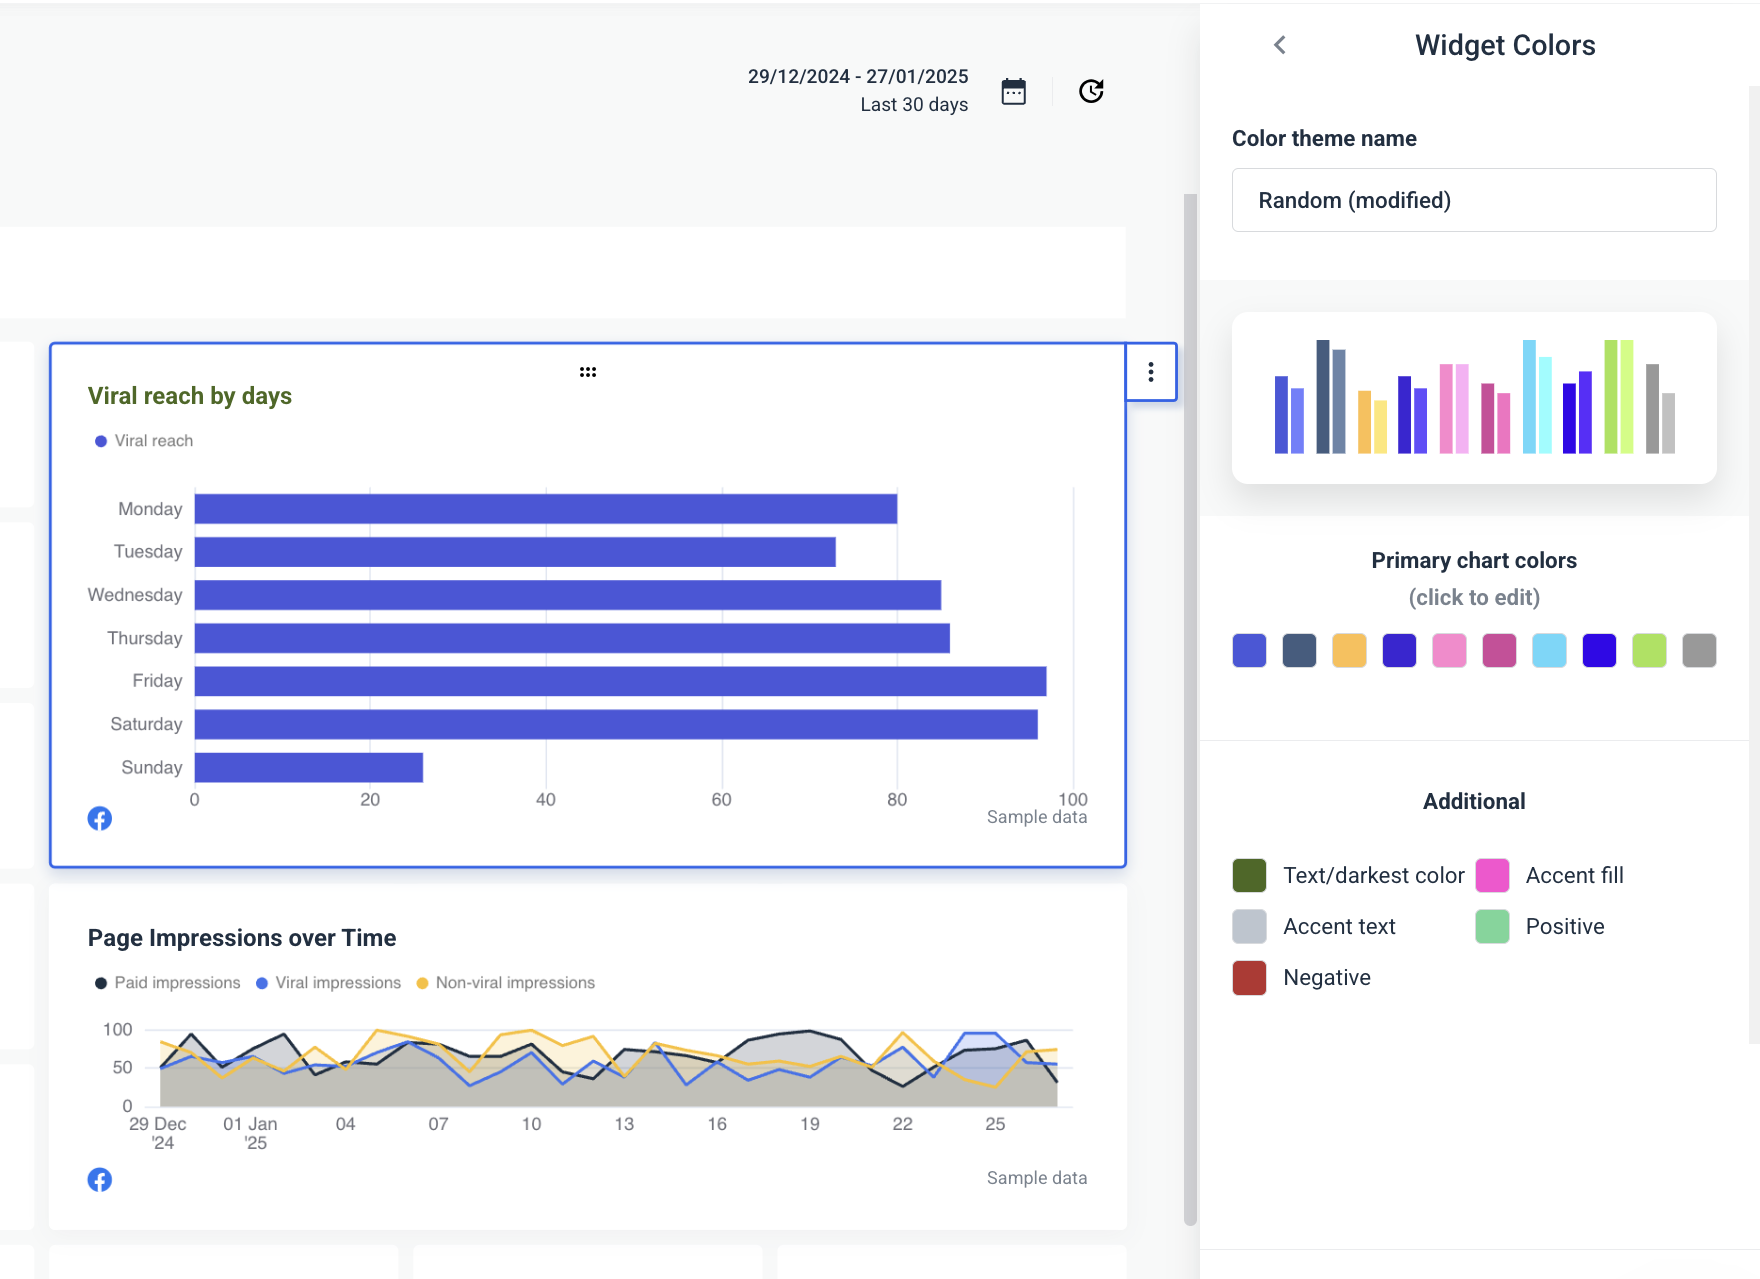
On Whatagraph, you can choose custom colors for every part of your visuals and even save your own schemes.
You can use custom headers with subtle brand elements to make the report look more personalised.
On Whatagraph, you can completely remove any mention of us as a software provider and use your agency’s or client’s logo on every report you make.
You can also change every widget icon for a more personalised or engaging variant.
![]()
Another way to add more visual interest to your reports is to highlight the best-performing Facebook posts using Whatagraph’s media widget.
Just pick whether you want a compact or expanded version and drop it on your report page.
Select the metrics, dimensions, and other info you want to show, and you’re good to go.
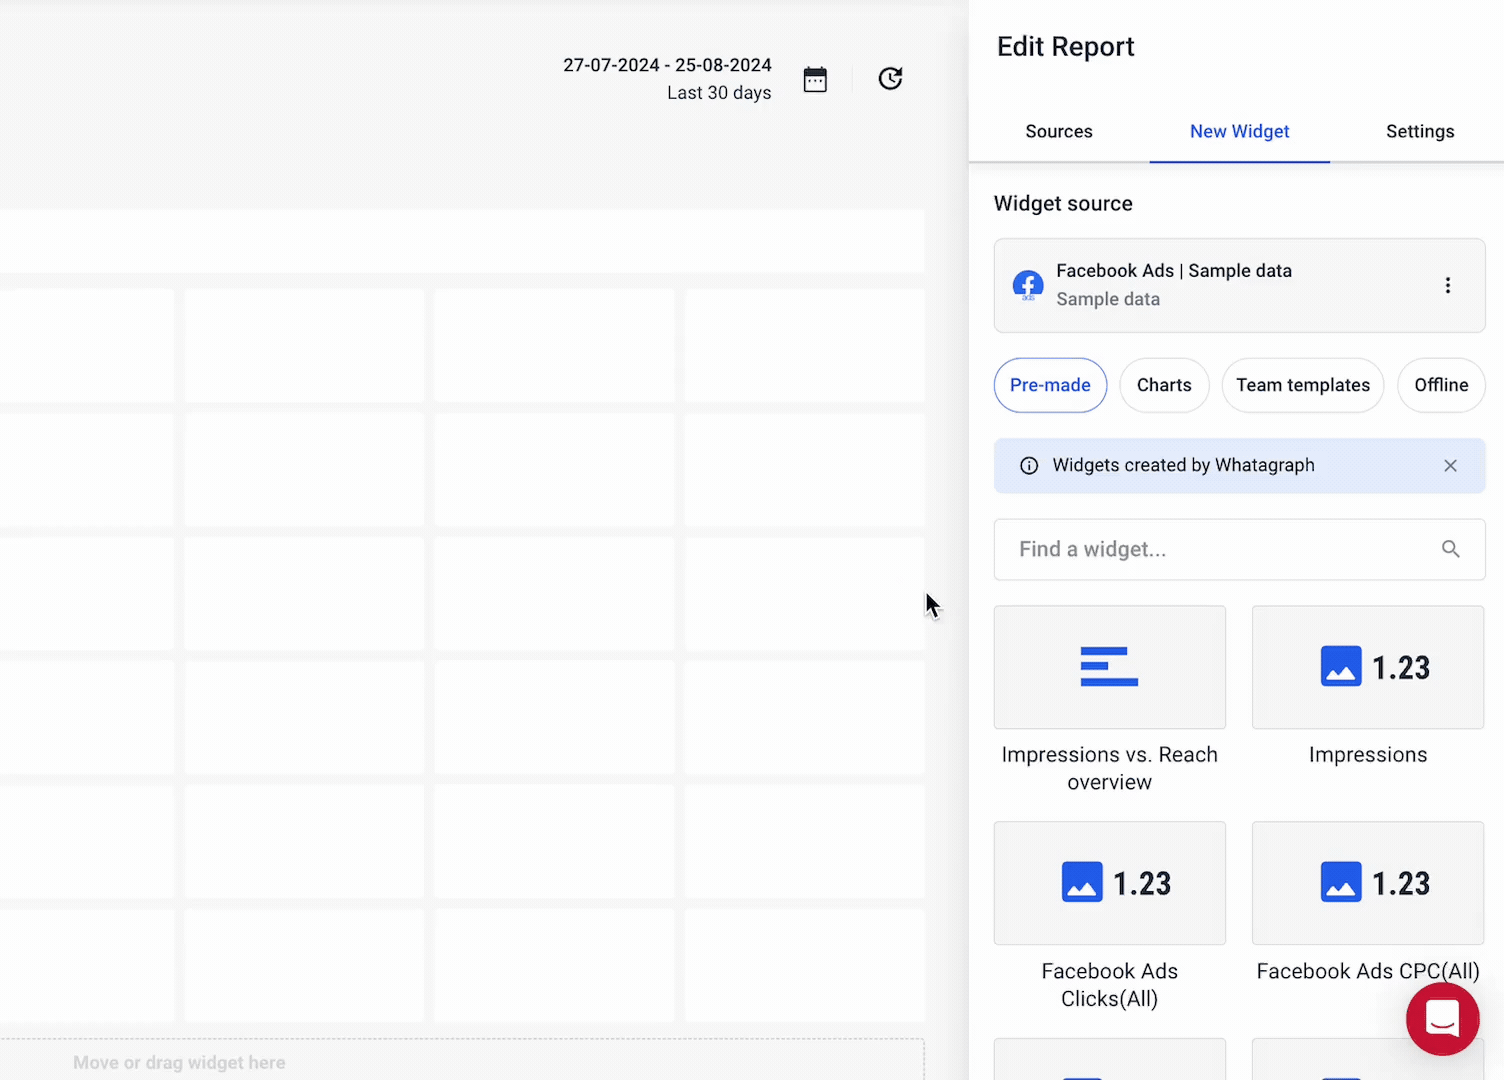
With media widgets, you can:
- Present media and story engagement in a single board.
- Show thumbnails of each post to see what performs and what doesn’t.
- Resize the widget to show more thumbnails.
4. Automate Reports
One client will ask for a live dashboard they can check every time, even on mobile.
Another will tell you they prefer static PDF reports they can file and present at monthly performance meetings.
The best thing you can do?
Choose a reporting solution that can do both without missing a beat.
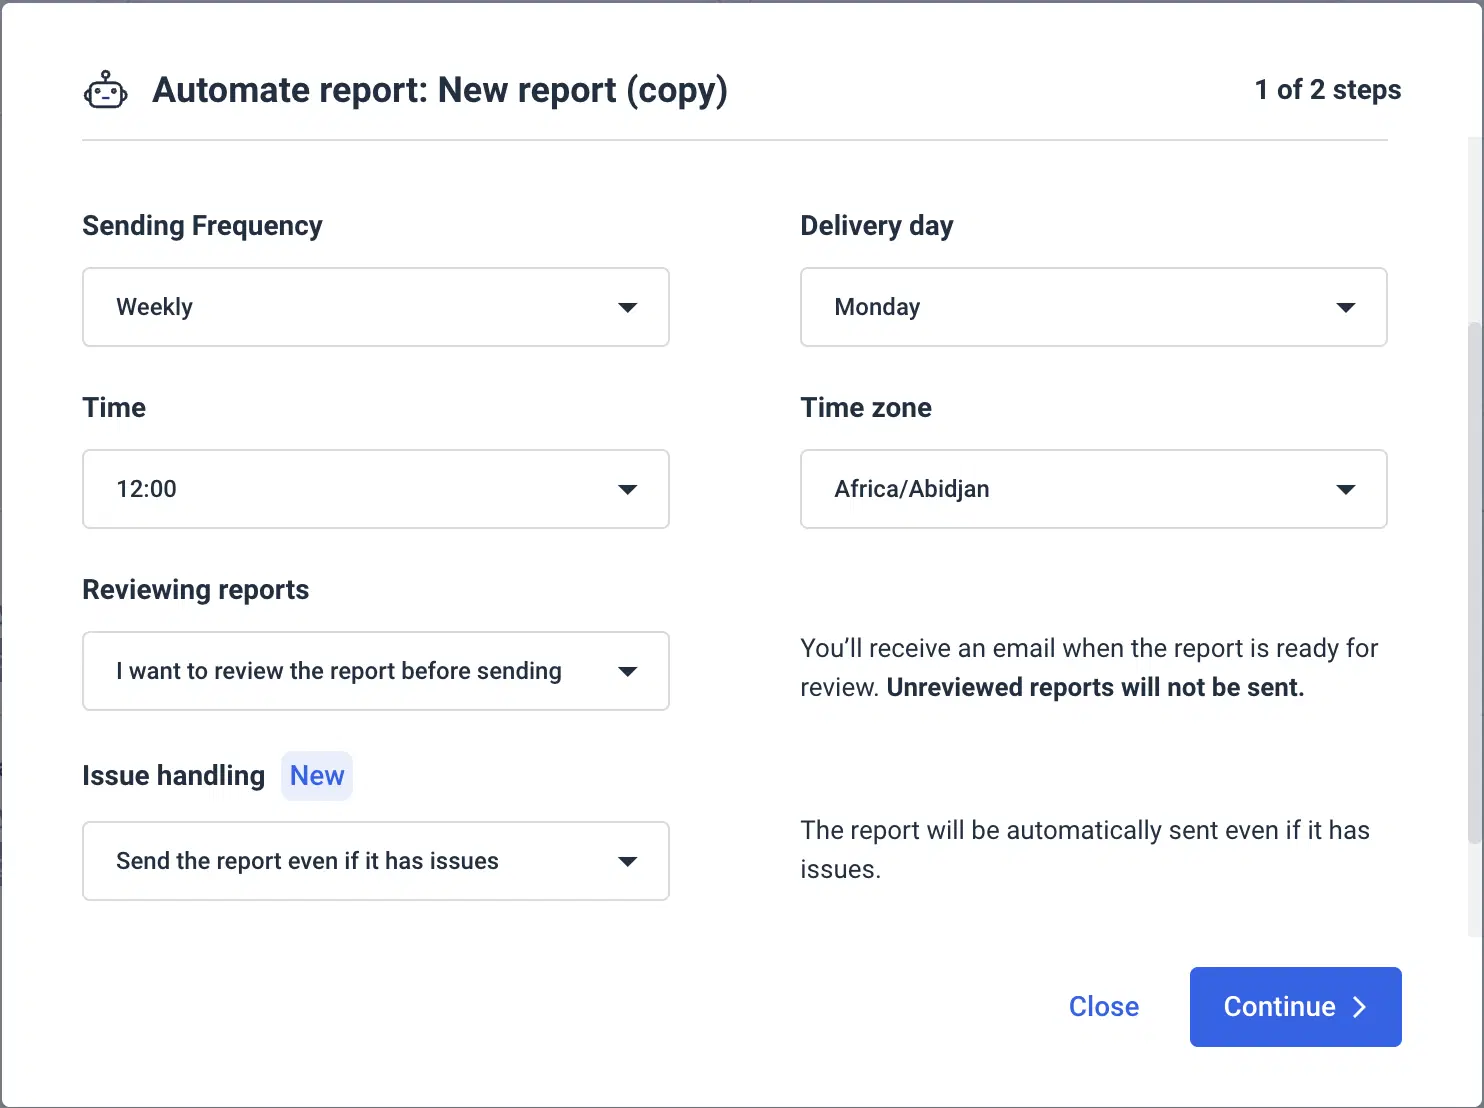
On Whatagraph, you can easily set up both report automation options:
Share a link to a live report: Clients can access it at any time. They can change the date range to see how the performance has changed over time and hover over graphs to get more data from specific points.
Schedule PDF report sending: Once you finish a report, set up an email schedule by the client’s preferences.
Set a data range, time of day, time zone, and you're done. The client will get a fresh report in their inbox at the same time every time.
5. Keep the Reports Consistent
Use the consistent report format, structure, and terminology in every report you send.
You may think that changing the report layout from time to time is good for keeping the readers engaged, but it will only confuse them.
To avoid this, Lewis regularly uses report templates:
Consistency also matters—use the same report format every time so clients can quickly find and interpret what matters to them.
Apart from the library of pre-made templates, on Whatagraph you can save any report as a team template and use it whenever you want.
How to Create a Facebook Report: Step-by-Step Guide
You can create a Facebook report in two ways:
- Make a copy of this FREE Google Sheet – this is free, but you won't get comprehensive cross-channel insights, and you'll need to spend a lot of time copying and pasting data points from Facebook Insights.
- Follow the steps below to use Whatagraph – this is easy and fast since you don't need to do any manual work. Whatagraph collects, cleans, and visualizes your data automatically.
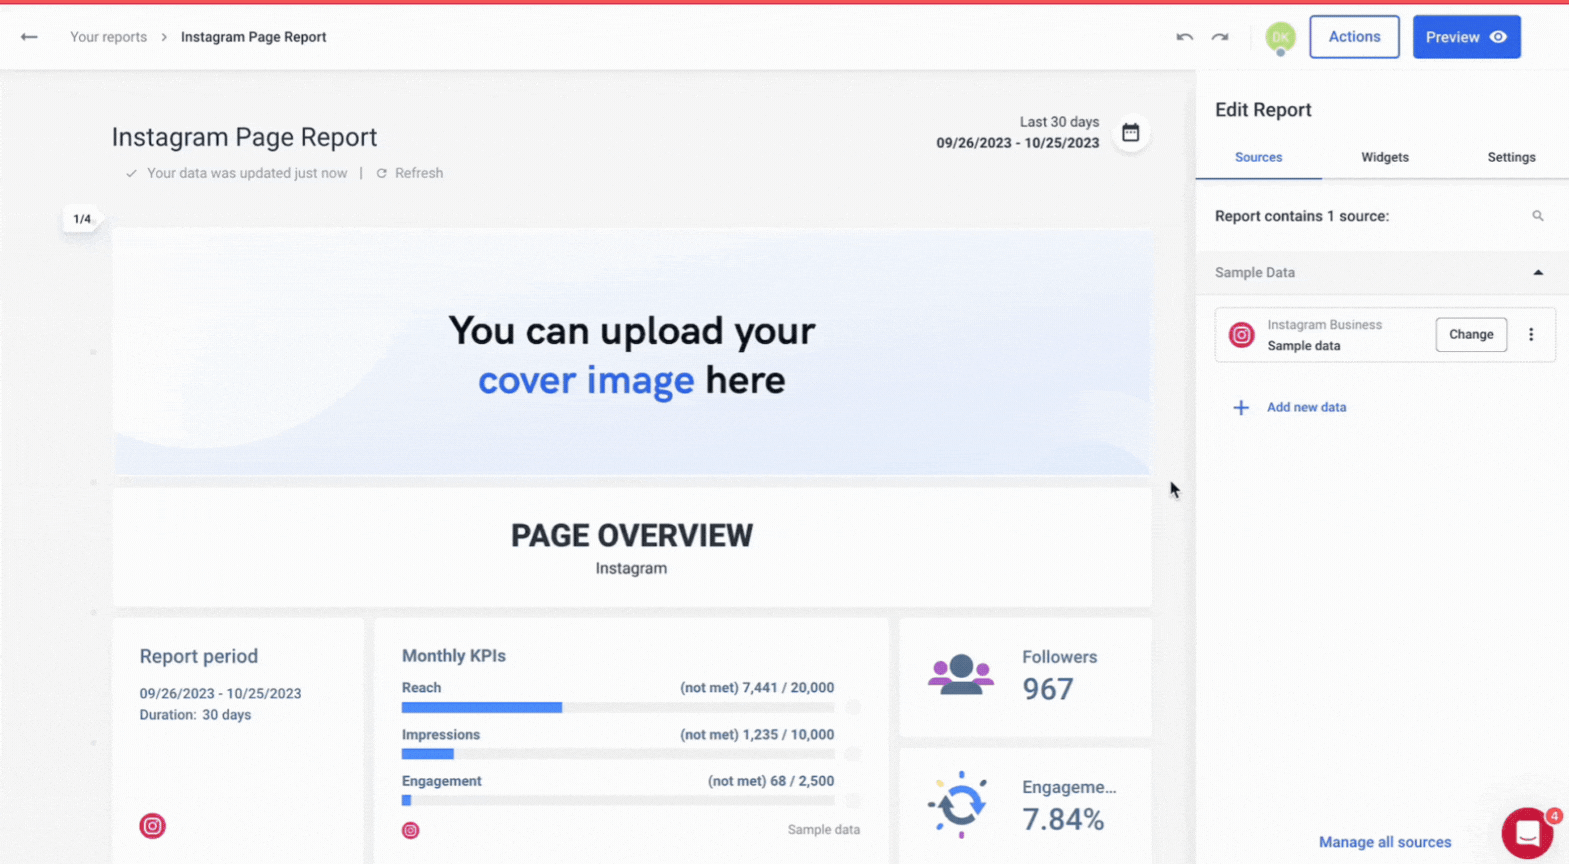
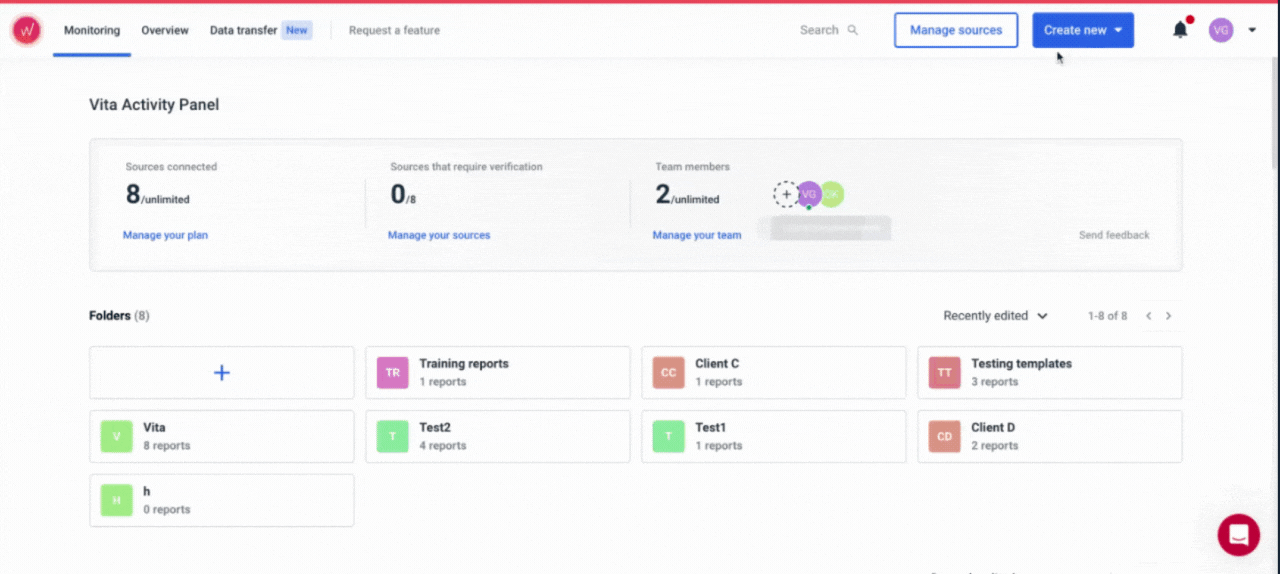
Step 1: Connect all Your Data
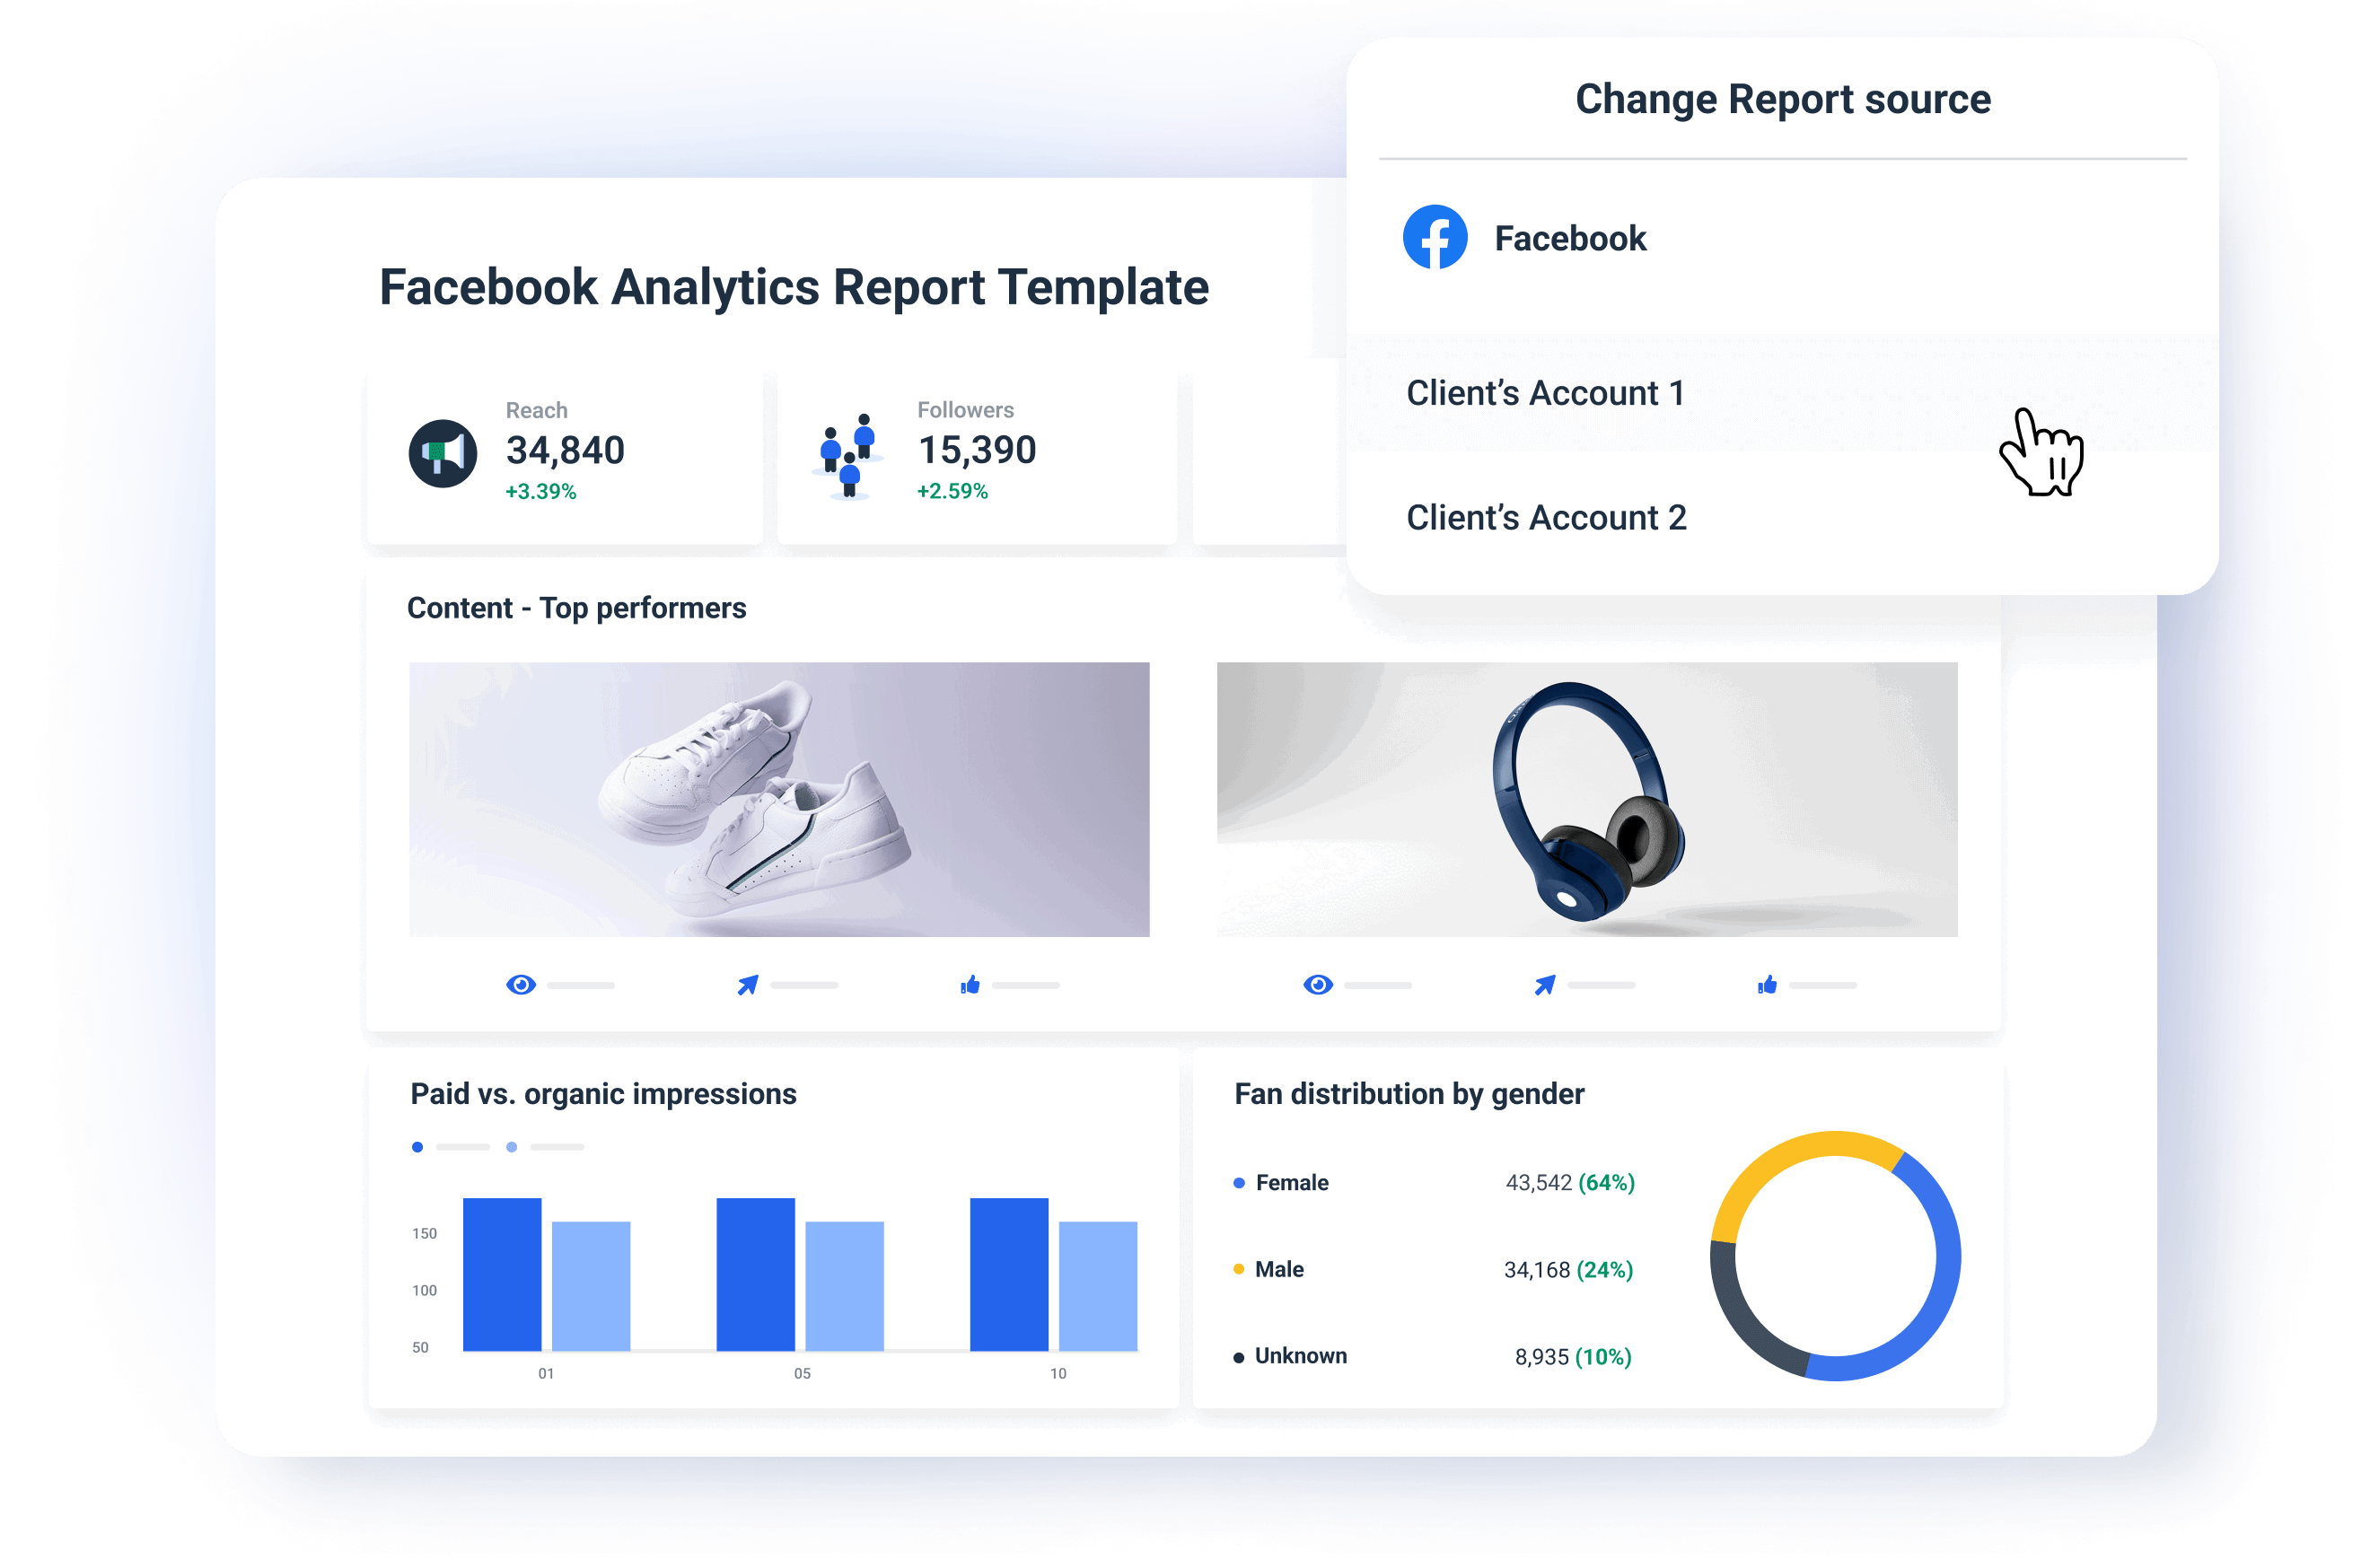
Start by connecting the data from all the Facebook page accounts you’re using for a specific client.
With Whatagraph, you don't need to stitch any spreadsheets. Instead, you can connect all your data in just a few clicks.
Apart from Facebook, Whatagraph has fully managed integrations with popular social media platforms, SEO, PPC and other marketing tools:
- Google Analytics 4
- Google Search Console
- Ahrefs
- Semrush
- Facebook Ads
- LinkedIn Ads
- YouTube
- Mailchimp
- CallRail
- Salesforce
- HubSpot
And many others.
These direct integrations are much more reliable than third-party connectors that many other marketing reporting tools use. Third-party connectors can slow down your online report or give you inaccurate data as they can refresh at different rates from one another.
With Whatagraph, you can pull data from scattered sources right into your reports without missing a beat.
The integrations are developed and maintained by our dedicated team of engineers, so once you connect your accounts, there’s nothing to update or re-connect on your part.
How to do it:
- Open Whatagraph, go to Data Sources and select the marketing platforms you need.
- Follow the on-screen instructions to provide the necessary credentials and connect each source.
- Once connected, Whatagraph will automatically pull in the latest data and update it automatically.
This way, you get:
✅ A centralized view of all your performance metrics across platforms and tools.
✅ Accurate and relevant data in every report you send.
Step 2: Choose a Report Template or Start From Scratch
You can create your Facebook analytics report from scratch and structure it just as you want.
Still, having a template to start with saves a lot of time, especially if you need to report to several clients or stakeholders regularly.
Whatagraph offers pre-made digital marketing report templates that you can customize for each client.
The template is your starting point. From there, you can pick the metrics and add sections that best present your campaign’s results.
How to do it:
- Go to the Templates section in Whatagraph.
- Choose the Facebook report template.
- Alternatively, select Create New Report to build a report from scratch, choosing only the widgets and metrics that you need.
The result:
✅ Faster report building for multiple campaigns and stakeholders.
✅ You can tailor each report for a specific campaign by highlighting the most relevant data.
But, when it comes to tailoring, the next step is crucial.
Step 3: Customize the Report for a Specific Client
On Whatagraph, you can quickly customize any report template to a client's specifications. Once you find a template that is the closest match to your needs, you can start tailoring it.
Let's recap quickly:
✅ Connect the data sources: You can load a template with just one source connected, but now you need to add other sources that hold your campaign data.
✅ Customize metrics and widgets: Check out the metrics already included in the template and decide if you need to remove some of them so the clients can really focus just on the important ones.
✅ Choose the appropriate visuals: Whatagraph has different chart options, such as line charts, bar graphs, funnels, and pie charts. If your client prefers a bar chart to a pie chart for a specific metric — a piece of cake. Pick the bar chart widget and select the metrics and dimensions you want to see.
✅ Arrange the widgets for easy interpretation: Always put the key metrics, like Organic Reach or Reactions, at the top of your report, right next to the goals widget.
Same metrics, different visuals. Choose the widget type that your clients prefer.
You can also create custom charts and save them as template widgets.
Step 4. Organize Data for Actionable Insights
Let’s quickly sum up what we have done so far:
- Connect scattered sources - Done ✅
- Pick a template - Done ✅
- Tweak it for your campaign - Done ✅
The problem is that actionable insights are still hidden under a heap of data.
With Whatagraph, you can quickly sift through that data heap and pinpoint the reasons for high or low points in your campaign.
Our Organize feature helps you make sense out of scattered data by creating:
- Custom metrics: Unify and change the names of different metrics permanently in your report or create a new metric using a simple formula.
- Custom dimensions: Unify names of different cross-channel dimensions and group data points from different sources.
- Data blending: Great for combining different sources together into one unified data source for getting quicker insights and keeping your dashboard neat.
All these features are 100% code-free and can help you cut through the clutter and uncover hidden actionable insights.
Thanks to recently launched Performance Monitoring, you can get actionable insights from your data even faster.
You can create:
- Source groups: Group 100s of scattered data sources into a unified group in seconds.
- Custom tags: Add custom tags to your data and filter it by client, business type, location, Account Manager, etc.
- Overview: Visualize your key metrics in one view and easily spot performance trends.
Step 5. White-Label the Report with Client Branding
Whatagraph has everything you need to deliver a professional experience with every Facebook page analytics report you share with your clients.
You can:
- Upload your logo or your client’s logo.
- Create custom color schemes.
- Add footer and header texts.
- Create custom domains to host and share your reports.
- Change the icons and colors of your widgets.
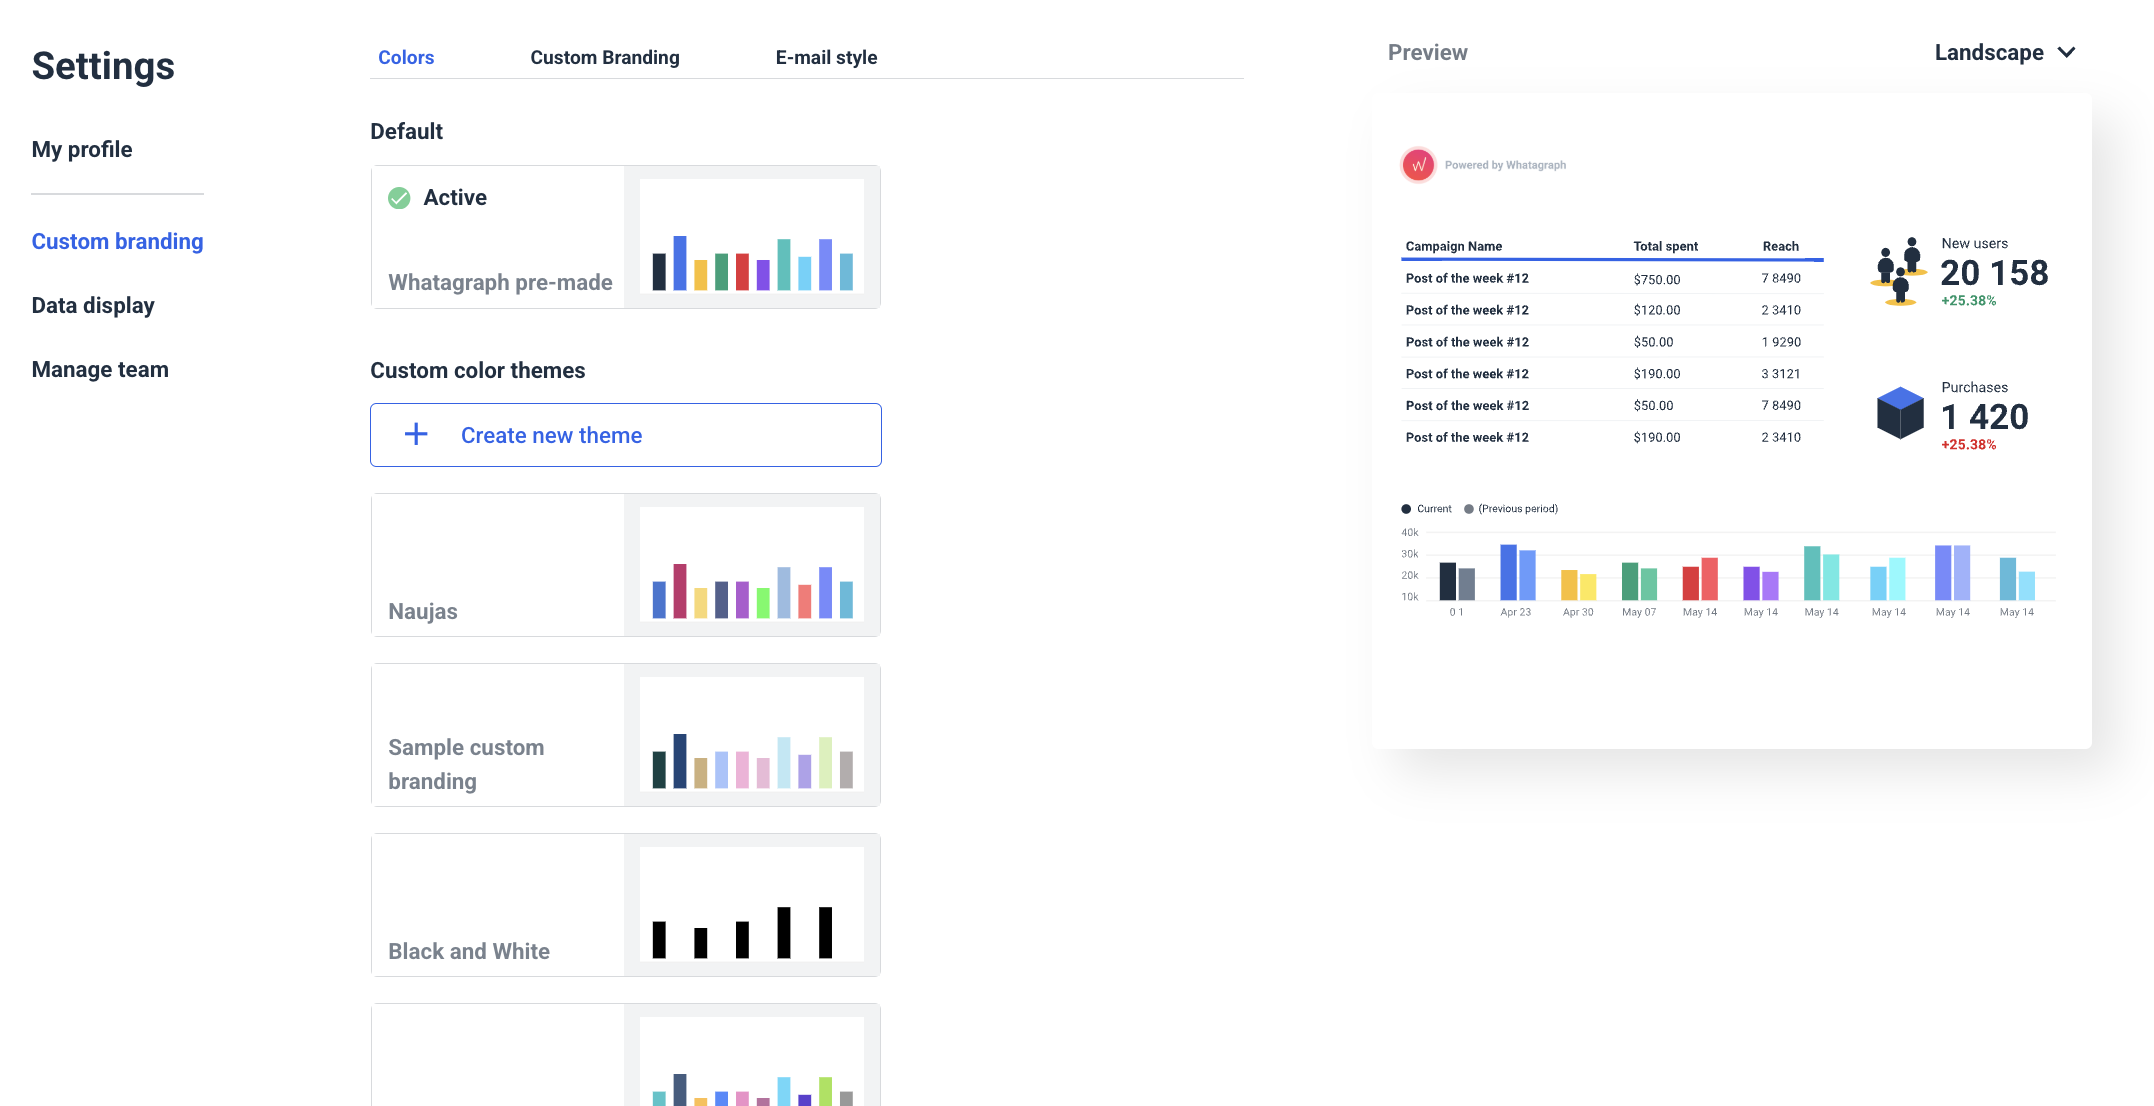
You can create a global theme for your agency or create multiple themes on the report and even at the widget level.
You can also share your white-label reports on a custom domain and hide any ties to Whatagraph as the software provider.
Step 6. Automate How You Share Your Report
The last step is to share your reports with your clients or stakeholders.
You can do this on Whatagraph in three main ways:
- Share password-protected links to a live report.
- Send reports as automated emails on a regular timetable (e.g. every week, month, …).
Export as Excel or CSV files.
How to Structure a Facebook Analytics Report
Here are the 5 sections of a Facebook analytics report that no marketing professional will skip.
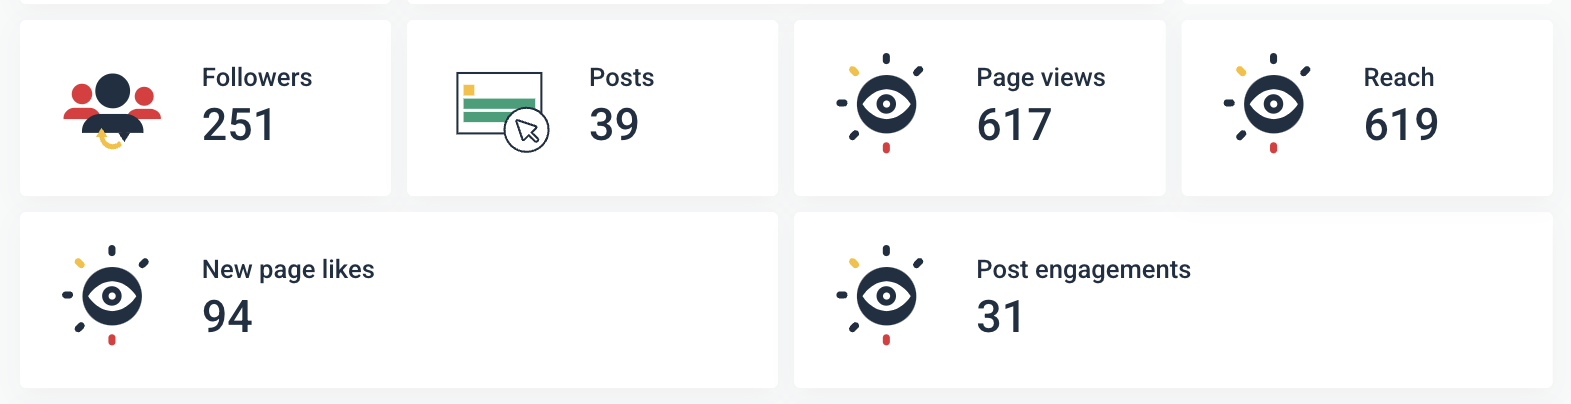
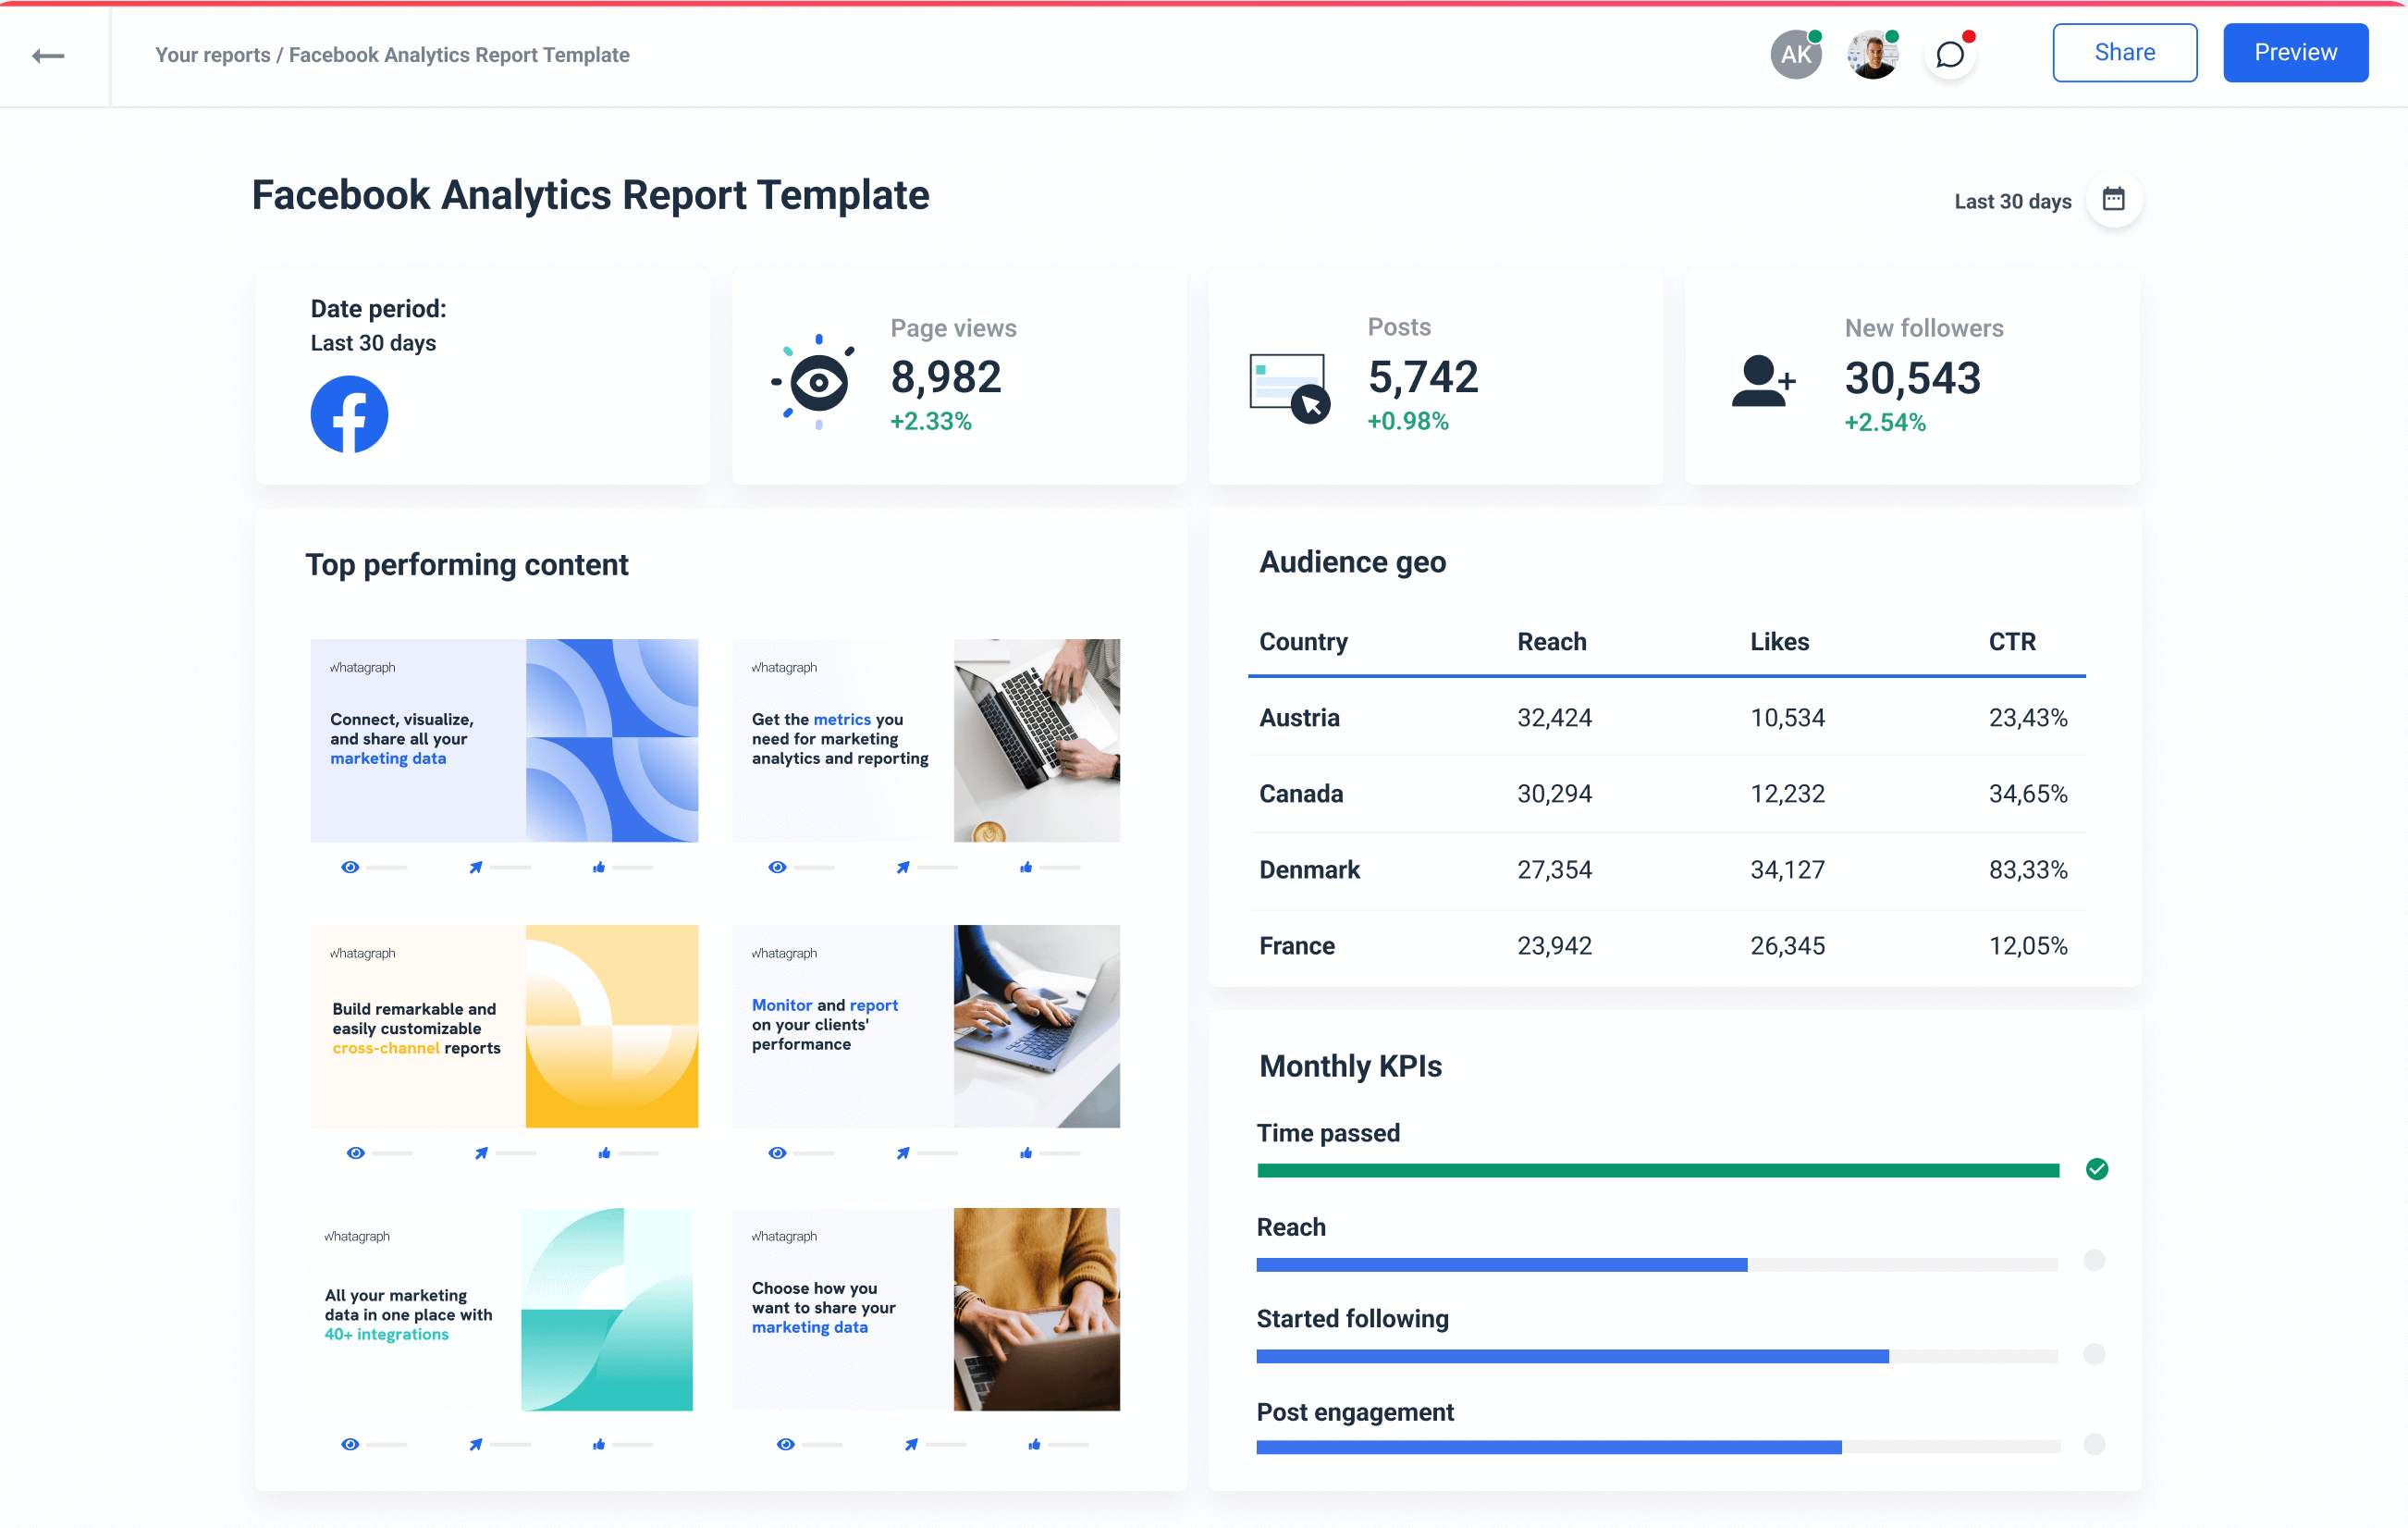
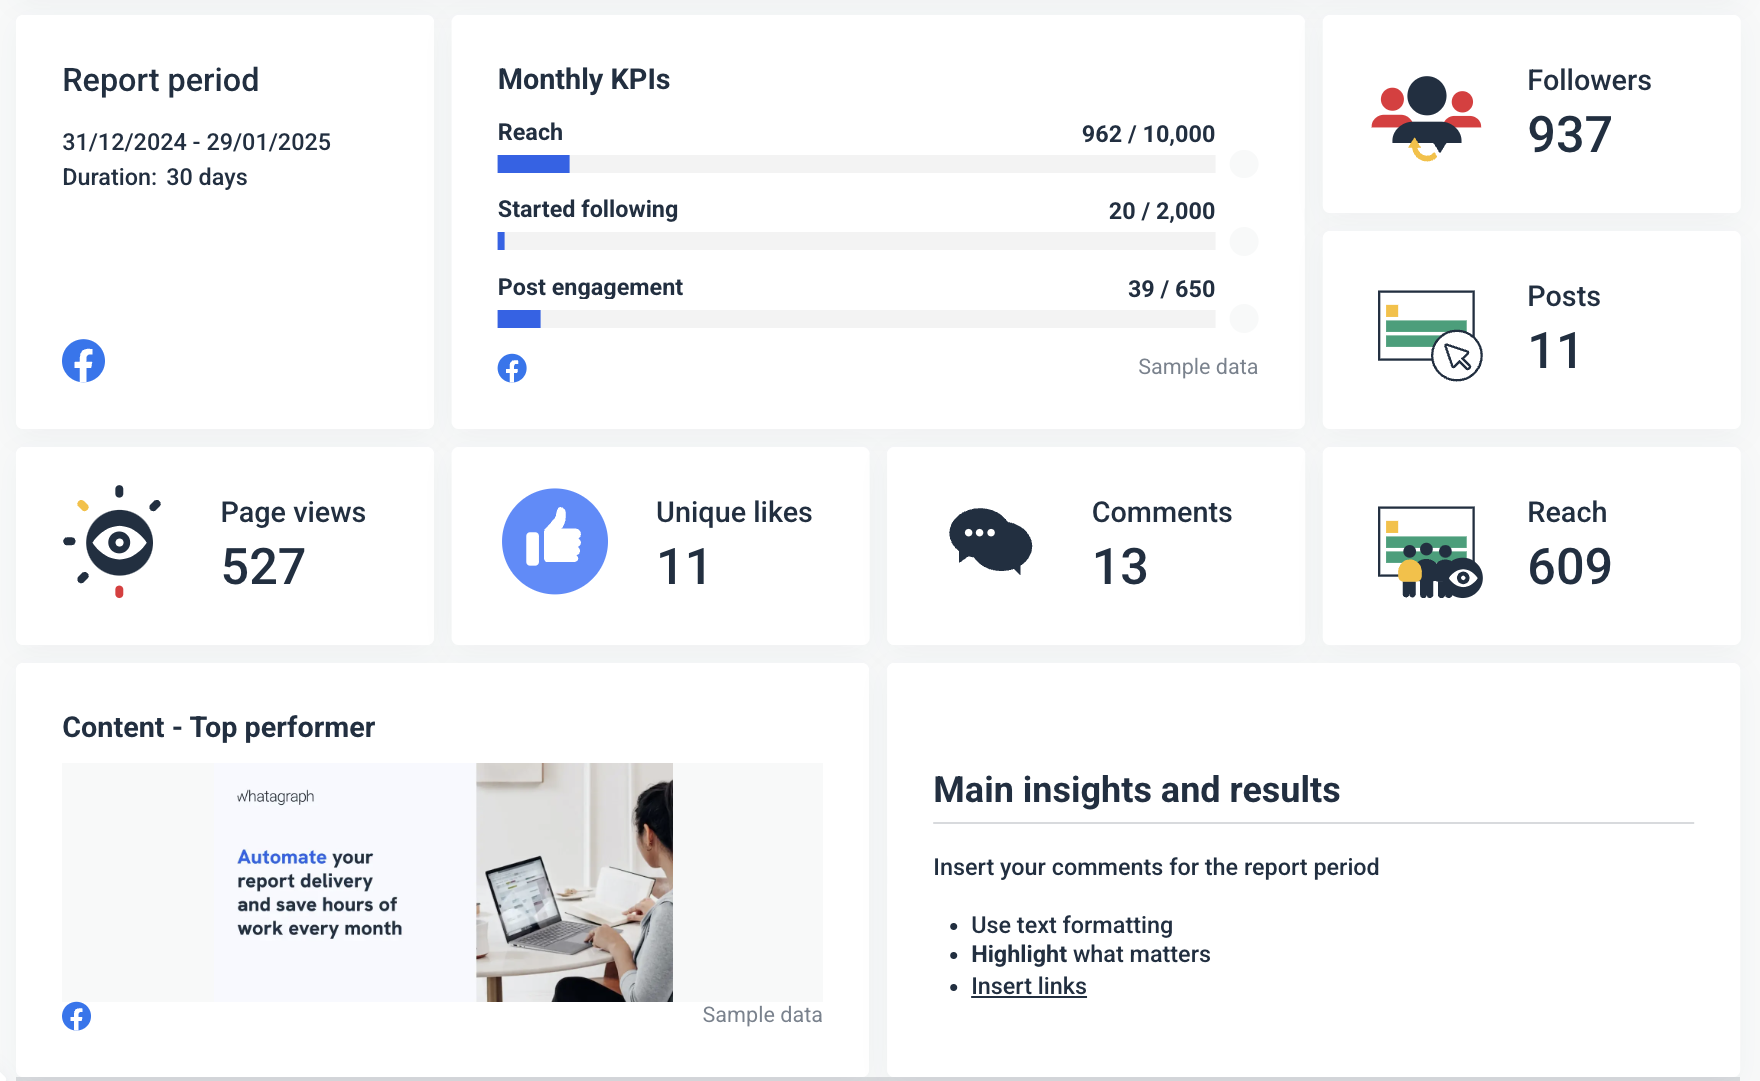
1. Executive Overview
This section shows the overall Facebook page performance and trends without diving into details.
It brings attention to key Facebook metrics like:
- Followers — Number of people who opted to receive updates from you.
- Total Reach — How many unique people saw the campaign.
- Page Views — The number of times people viewed your Page's profile (including people who are logged into Facebook and those who aren't).
The executive overview saves time for clients who don’t have to sift through the entire report to get the big picture.
If the results are below expectations, you can investigate specific areas more closely.
For example, if Post Reach has dropped by 15%, this section helps spot the trend immediately.
From there, you can do an in-depth analysis of post creatives or audience targeting to find the cause.
2. Facebook Audience Insights
The demographics section helps you understand who engages with your campaign. This is important for optimizing targeting and refining content.
Key metrics to include:
- Location – Where people who are most engaged with the campaign come from.
- New Followers – Page followers gained or lost over time.
- Returning vs. New Visitors – How many users engaged for the first time vs. repeat interactions.
- Best Day for Engagement – Days when users interacted most.
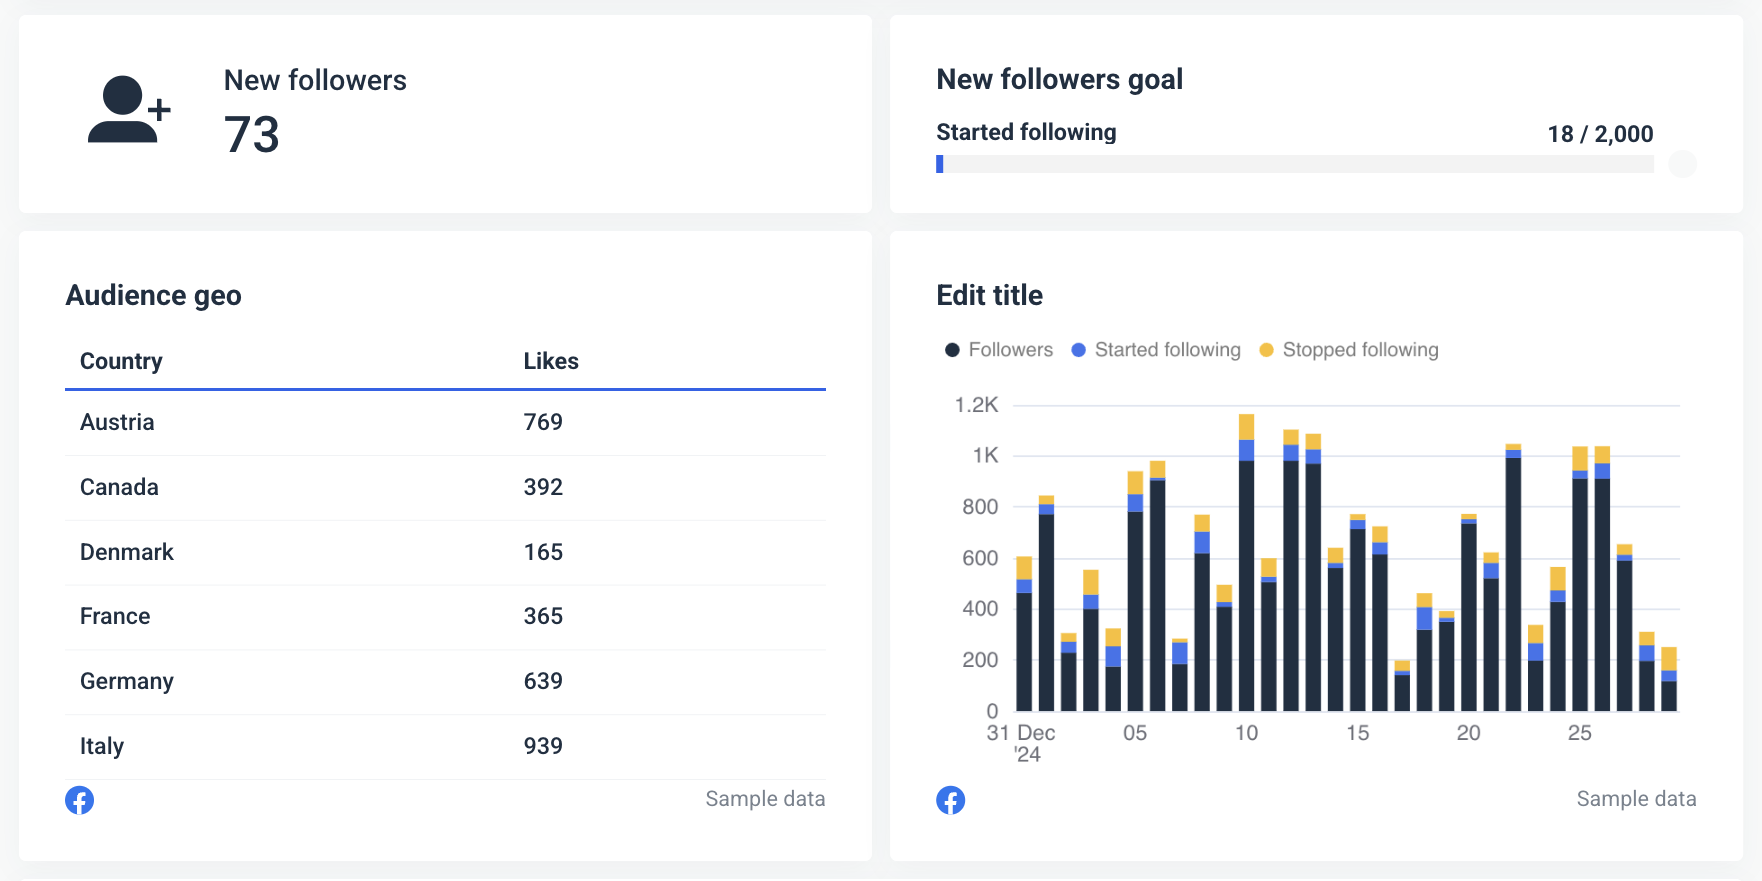
If you know your audience, you can improve targeting for the current and future campaigns.
It also makes it easier to match content with the audience's preferences.
3. Engagement
Engagement is the best indicator of your content performance. It shows which page posts, formats, and creatives resonate with the audience. Metrics like Page Likes, Comments, and Shares give you more granularity in the overall engagement rate.
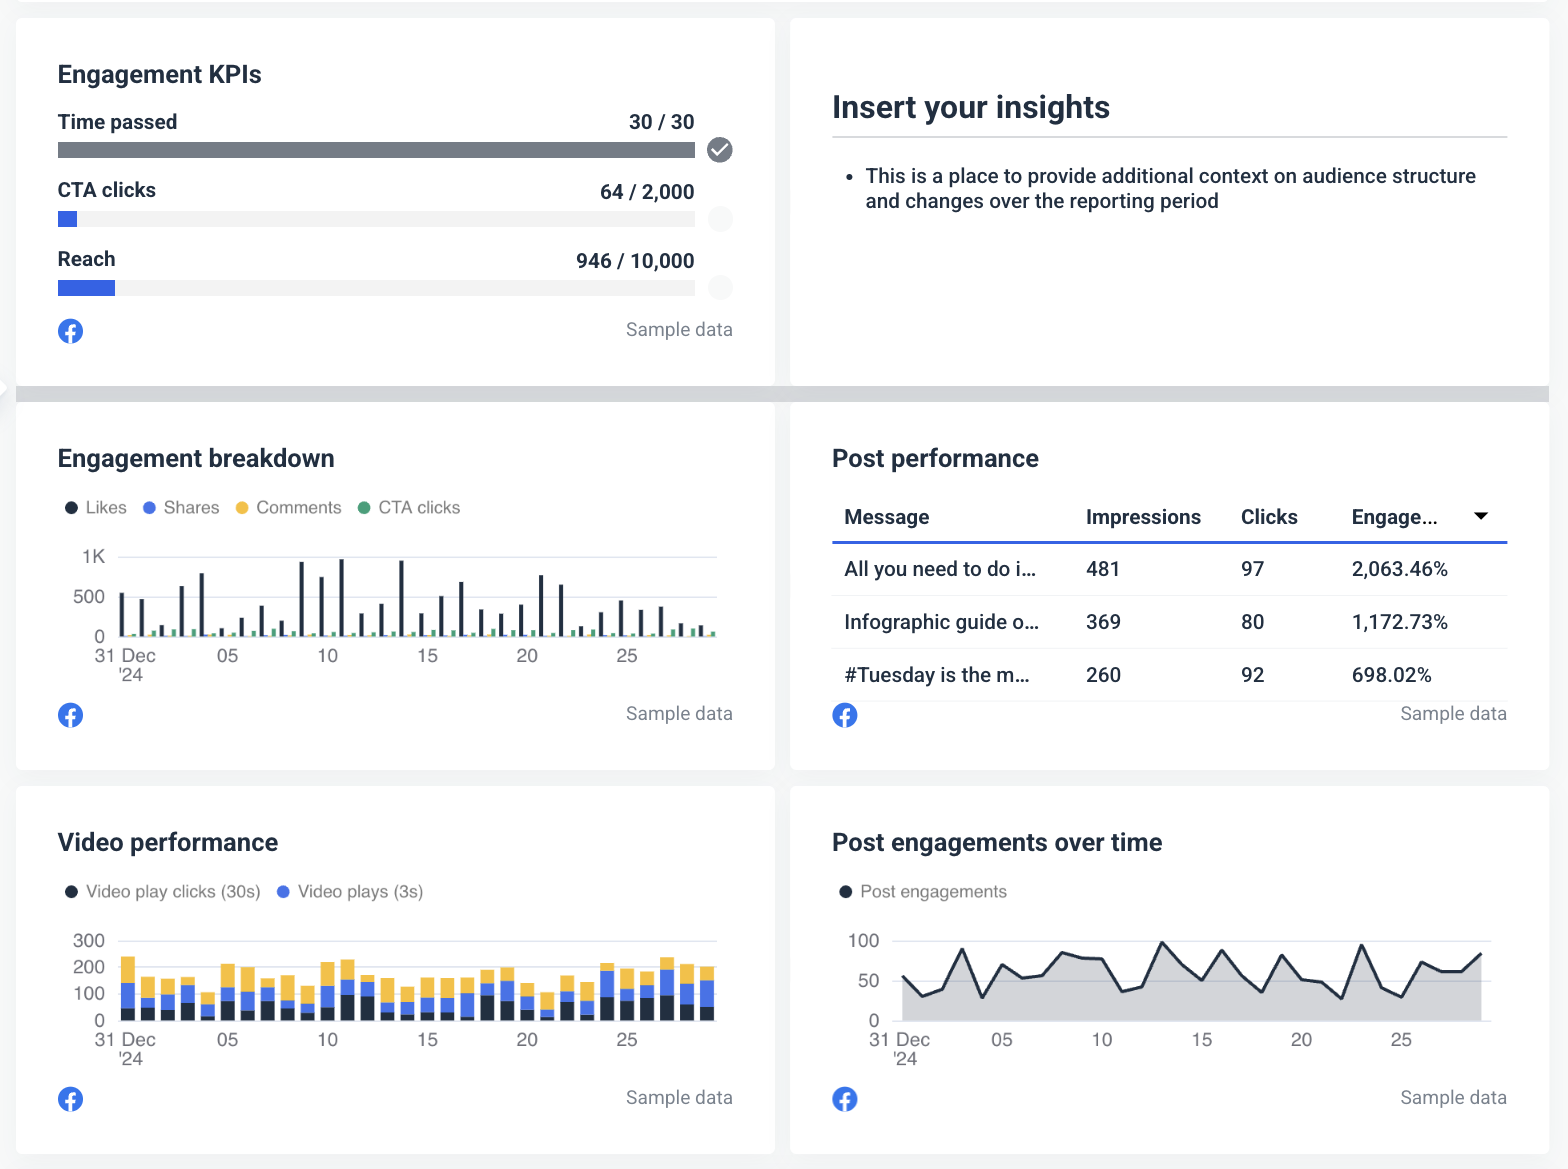
The most important engagement metrics to include:
- Total Engagements – Sum of likes, shares, comments, and clicks.
- Engagement Rate – (Engagements / Reach) x 100 – Measures content effectiveness.
- Shares – How many times content was shared.
- Comments – Helps measure audience involvement and discussion.
- Reactions (Like, Love, Wow, etc.) – Shows audience sentiment toward content.
- Post Clicks – Total number of times users clicked (links, images, or “See More”).
For example, you can see whether videos, reels or static images work best.
On the other hand, if a specific post underperforms, you can make adjustments in near real time.
4. Creative and Content Analysis
This section helps clients understand which visuals, messaging, and content types drive the most engagement and conversions. By analyzing creatives side-by-side, you can spot the top-performing formats and styles.
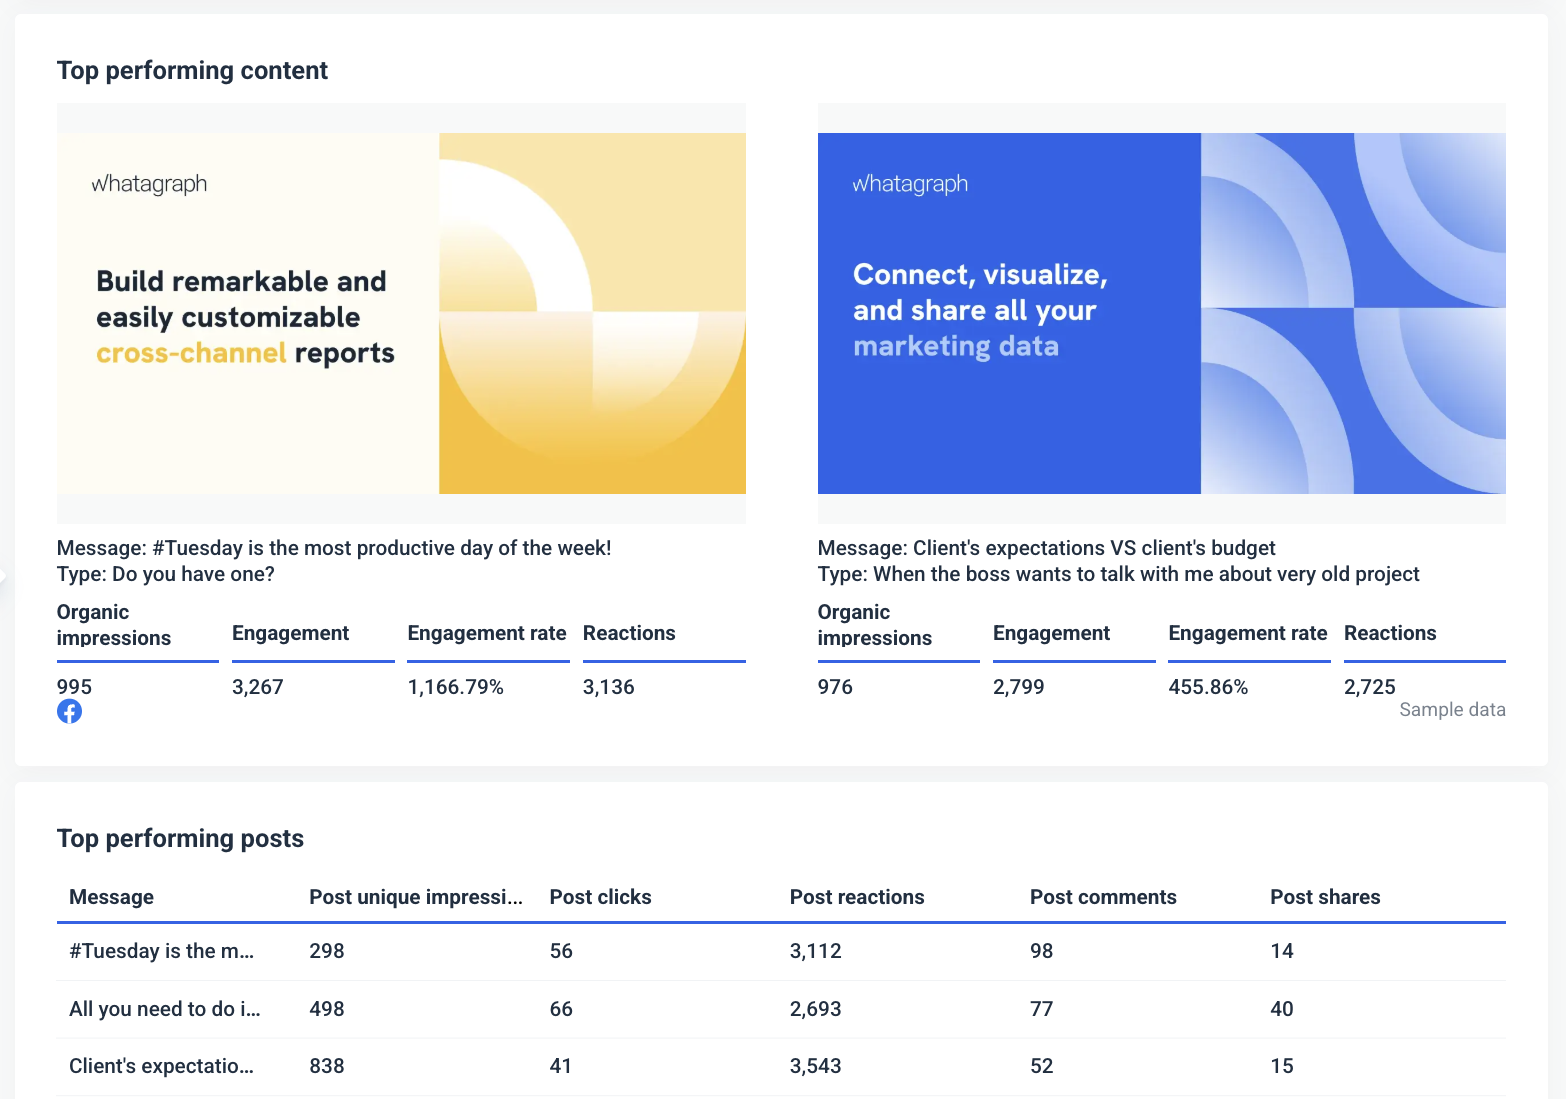
Whatagraph’s media widgets — a great way to bring the spotlight on your client’s post performance.
5. Conclusions and Next Steps
After the Executive Overview, this is the section where most clients spend the most time.
Busy CEOs will go straight for the takeaways.
However, these actionable insights often take the most time to create.
For example, if your client has 50 Facebook business pages, summarizing the next steps will probably take longer than developing a social media strategy.
Luckily, Whatagraph makes writing summaries, wins, and recommendations a breeze.
How?
By using AI to analyze report data.
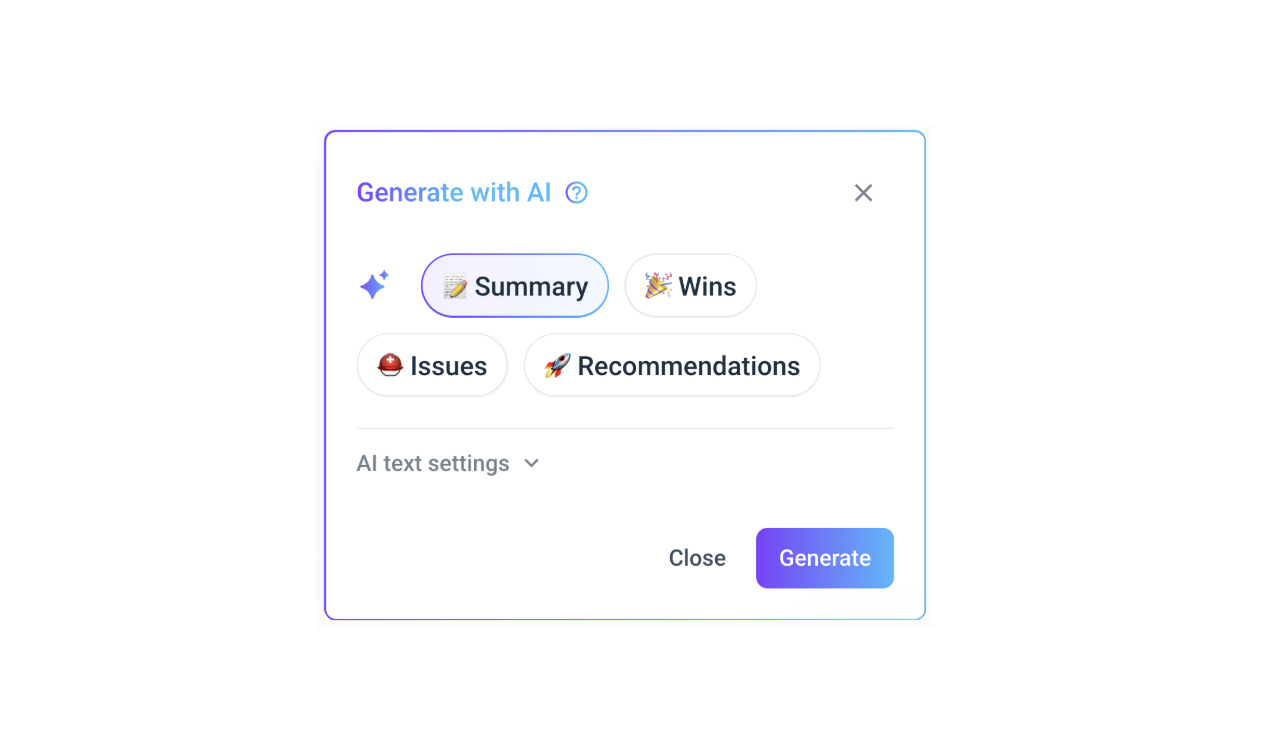
Instead of writing summaries yourself, you can generate AI report summaries and add them to your reports using our Text widget.
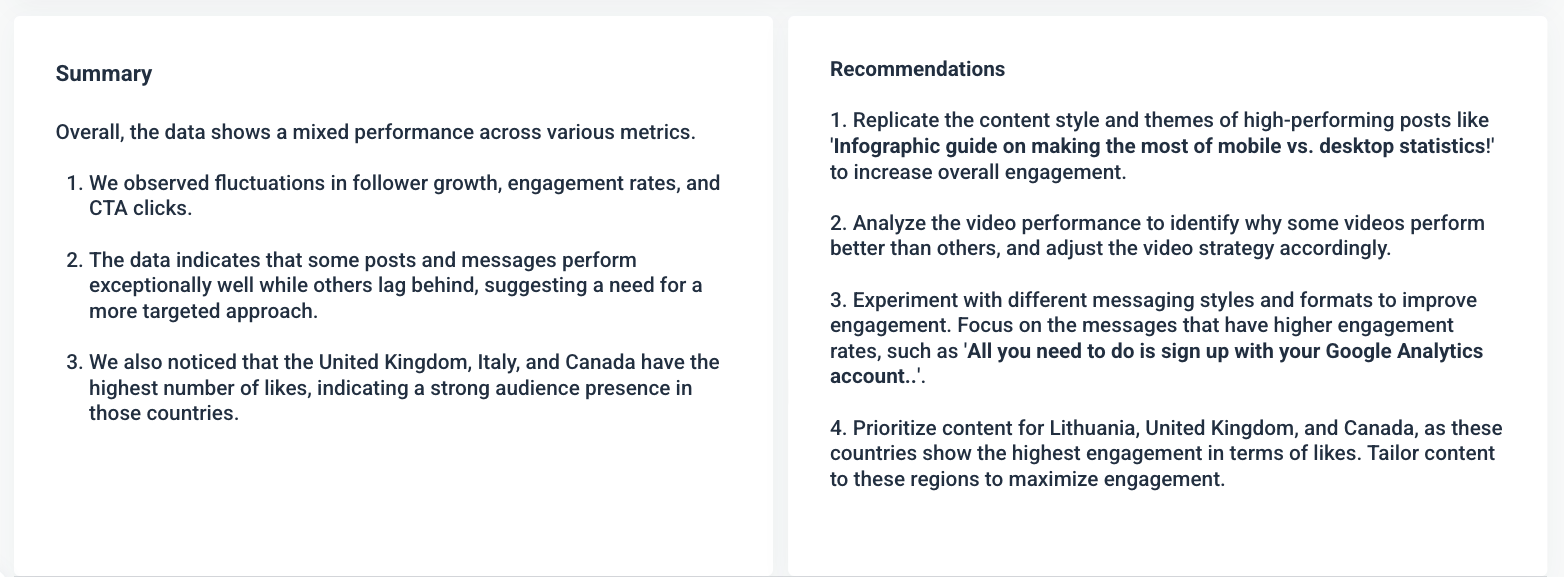
If needed, you can also edit the AI summary to add more granular insights or personal comments.
Want to learn more? Book a call and tell us exactly how we can help you.
Published on Jan 31 2025
WRITTEN BY
Nikola GemesNikola is a content marketer at Whatagraph with extensive writing experience in SaaS and tech niches. With a background in content management apps and composable architectures, it's his job to educate readers about the latest developments in the world of marketing data, data warehousing, headless architectures, and federated content platforms.