How to Choose The Best Reporting Solution For Your Marketing Agency?
With so much client data pouring in from various sources, no marketing agency can afford to waste time creating Excel reports or PowerPoint slides. In fact, reporting platforms have become so vital for agency decision-making that choosing the right might make a difference between growth and opportunities missed.

May 31 2023 ● 5 min read
- What is a reporting platform?
- Top 8 features to look for in a reporting solution for agencies?
- 1. Engaging data visualization
- 2. Drag-and-drop report builder
- 3. Both interactive dashboards and static reports
- 4. Live reporting
- 5. Plenty of integrations
- 6. Out-of-box templates
- 7. Usability
- 8. Pricing
- Conclusion
What is a reporting platform?
A reporting platform is software that allows users to analyze and format data from multiple sources with the purpose of presenting the insights as reports or dashboards. This makes reporting solutions essential for marketing agencies that need a quick and hassle-free way to bring-data driven decisions and present their efforts to clients.
Since the advent of cross-channel reporting platforms, marketing teams don’t have to manually collect and stitch marketing data. Instead, they use reporting tools to generate various reports, depending on the client’s needs, such as SEO reports, social media reports, performance reports, etc.
A big advantage of marketing reporting platforms is that most allow a high degree of customization. This way, agencies can create reports based on precise metrics and queries that clients request and make them visually appealing with bespoke layouts, colors, and branding.
Top 8 features to look for in a reporting solution for agencies?
The market is boiling with reporting applications that each fight for their share of users, so it’s challenging to pick the right one. Here are the most important features to look for in a reporting platform.
1. Engaging data visualization
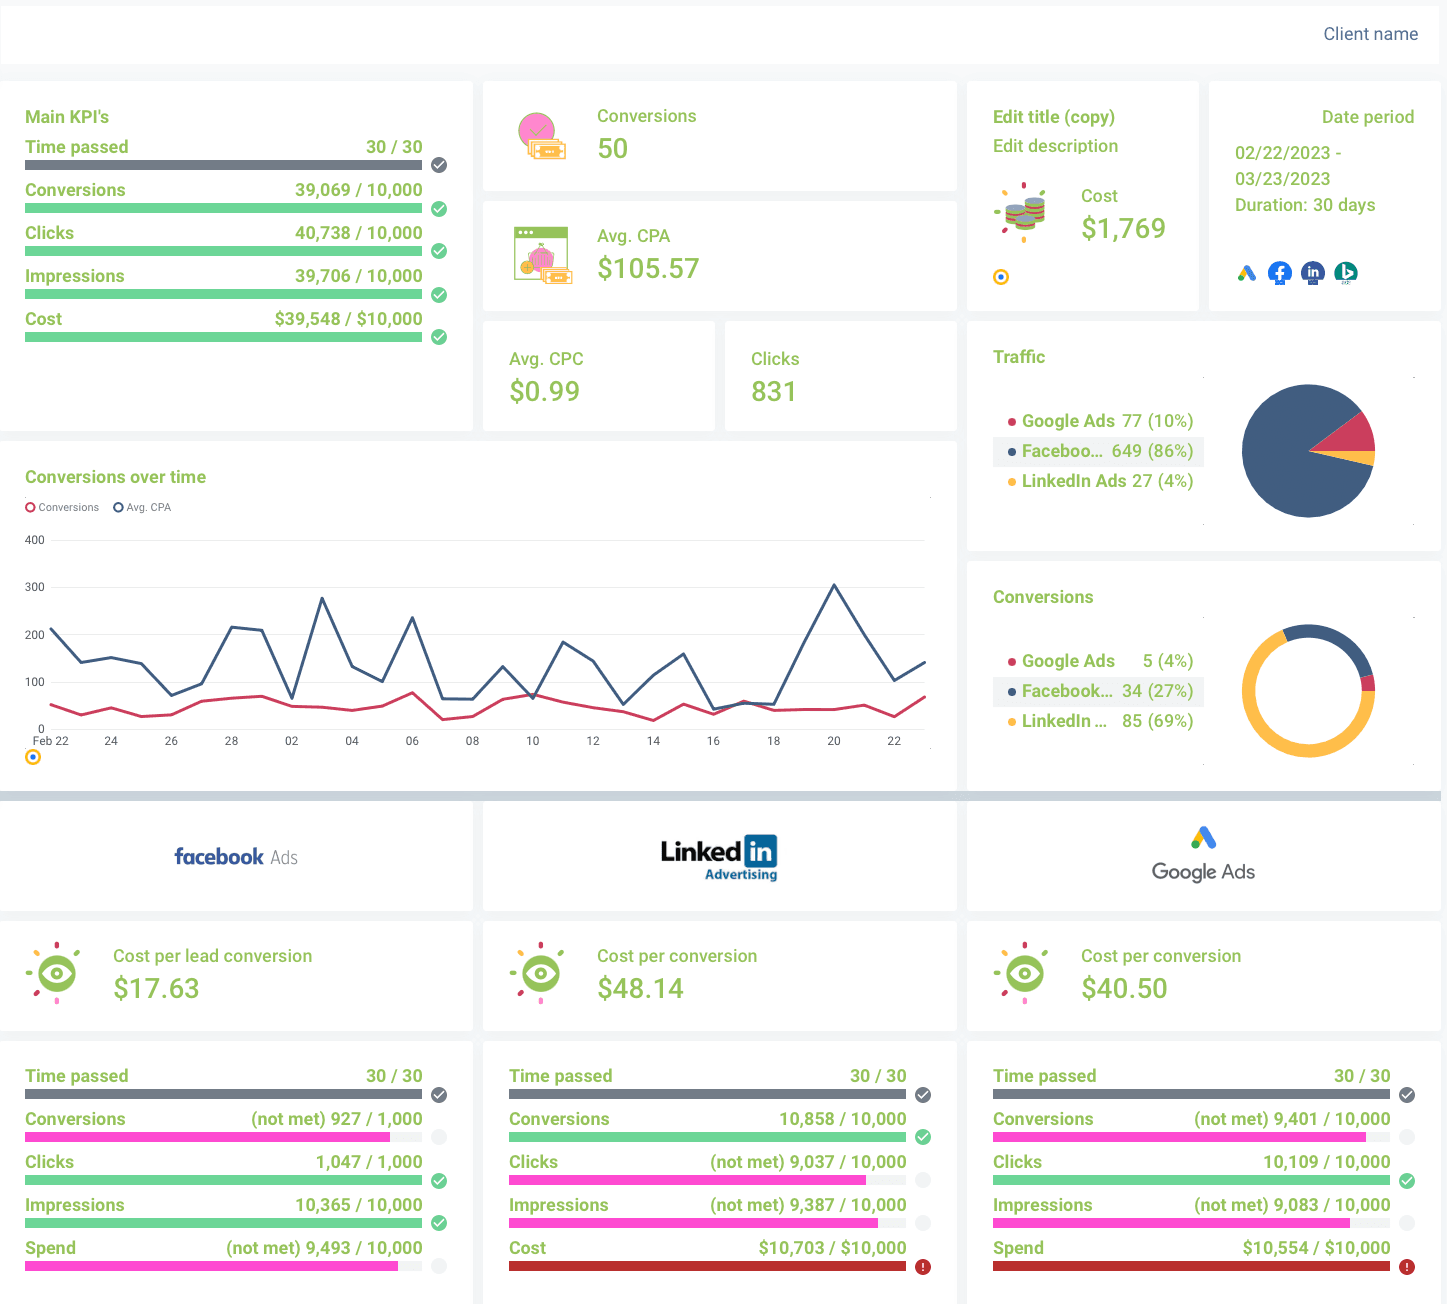
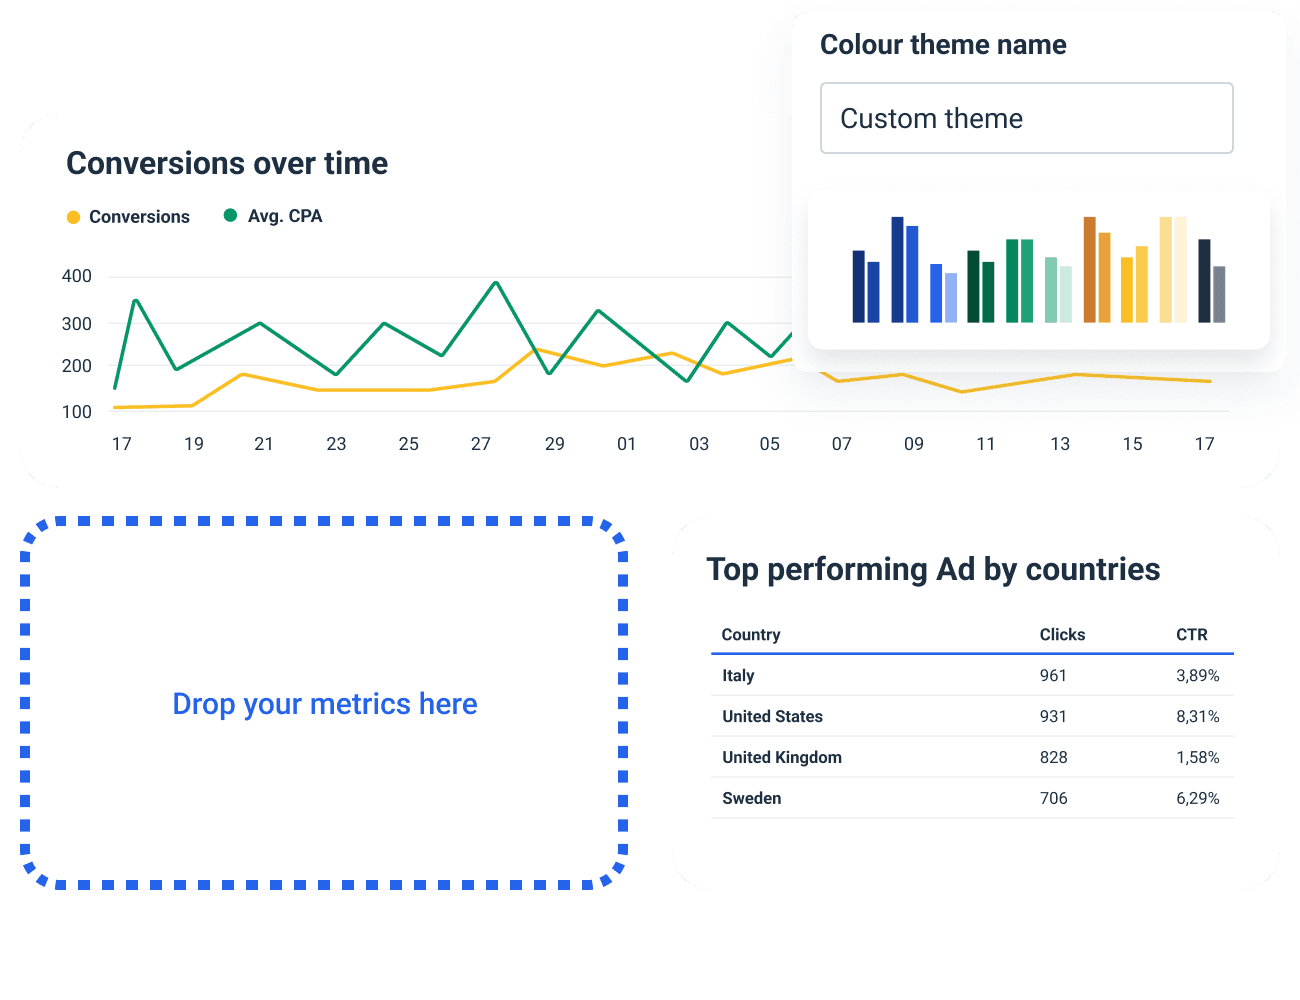
A solid reporting platform should be able to provide you with actionable insights at a glance. Whatagraph, for example, allows users to add different kinds of graphs, charts, gauges, and tables in the form of drag-and-drop widgets that are easy to insert, remove, rearrange, or edit their dimensions.
This is important because clients and agency teams may have different ideas about visualizing their data. The more visualization options available, the more flexibility.
The reporting software you choose should be able to present customer marketing data in pie charts, line graphs, scatter plots, data maps, and timelines, among others. With plenty of visualization options, it’s easy to pick the best one for the metrics at hand.
2. Drag-and-drop report builder
When you use data software to create client reports, you should be able to easily add components. Remember that your team members have plenty of other tasks to do apart from reporting, so there’s no time to spend on intensive onboarding. In other words, a reporting platform should be intuitive to set up and easy to use. The product you choose must have a drag-and-drop feature so everyone can easily integrate data sources, select visualization models, and other customizations.
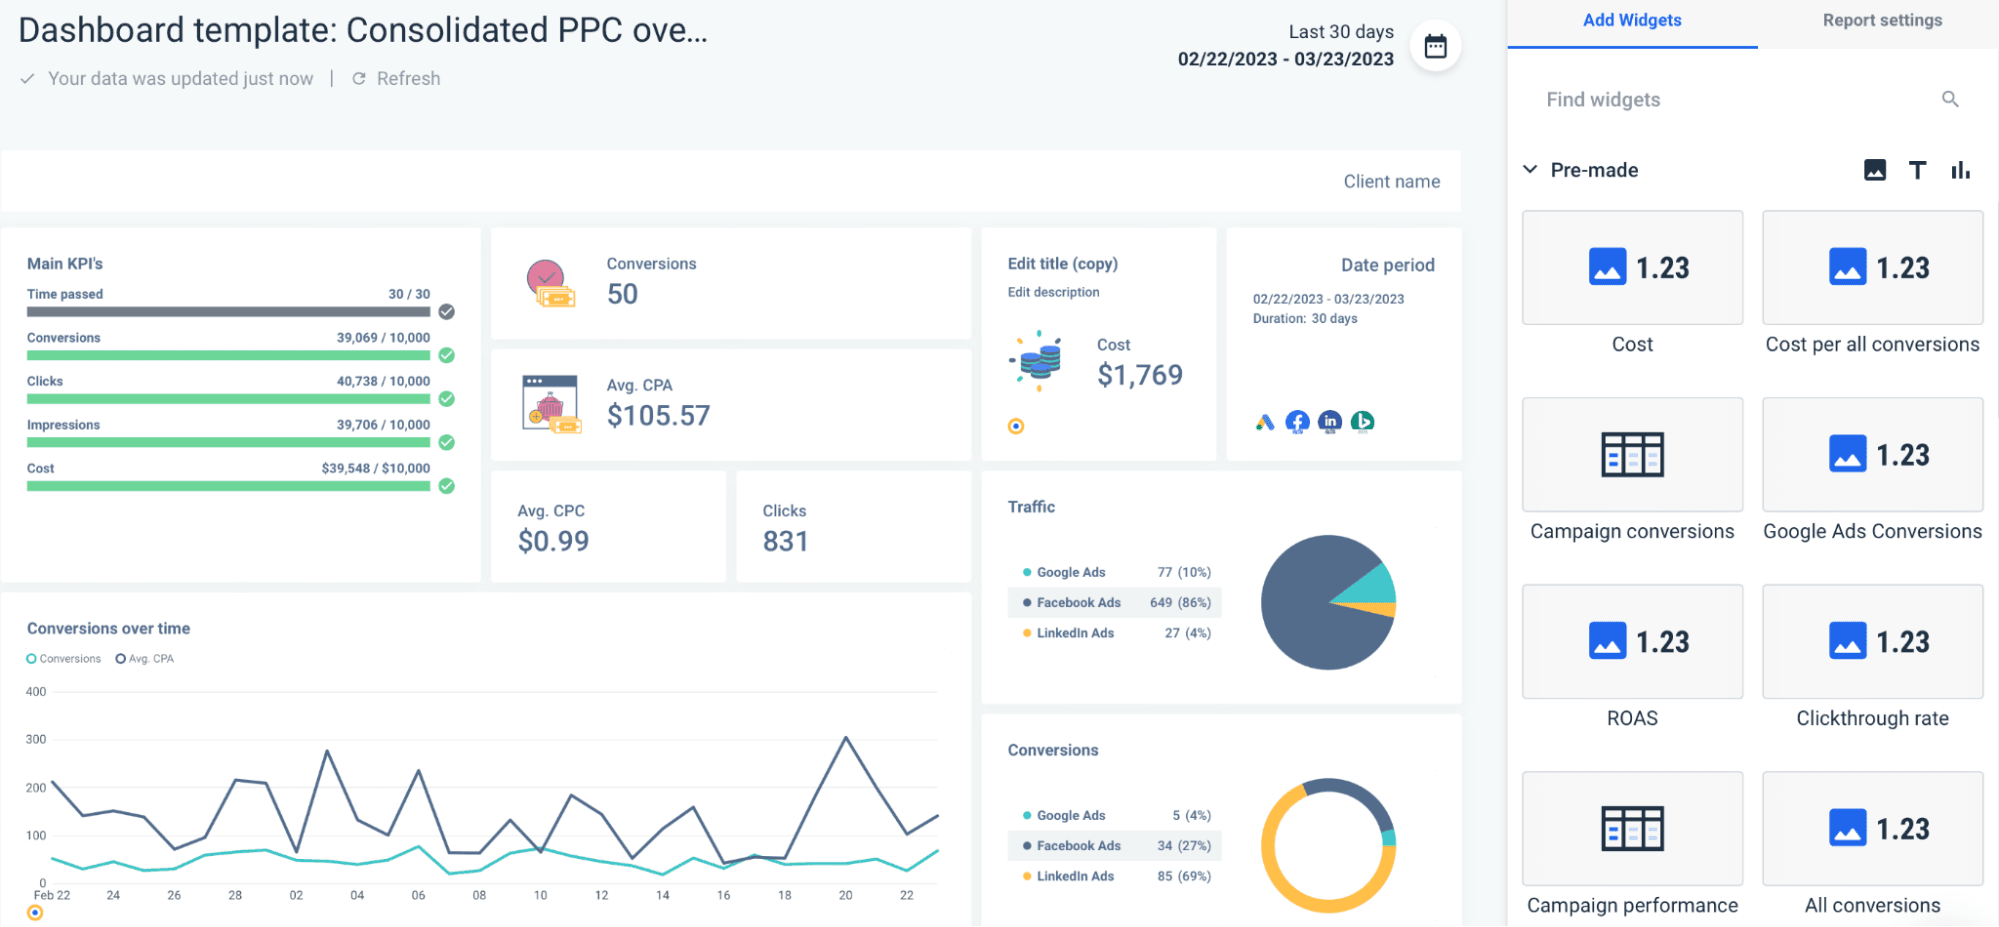
If your team can drag and drop different visualization elements, there’s no need for report-building training, and once every widget is in place, it’s easy to populate the report with source data.
3. Both interactive dashboards and static reports
A dynamic dashboard is the pinnacle of agency reporting. The platform you choose must be able to create interactive dashboards so that your team can use different filtering options to glean the information they need and present it to clients.
Multi-channel dashboards also allow agency teams to observe the data from different angles and provide business intelligence, essential for data-driven decision-making.
Static reports provide data from a given moment in time, making them useful for discussing campaign performance over a month or month or project development.
These reports can be shared as attachments, either as image files, presentation slides, or PDFs. And this is why static reports are so versatile for agencies — even in today’s digital world, some clients exclusively ask for printable PDF reports.
4. Live reporting
A live real-time dashboard is able to provide the most updated information possible, which is vital for clients that need fresh data to make informed decisions.
With accurate and updated data, every team member can be on the same page because they have access to real-time data. A live report helps evaluate statistics and performance and reduces workflow delays.
If you get a reporting tool that provides real-time insights, you can deal with any issue on time and advise the client to adjust the goals and plans for the future.
5. Plenty of integrations
You can have the best reporting interface in the world, but it doesn’t mean much outside a connected ecosystem of different marketing platforms.
The reporting software you choose should be able to integrate with a variety of web analytics, SEO, social media, PPC, eCommerce, and other tools that can provide valuable insights into the client’s business. A capable marketing data platform can integrate with various other platforms and perform automated data collection and integration.
While choosing the best reporting platform for your agency, check out the list of integrations. As an agency, you can’t predict what apps your future clients will use, but just cover all the main marketing platforms, like social media, paid ads, social media, CRMs, etc.
Whatagraph has native integrations to over 45 digital marketing tools, which is a more reliable solution than reporting tools that use 3rd party connectors to connect their visualization function and various marketing apps.
6. Out-of-box templates
Even with a drag-and-drop builder, writing a report from scratch is challenging, especially if you’re short on time. In those cases, a report template is a day saver. If your reporting platform comes with pre-loaded templates for different report types, just pick one and start reporting.
Whatagraph report templates are highly customizable, allowing users to rearrange, add, or remove each visual widget, as well as change the color scheme to match the report to your or your client’s branding.
You can make the report more engaging and appealing to clients by including cover images of the top-performing campaigns or ads.
Every report can be further personalized by including blank widgets where you can enter your personal comments and insights about the actual report.
Finally, to make each report more professional, Whatagraph allows you to white-label each report, and remove the company logo or replace it with your own.
7. Usability
The marketing reporting platform that you choose for your agency will see a lot of use, so before making the pick, ask for a trial account so your team members can try it and check its features. The trial period of two weeks should tell if:
- The interface is user-friendly.
- The reports are easy to create
- Non-technical users can wind information they need
- The marketing reporting platform integrates with the tools you already use
- The automated report sharing works well
8. Pricing
Finally, the reporting platform you settle on must be within your budget. Still, looking at how much different platforms cost, you also need to include what you’re getting out of it.
A marketing data platform that lets you connect, visualize, and share data from your client’s various marketing channels is always more valuable than a simple reporting tool.
Conclusion
As a marketing agency, you need to choose a marketing reporting platform that will save you money in the long run, retain clients, and unlock time and workforce they would otherwise be used for manual reporting.
Whatagraph caters to marketing agencies by providing an integrated marketing data platform for collecting, visualizing, and sharing marketing data that helps agencies automate their reporting operations.
Thanks to the intuitive user environment and drag-and-drop report builder, Whatagraph allows you to quickly create new reports and schedule automated sending to a list of desired addresses.
But there’s no need to build a report from scratch for established marketing KPIs. Whatagraph offers an extensive library of beautifully designed report templates. The only thing you need to do is connect the client’s accounts and the report or dashboard automatically populates with the latest metrics.
You can further edit the templates, add, remove, and reorganize visual elements, as well as change the color schemes and branding. By removing Whatagraph’s logo and adding your branding, you can even sell the reports as your own.
Here you can find more tips on how to use marketing reports as a new source of revenue.
Published on May 29 2023
WRITTEN BY
Nikola GemesNikola is a content marketer at Whatagraph with extensive writing experience in SaaS and tech niches. With a background in content management apps and composable architectures, it's his job to educate readers about the latest developments in the world of marketing data, data warehousing, headless architectures, and federated content platforms.