How to Build a Custom Report Dashboard for Social Media
Just doing great work as a marketing agency is not enough. Communicating that work to your clients is sometimes even more important. And unfortunately, social media can be complex and building a great social media report can take a while.

Feb 23 2022●8 min read


Even though there are tools to make this job easier, there are also some factors to consider before creating an in-depth and custom report for social media. Let's not waste any more time and get started with the guide on how to create your own custom dashboard for social media.
Set Your Social Media Strategy’s Goals/Channels/Metrics
Before you start creating a social media report, you need to come back to your marketing strategy’s goals and determine the benchmark for good social media performance.
Goals can range from raising brand awareness to improving customer satisfaction to increasing sales and traffic. But the most important thing about these goals is how you approach them, and you should do that with a SMART model. In other words, your digital marketing goals should be:
- Specific
- Measurable
- Achievable
- Relevant
- Time-Bound
Then, identify the social networks that will assist you in achieving your objectives, whether it’s for you or your client.
- Where is your client’s target audience based?
- Which ads are most appropriate for you, Instagram/Facebook/LinkedIn or all?
- Which channels will help you generate more traffic to your website?
Ask yourself various questions to determine and prioritize the impact of each social media platform on your strategy and marketing campaigns.
Lastly, you need to define the success metrics that would validate your social media marketing strategy.
If you aim to increase the click-through rate (CTR) by 20% in a given quarter, then you can include the percentage of CTR you’re aiming to get.
When choosing your social media metrics, be wary of vanity metrics. These metrics appear essential but have no intrinsic value to you or your client. For example, likes and shares are nice to see when they’re growing but they really make no impact on a client’s bottom line, regardless of the demographics behind those figures.
Success metrics vary by team, goals, industry and client's need but here are some key performance indicators to include in your report:
- Conversion rate
- Return on ad spend (ROAS)
- Number of leads generated
- Social share of voice (SoV)
OK, now we are ready to talk about reports. First, let’s cover the tools that help to create modern, visual and custom social media reports.
Use a Social Media Reporting Tool
It is a good idea to create manual reports using Google Analytics or the excel-like Looker (formerly known as Google Data Studio). You most likely developed your own system and process, are familiar with its in and outs, and are unwilling to invest in something more modern. But what we suggest you do is simply learn about other options.
One of those options is reporting tools. They do the following:
- Save time
- Store your marketing data
- Track real-time data
- Allow you to customize your reports
- Use data visualization elements
- Provide automatic data updates
- Allow marketers to manage multiple channels at once
For example, Whatagraph, a leading social media data reporting tool, can customize not only interactive reports but also white-label and automate them.
Whatagraph users can save 40 hours per month for your marketing team just by allowing AI to pull data, aggregate it and visualize it. Imagine how much more time is being saved by sending automated reports to show your marketing efforts.
Whatagraph also went above and beyond to provide more than 90 pre-made good-to-go report templates, half of them being just for social media.
Social media reporting tools - what are your choices?
Do you know what sets Microsoft Excel and Looker apart from Whatagraph? Customer service. You can’t get that with those tools. Whatagraph is committed to assisting marketers in creating the best social media reports, resolving any bugs, and providing first-rate service.
You could also consider Tableau to track your social media performance metrics. They provide data blending, good customer service, and data visualization. They also offer 60 integrations, predictive analysis and forecasts. However, they lack both white-label and automation features for your social media campaigns.
Lastly, take a look at Databox. They do offer white-label, customization and even automation. They also provide more than 200+ analytics dashboard examples and 70+ integrations. However, if you want to customize your report, Dababox might not be it, as this feature is extremely limited.
Version 1: Choose a Report Template for Social Media
You now finally reached the first option of creating social media reports from a template. If you use a tool such as Whatagraph, there are plenty of templates available in our library.
Creating reports from a template is great because, at least in Whatagraph, the templates have all the essentials: key metrics, best widgets, and data sources.
It’s so easy to create a cross-channel social media report, or just a Facebook ads traffic report; you’re literally done in minutes.
Here is how to do it:
1. Create a Whatagraph account.
You will then be assigned an account manager who will show you how to use the social media reporting template; guide you with the most useful social media KPIs for your report, and offer you best practices for your reporting needs.
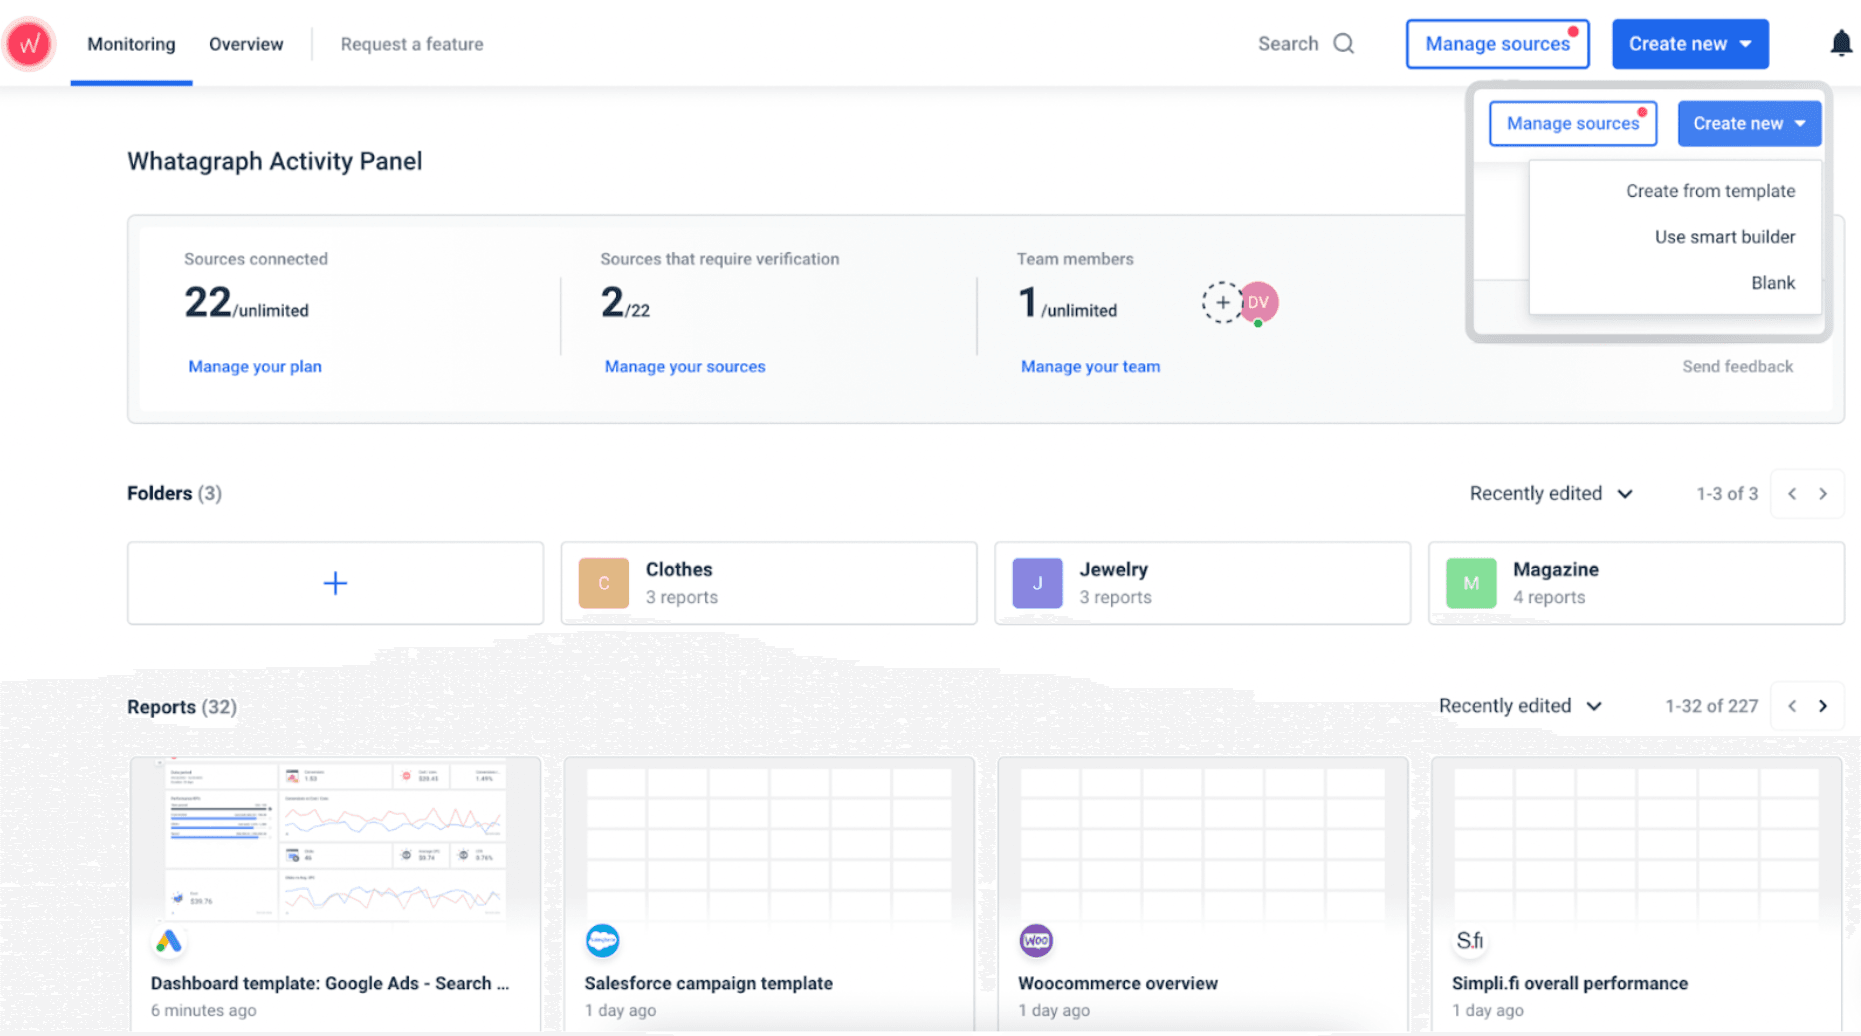
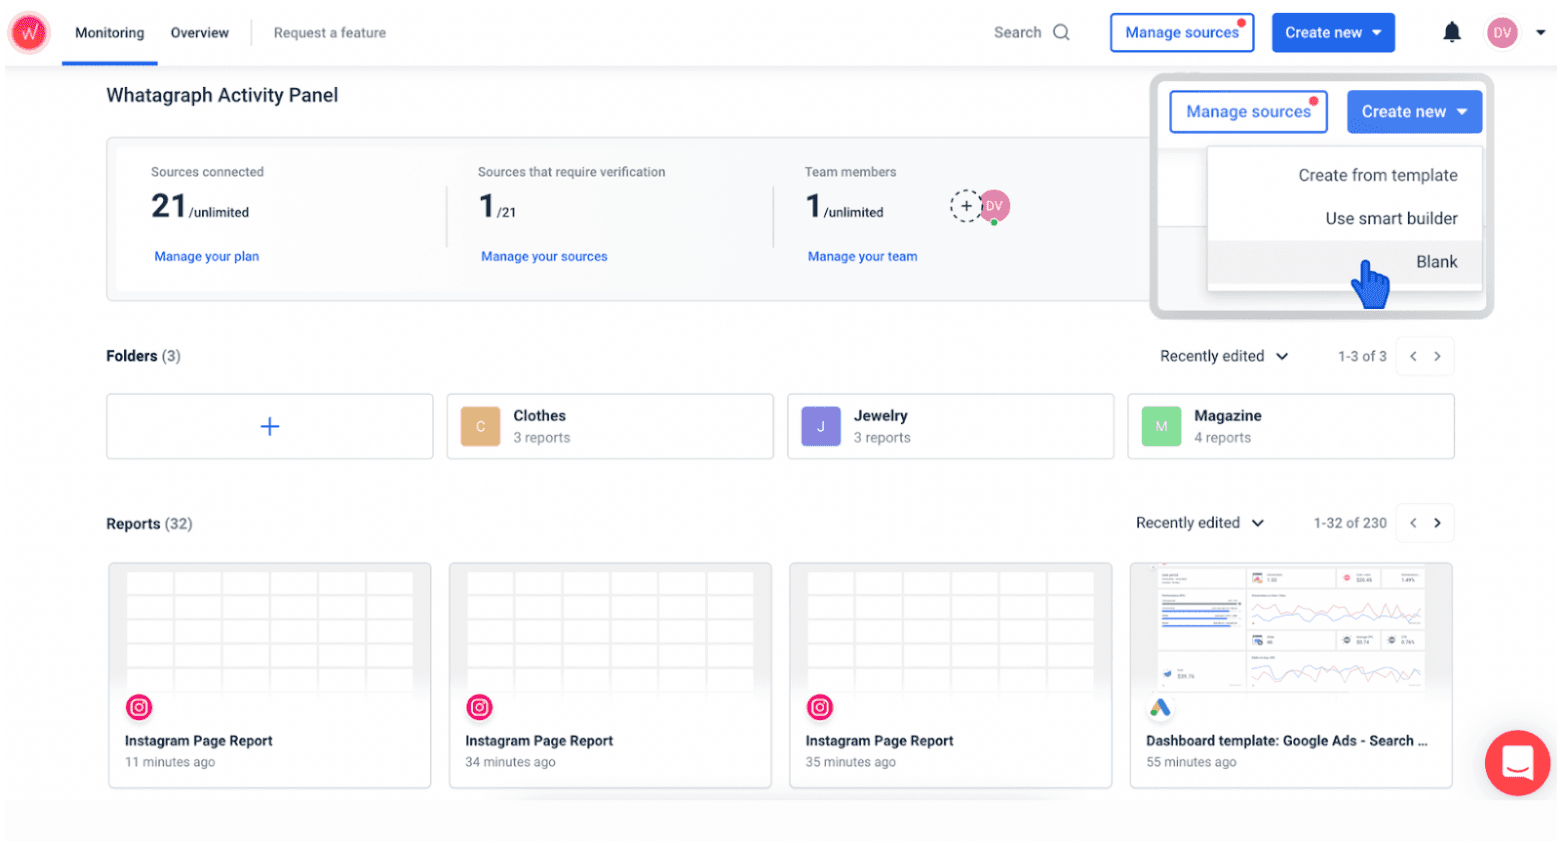
2. Press on the {Create New → Create from template}.
You should see this↓
Then an entire template library will be presented on your screen ↓
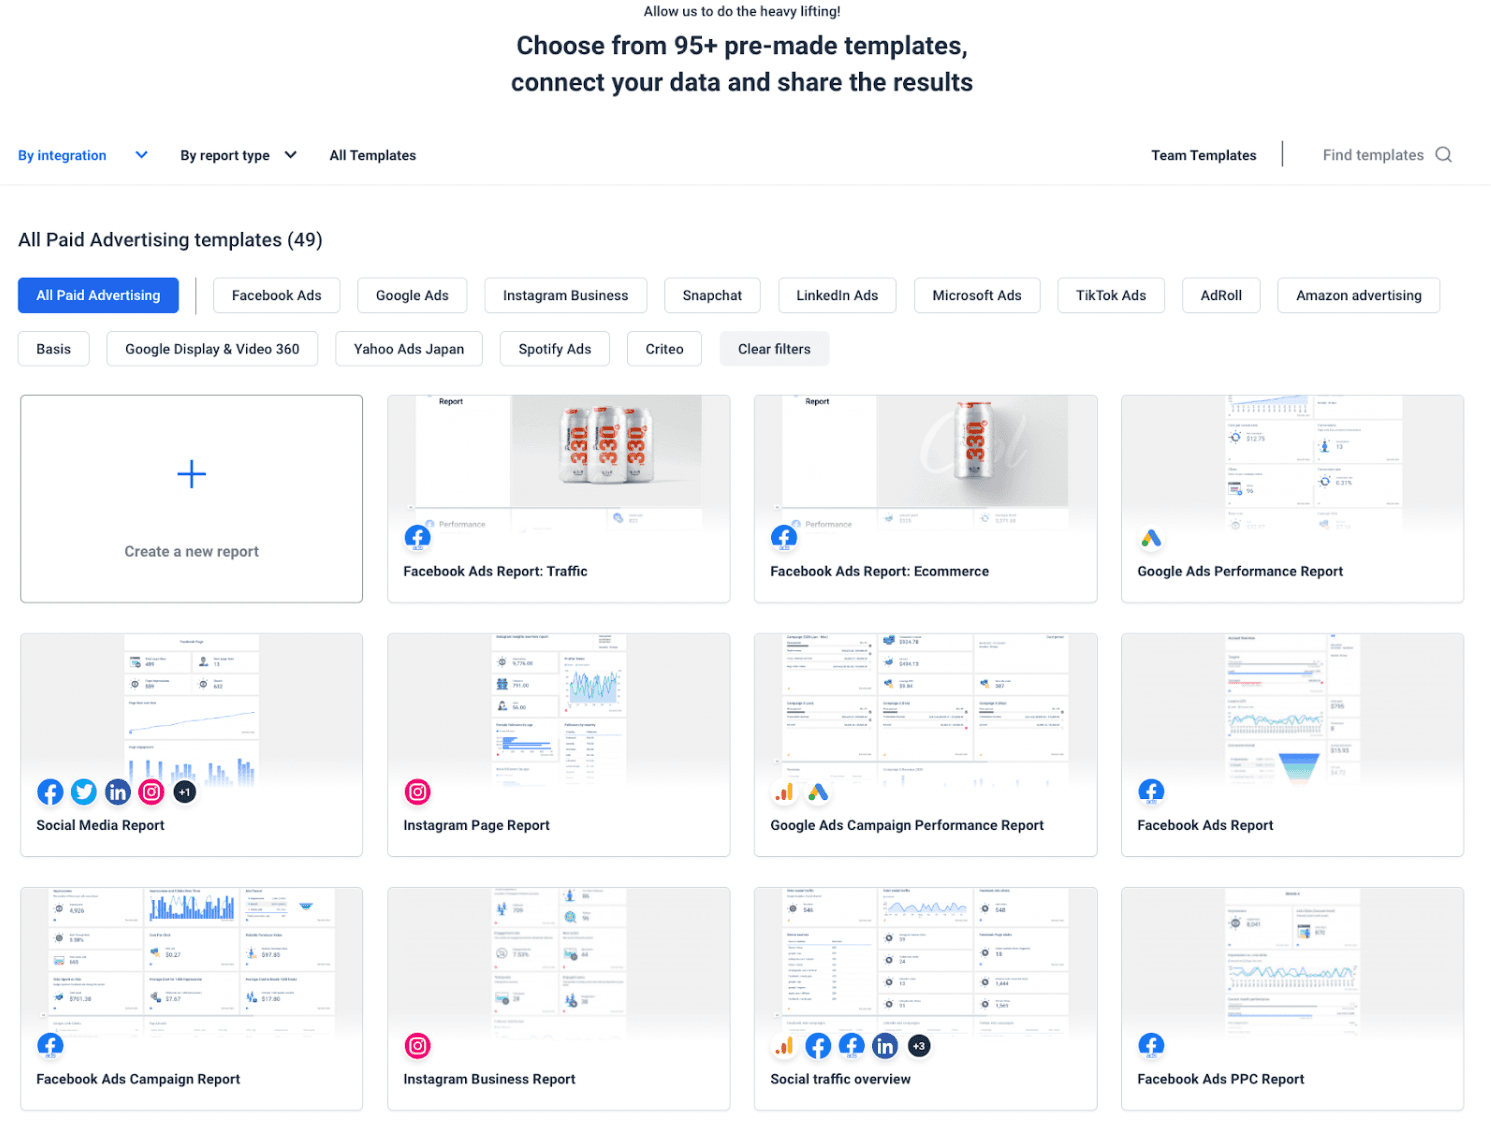
You can easily filter reports by integrations and type. As you can see above, we’ve filtered the report to ‘All Paid Advertising’ to see only the most relevant social media dashboard and report templates.
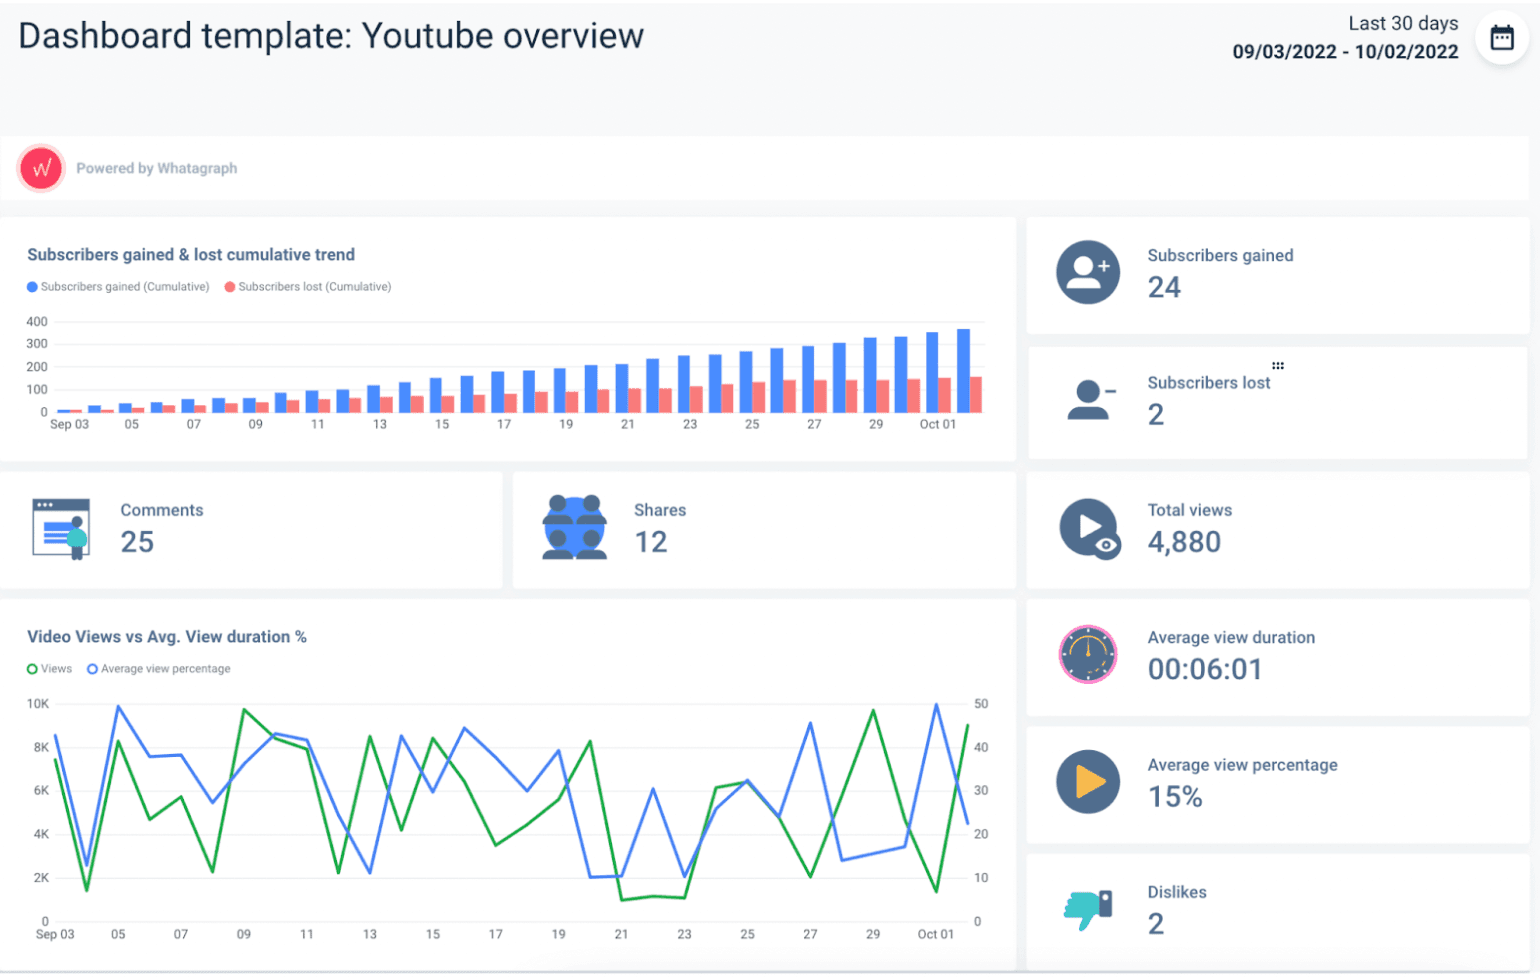
Example - Let’s say you want to create better content with Social Media analytics.
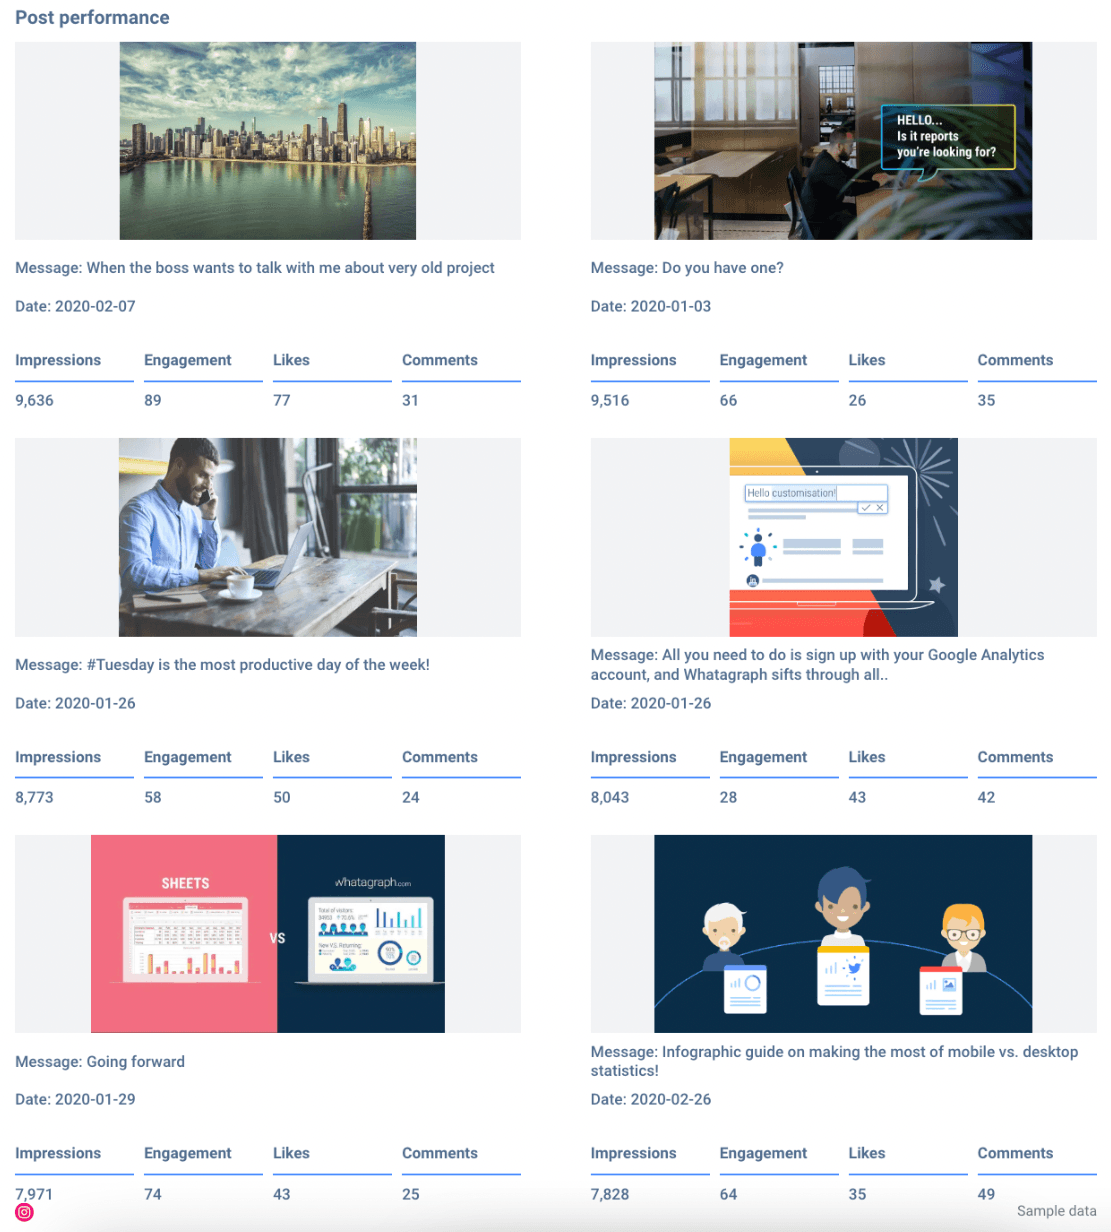
In Whatagraph, you can select any of the report templates, such as the Instagram page report.
This is what you’d get ↓
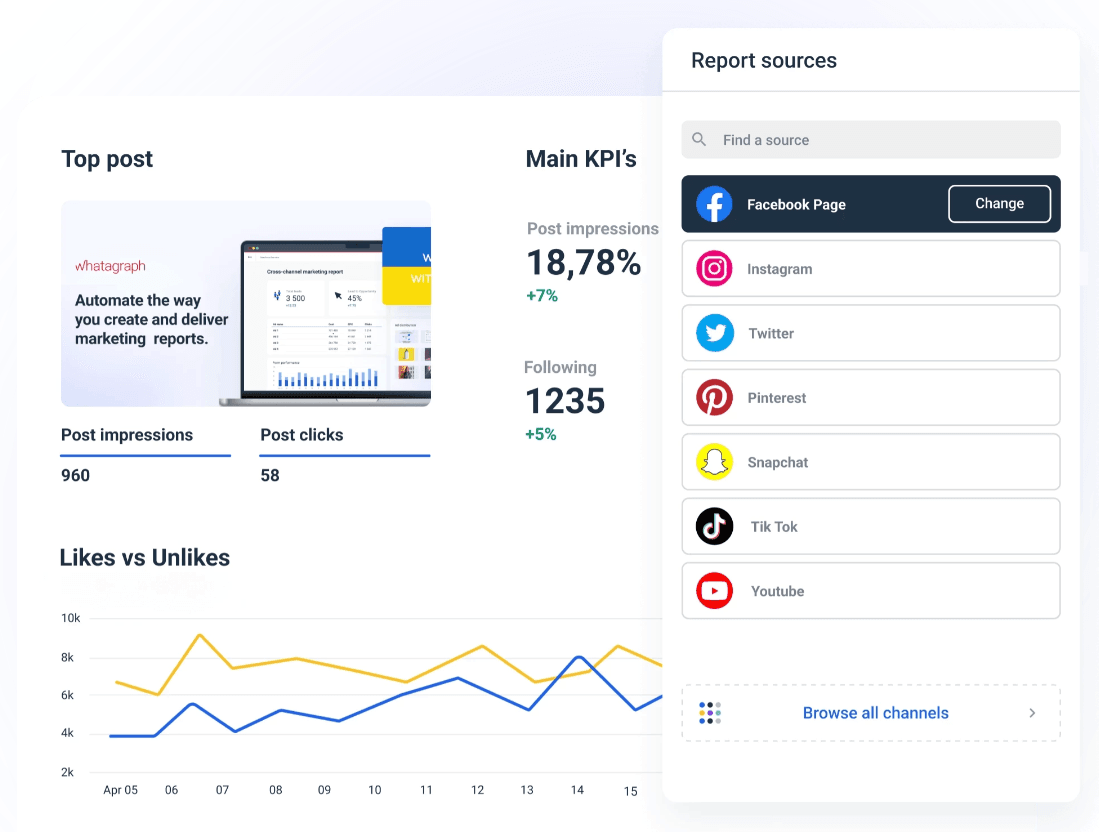
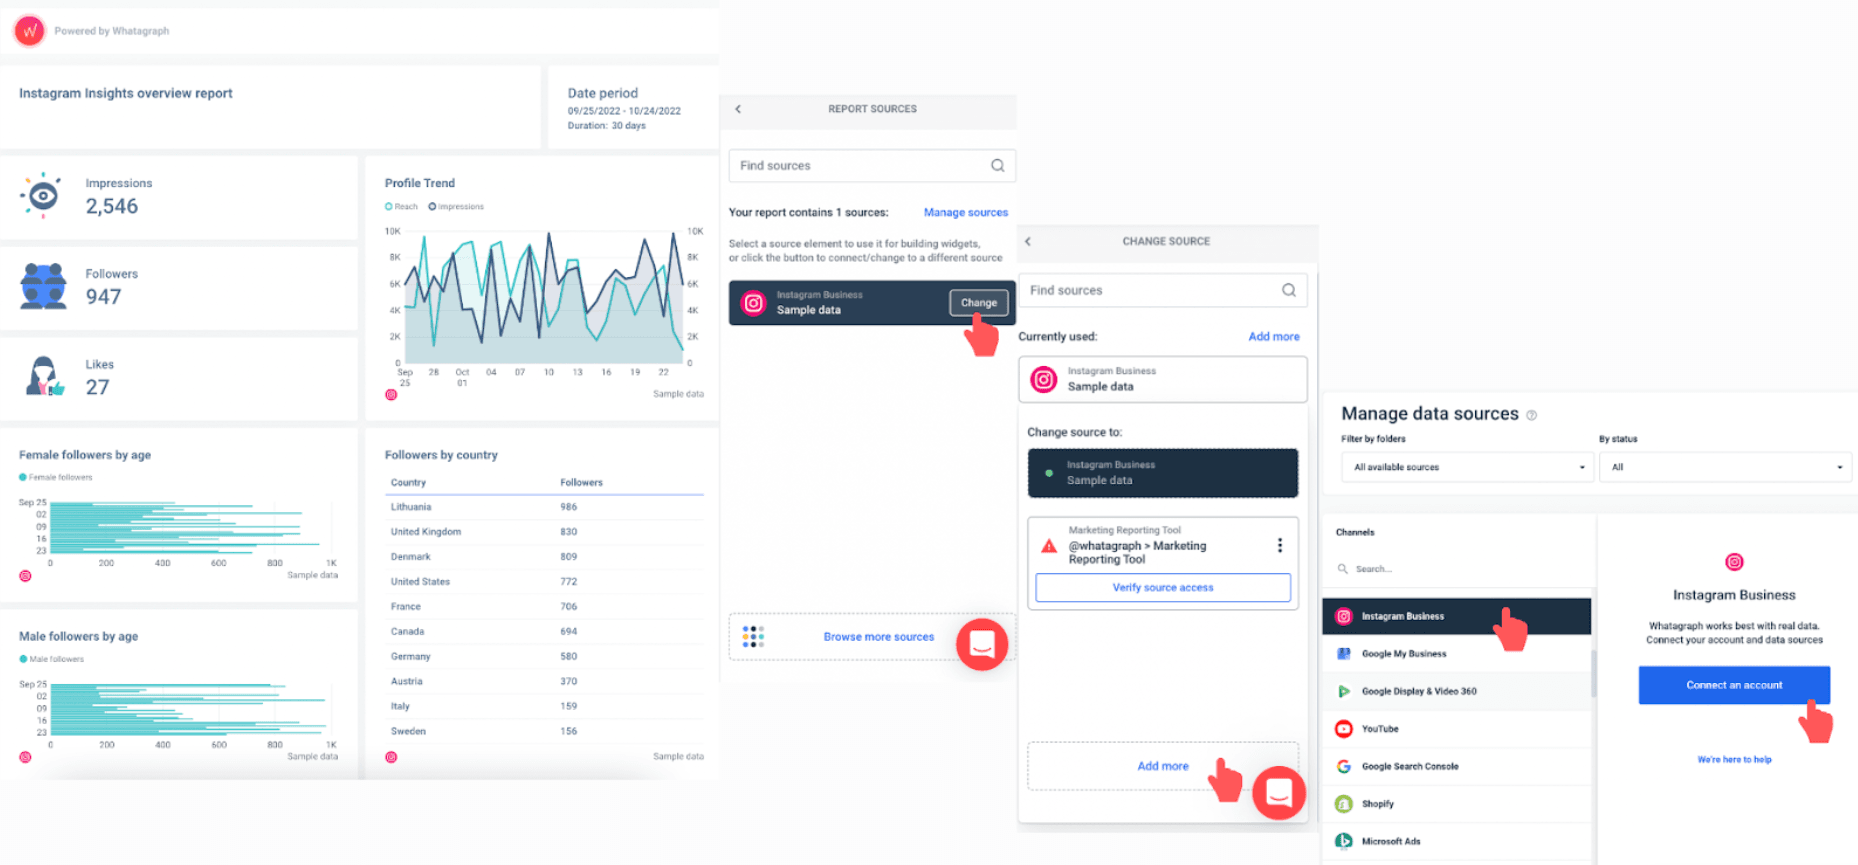
3. Connect your data sources.
The screenshot above shows sample data and you can easily change that by pressing Make changes → Sample data → Change → Add source → Connect any social media accounts.
Note that you can connect any or all of the 40+ data sources Whatagraph integrates with.
Here is how the flow would look visually ↓
That’s it; you’ve got the report.
Version 2: Create a Social Media Report From Scratch
We promise it’s not as bad as it may sound.
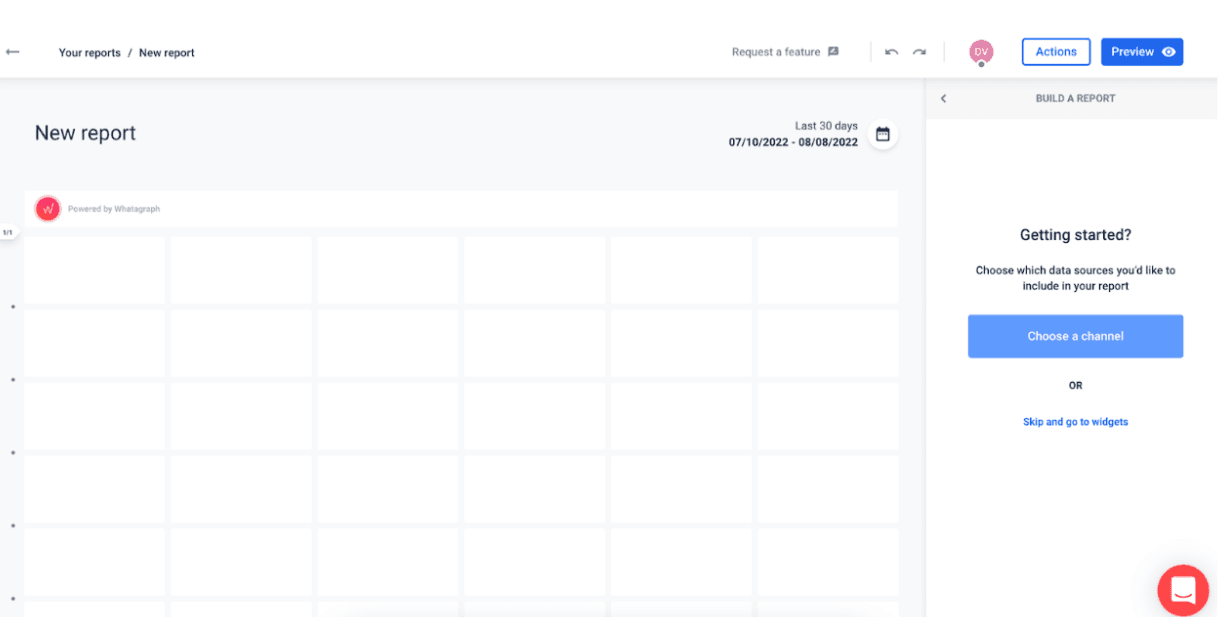
Creating a report from scratch in Whatagraph, simply means starting to develop a report from this blank page ↓
Here is a step-by-step guide to creating your report from scratch:
1. Create a Whatagraph account.
It’s as easy as signing up for a free trial.
2. Press on the {Create New → Blank}
You should see this↓
3. Choose a channel you want to pull data from.
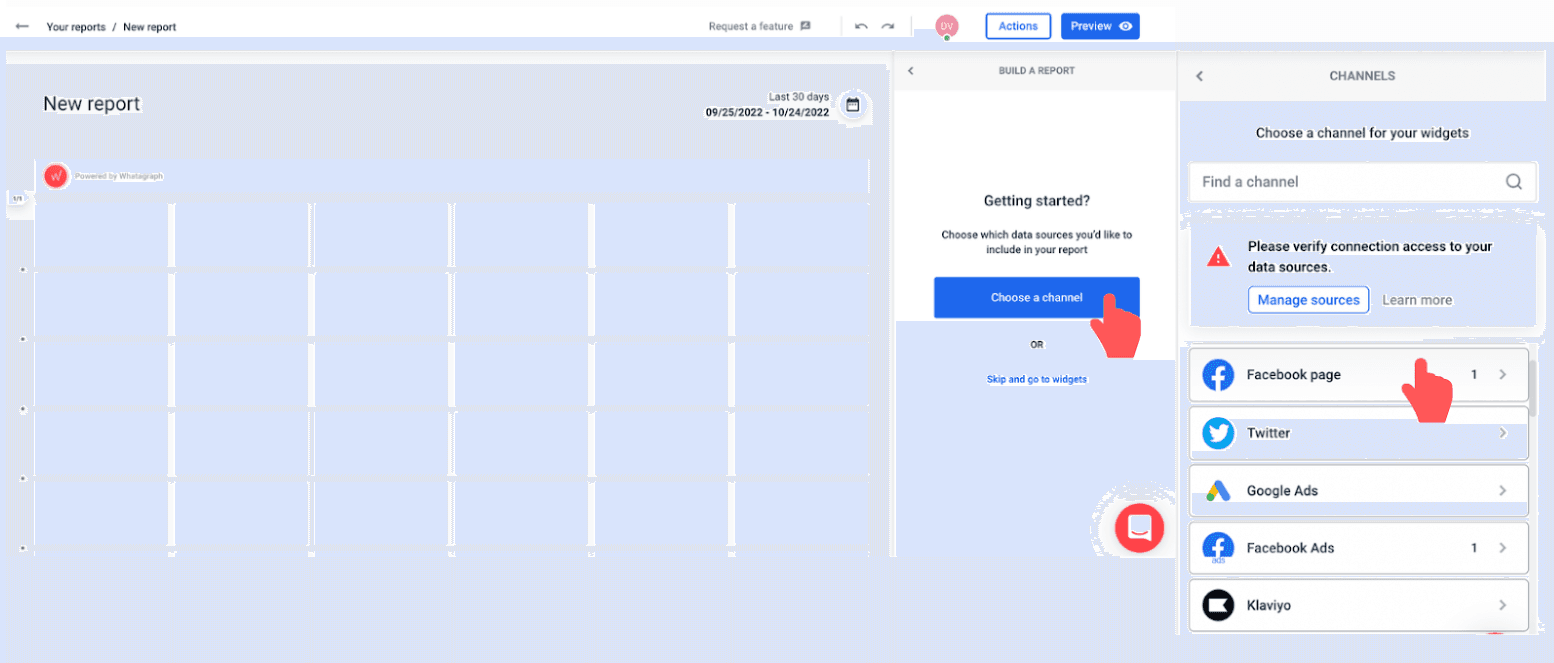
4. Drag and drop pre-made widgets.
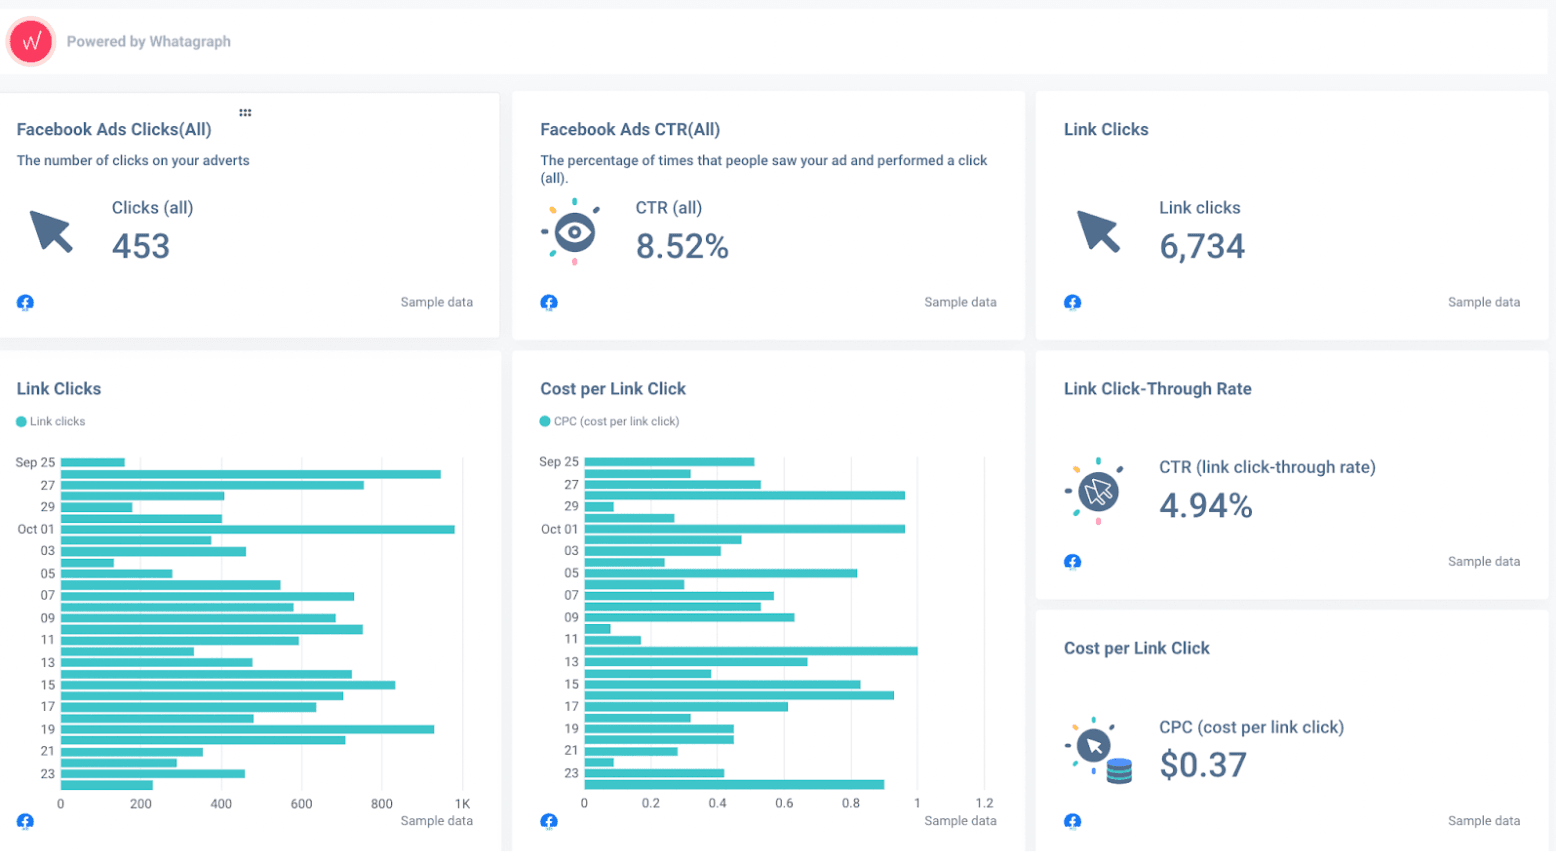
To do that, take a look at your SMART goals and metrics. This way, you’ll see the most relevant social media report.
If we continue to aim for a 20% increase in click-through rate (CTR), this is how our report would look ↓
5. Customize your report.
This step is optional but can be immensely useful. Change the theme, logo, domain, and fonts. You can easily change the report to match your or your client’s (however you need) business branding.
Pro tips:
- You can add widgets for different social media channels.
- You can create new widgets and new metrics formulas.
Set up Report Delivery
Lastly, set up report delivery.
Once you have developed the report you are happy with and are ready to send it to clients, social media managers, or your team members, follow these steps for an easy automation process.
1. Press on the {Action → Automate report}.
2. Choose sending frequency, delivery day and time, and time zone.
This info will depend on what you agree with your clients and your agency’s working hours.
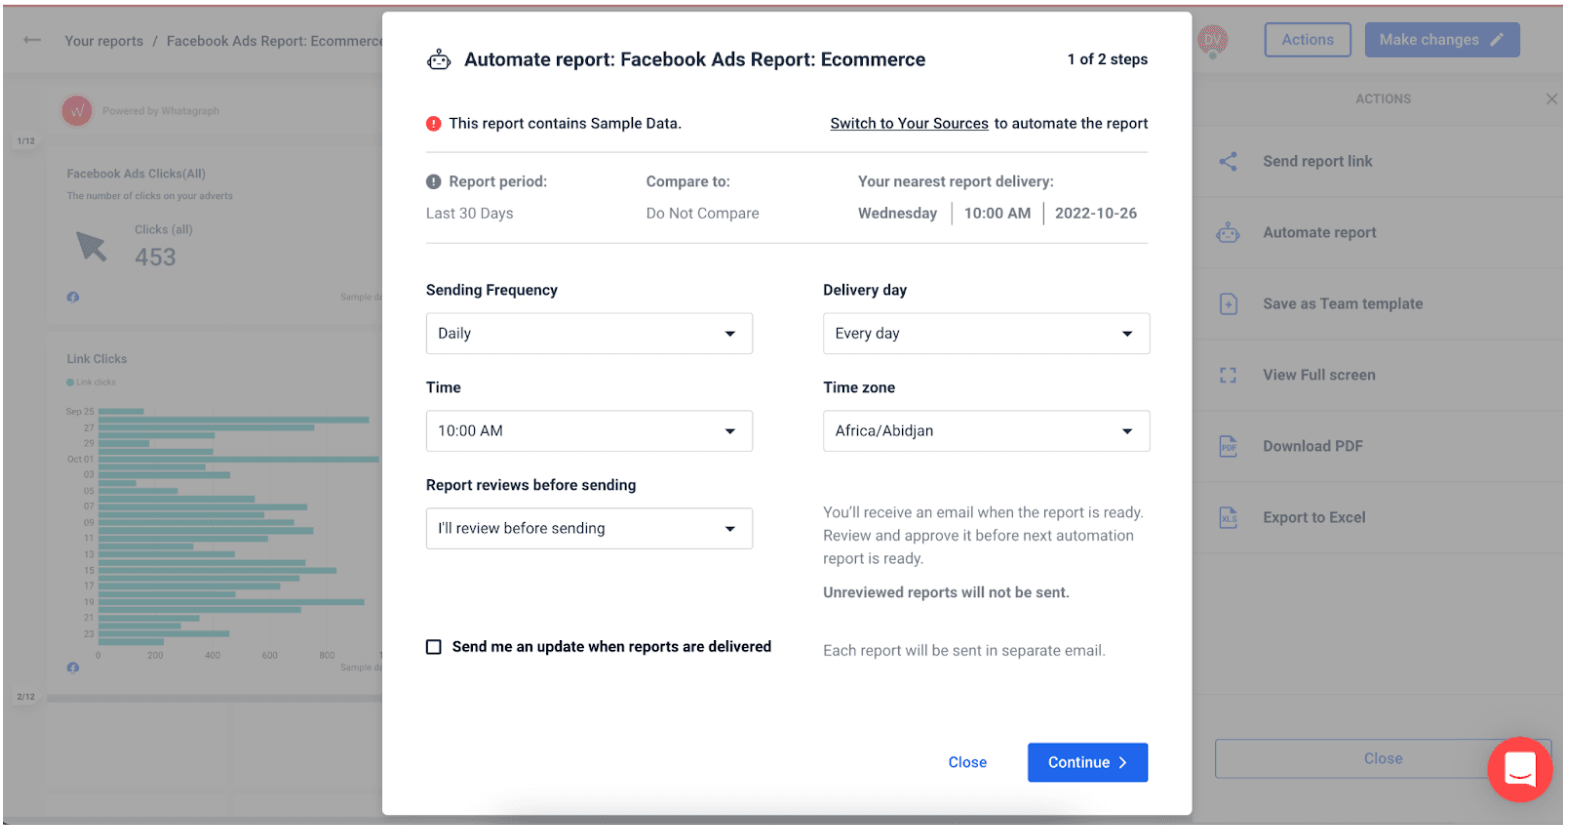
3. Press continue.
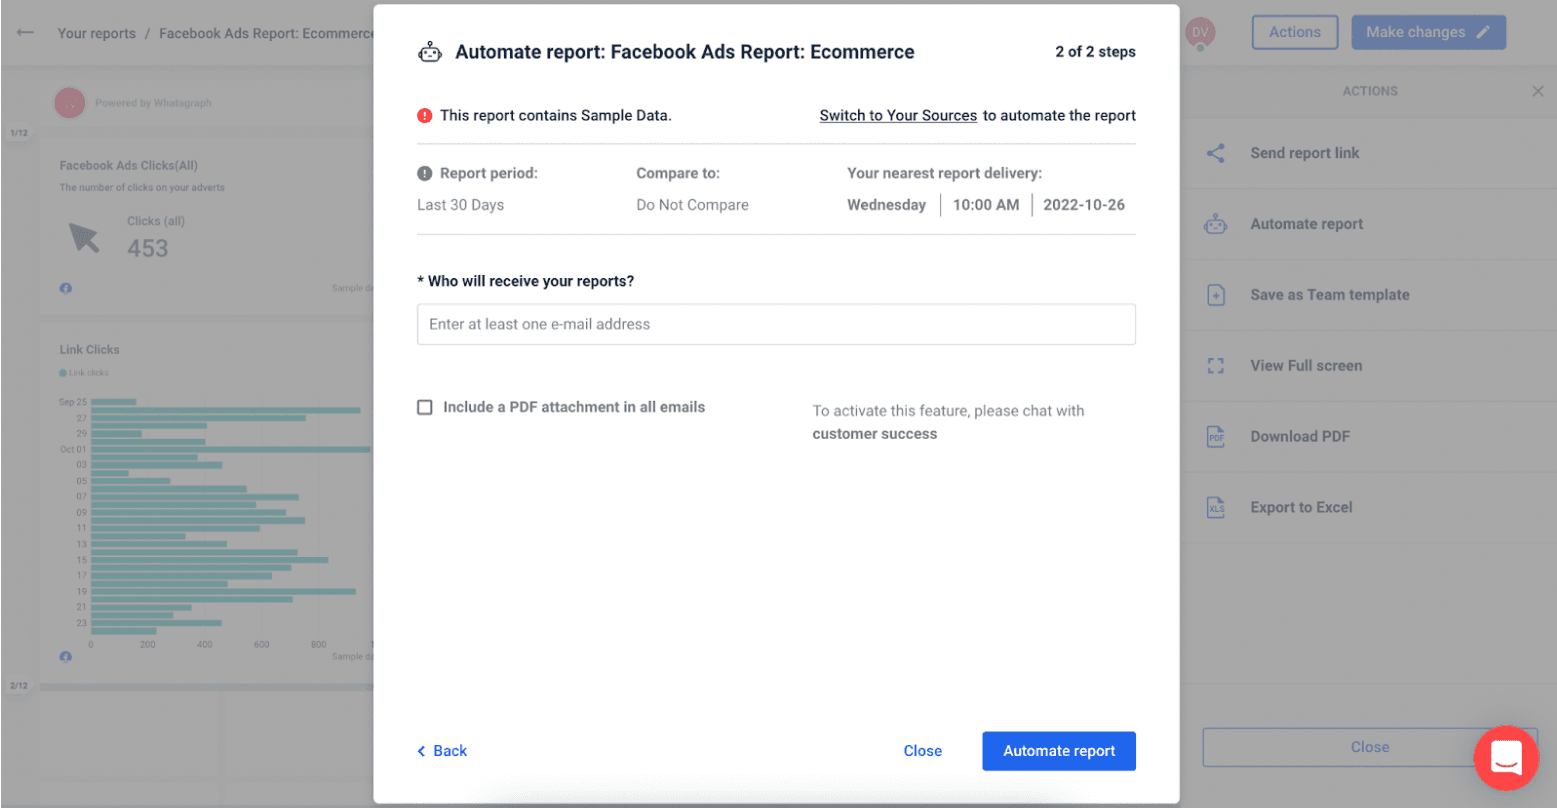
4. Add the e-mail addresses of report recipients.
Bottom Line
Hopefully, this blog helped to decide which way of creating custom social media reports is more beneficial for you and your clients.
And well, if you are here, you might just take a sneak peek at what Whatagraph has to offer. See for yourself how effortlessly you can create social media reports, customize them and then automatically, without doing the extra work, send the report to your stakeholders.
Sign up for free trial today, and we’ll get you started in no time!
Published on Feb 23 2022
WRITTEN BY
Dominyka VaičiūnaitėDominyka is a copywriter at Whatagraph with a background in product marketing and customer success. Her degree in Mass Communications/Media Studies helps her to use simple words to explain complex ideas. In addition to adding value to our landing pages, you can find her name behind numerous product releases, in-app notifications, and guides in our help center.