How to Create a LinkedIn Ads Report in 5 Easy Steps (+Template)
With over 875 million users, LinkedIn is the place to be for businesses. Whether you’re looking to hire people or sell products or services, ignoring this business network is not something you should do.

Jan 21 2021


With over 875 million users, LinkedIn is the place to be for businesses. Whether you’re looking to hire people or sell products or services, ignoring this business network is not something you should do.
Besides finding amazing talent, many companies use LinkedIn ads for lead generation and immediate sales. Although the ads are relatively expensive compared to similar platforms and formats, the targeting is super precise and you can achieve exceptional results on LinkedIn.
If you want to report on the results of ad campaigns on LinkedIn, you could do it natively, from the platform. Or you could create a LinkedIn ads report and highlight your LinkedIn ad campaign performance all the while impressing your clients.
Today, we’ll show you how to create this report in just a few easy steps.
What is a LinkedIn ads report?
A LinkedIn ads report is a business document that shows key LinkedIn ad metrics to relevant stakeholders, such as clients or marketing managers. The goal of this report is to accurately show the return on investment of an ad account. Depending on the business, LinkedIn ads budgets can be massive, so accurate ad performance is crucial.
If you want to give your clients access to real-time LinkedIn ads data and KPIs, you should consider a LinkedIn dashboard instead.
How to create a LinkedIn ads report in 5 easy steps
Creating reports manually is very old school. In 2023, you have countless reporting tools at your disposal to automate your work, and creating your reports is another thing you can do more quickly. Besides, copying and pasting data manually from your LinkedIn campaign manager is not only time-consuming but also opens up possibilities for human error.
Here is how to create a LinkedIn ads report in minutes instead of hours.
Step 1: Think about your clients’ needs
Not every client is the same and depending on their needs and their knowledge of the LinkedIn ads platform, you’re going to make different choices at the very beginning. If they’re someone who never used LinkedIn for PPC and have no idea how it work, their report will be vastly different compared to someone who ran LinkedIn ads in-house.
Determine what the client needs in terms of information and how much prior knowledge they have. Based on these factors, you can decide what to include and what to leave out in your LinkedIn ads reports.
At the end of the day, the report shouldn’t just be accurate and up-to-date, it should also meet the individual needs of each client, going beyond the ad spend and campaign group performance.
Step 2: Decide on the key LinkedIn ads metrics you want to report on
Based on the campaigns you’re running and the insights your clients need, you’re going to pick a set of key performance metrics to show in each report. Here are some relevant metrics to get you inspired:
- Conversion rate
- Click through rate (CTR)
- Impressions
- Cost per click (CPC)
- Audience demographics
- Cost per lead (CPL)
- Campaign engagement rate
- LinkedIn page views
- Ad frequency
And many others. Once again, the metrics will differ based on the client, the target audience and the types of campaigns you’re running for them on their LinkedIn ads account.
Step 3: Choose a marketing reporting tool that works well with LinkedIn ads
The ultimate way to create automated, modern, and beautiful LinkedIn ads reports is to use a reporting tool.
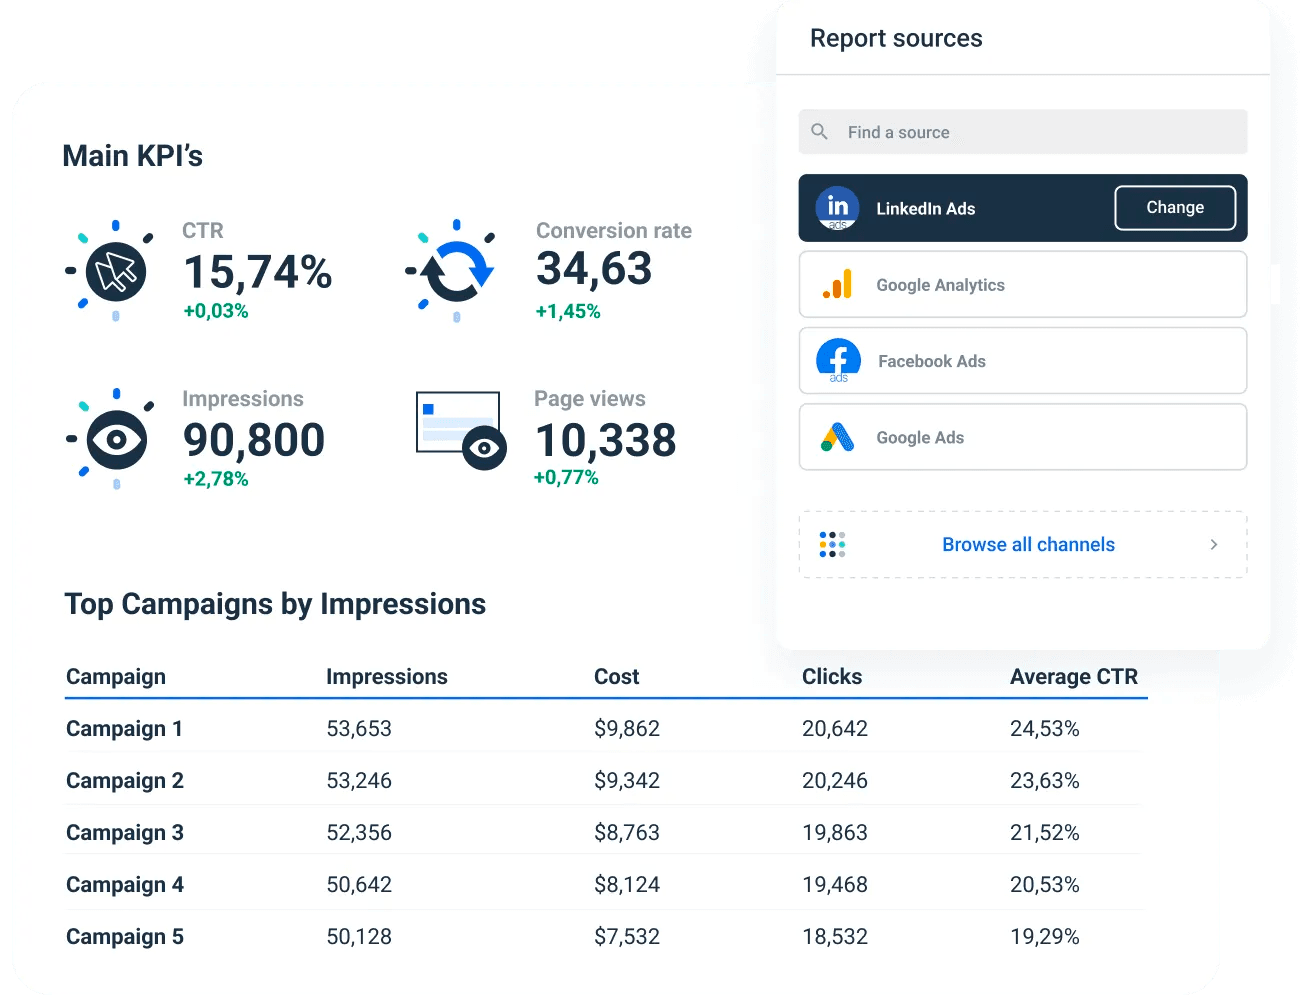
First of all, you want to make sure to choose a tool that has native LinkedIn ads integration. That way, all you have to do is connect your clients’ LinkedIn accounts and you can start reporting.
Whatagraph’s LinkedIn ads integration is just one of the 40+ available data sources. So, if you want to create cross-channel reports and combine LinkedIn ads with Facebook Ads, Twitter Ads, Google Ads, or other social media platforms - you can do that with Whatagraph.
If you run an agency, you’re going to need a tool that supports a large variety of platforms - not just LinkedIn. Take a look at our list of integrations and you’ll see why agencies all over the world love using Whatagraph for reporting on a variety of marketing channels. From Google Analytics to Shopify - we cover a variety of platforms and apps for your agency's needs.
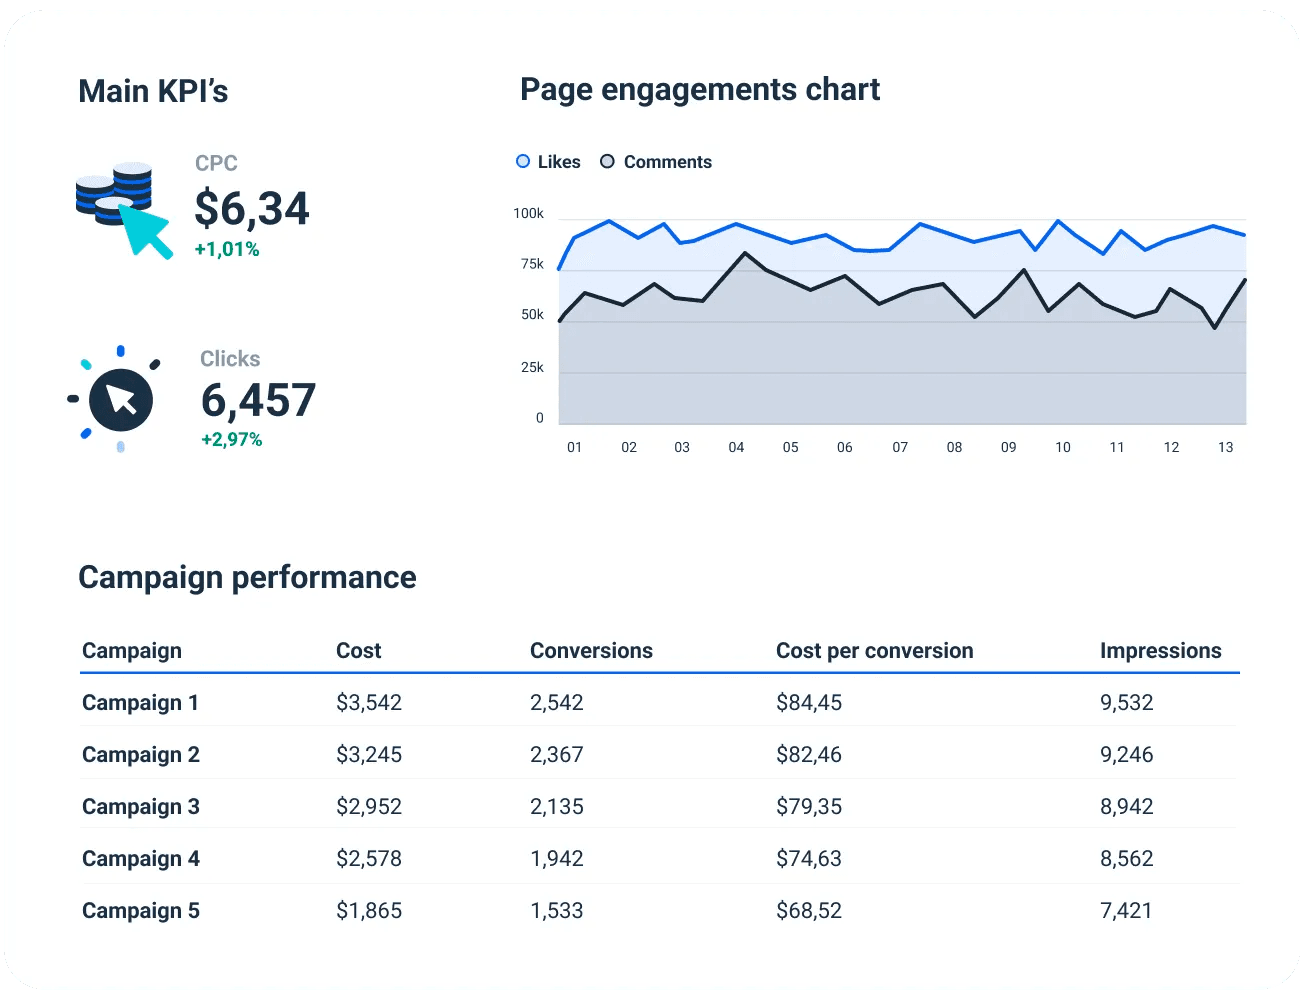
Your reporting tool should also be able to support various data visualization types so that you can show the LinkedIn account performance in different ways. With Whatagraph, you can visualize your data with bar charts, graphs, pie charts, tables
Step 4: Use a LinkedIn ads report template
There are two ways you can go about LinkedIn ad reports. You can create them on your own from scratch, building it from different available elements. In a tool like Whatagraph, building a report yourself is easy because the report builder is very intuitive and easy to use.
The second, better approach is to use a LinkedIn ads report template that looks like this:
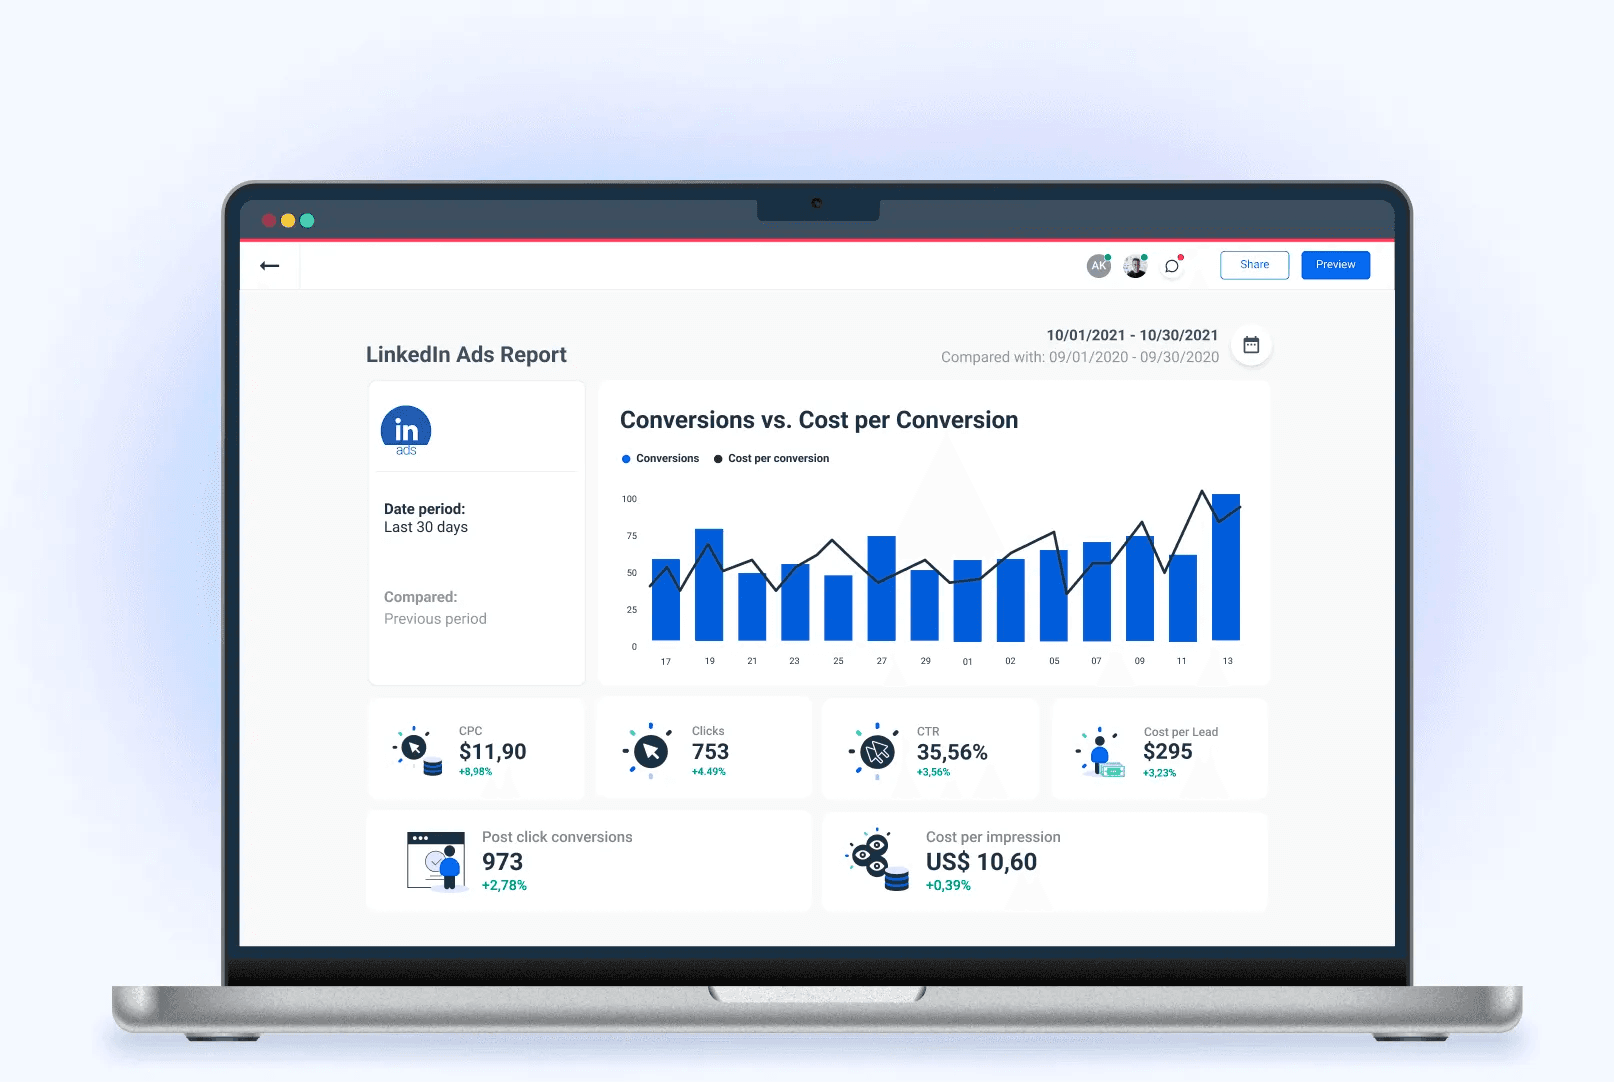
Once you grab this template from the Whatagraph report template library, your report will start generating right before your eyes. Since you connected your client’s account beforehand, the template will get populated with live, accurate data.
Of course, this is not the final look of your report. Once the data populates, you can edit the report to your client’s liking. You can add or remove widgets, change date ranges, add custom image and text fields, and more.
In the end, the template helps you set up the basics and populates the report with the most important metrics for LinkedIn ad reporting. It’s up to you to change it to suit the needs of your client(s) or manager(s).
For agencies, we have a white label option that lets you remove all Whatagraph branding from your LinkedIn performance reports to make them even more personalized and on-brand.
Step 5: Automate your report delivery
It may not sound like a big deal at first, but sending out report emails weekly or monthly takes a few hours at a time. You have to manually update the data, prepare the email, schedule it, review it, and then hit “send”.
Think about the number of times you have to send out information about account performance if you have just 10 clients, all in need of weekly reports.
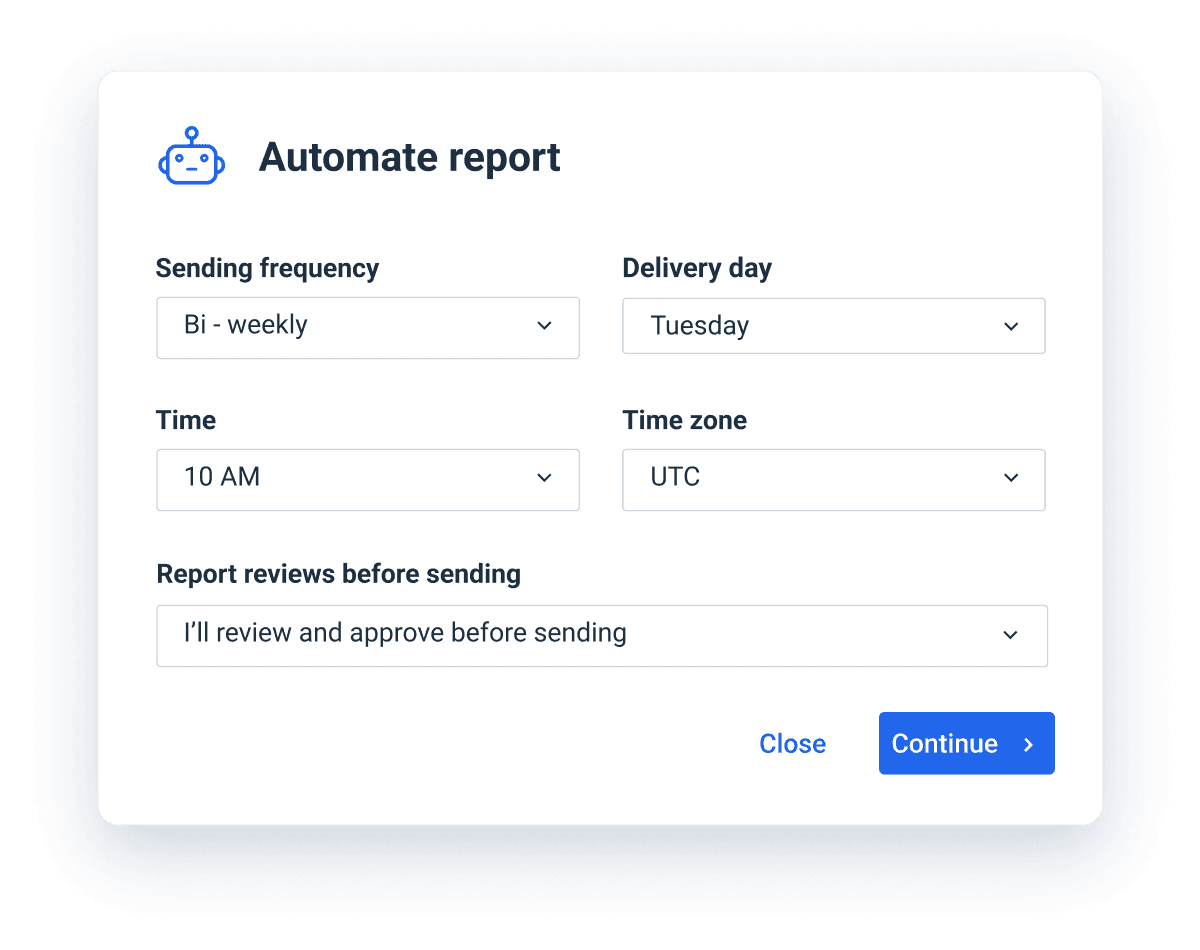
Instead, you can automate the report delivery with Whatagraph. Just choose the intervals at which you want them to go out. Weekly, monthly, quarterly or any other customer interval you need.
You can also add an optional review step when you don’t want the report to go out before someone gives it one final look and optimizes the last details.
Start sending better LinkedIn Ads reports today
Managing LinkedIn ads can be incredibly stressful, especially when dealing with big budgets and even bigger clients. This is why creating LinkedIn Ads reports should be effortless and easy.
If you want to start creating reports in minutes rather than hours and have your clients impressed with the presentation, sign up for Whatagraph today!
Published on Jan 21 2021
WRITTEN BY
Mile ZivkovicMile is the ex-Head of Content at Whatagraph. A marketing heavy with almost a decade of SaaS industry experience, Mile has managed multiple content marketing teams without losing an ounce of his writing passion.