How to Create an Engaging Facebook Ads Report for Clients?
Facebook Ads is one of the most popular digital marketing tools, and for a good reason. With a return on ad spend (ROAS) of 3-4x, an average ads campaign should get you $3-4 for every $1 you invest.
But to achieve that kind of ROI, you need a way to measure the effectiveness of your ads campaigns, and if needed, make changes on the go. In other words, if you manage Facebook advertising for your clients, you should know how to analyze performance and visualize data in a way they can easily understand.
Here’s a complete guide for Facebook Ads reporting.

Mar 20 2023●5 min read


What is a Facebook Ads report?
A Facebook Ads report is a type of marketing report that gives you everything you need to evaluate and optimize your Facebook paid ads campaigns. Each ad campaign has an objective, for example, to drive more conversions, increase brand awareness, or boost the number of subscribers to your website, in case of a top-funnel campaign.
Under each campaign, you can create one or more ad sets with defined parameters like budget and targeting. Also, you may have different ad sets for different age and gender categories.
Then under each ad set, you can have one or more ads, which can have different versions of copy that compete with each other in A/B testing.
Because of this, those ad sets will usually have different variables that make them unique and together form a Facebook Ad campaign.
And when you have your ads up and running, you need to measure the Facebook Ads performance of each campaign to know if and how they are working.
This is the job of a Facebook Ads report.
A report can help you by breaking your Facebook campaign down by ad sets so you can more easily spot an issue. Once you spot an ad set that isn’t performing well, you can take a look at individual ads to find the common issue that prevents them from performing as desired.
3 reasons to create Facebook Ads reports
Let’s ignore for a second the fact that Facebook is the largest social media platform in the world and that a large portion of your client’s audience uses it.
Facebook had 2.963 billion active users in January 2023, and each month, the number increased by 5 million in the three months that led to January 2023.
Facebook Ads reports are the best way to prove to your clients that you’re delivering value. Here’s how both you and your client can benefit from these reports.
1. Increased transparency
The best case scenario is when you dedicate significant time and resources to a project that bears a resounding success. But what if your hard-won results aren’t what the client needs? What if you don’t meet your goals?
Although this scenario is far from ideal, you can still land on all fours.
How?
For one, by frequently reporting results, you can find what’s not working sooner rather than later. There’s nothing worse than a realization that a campaign that’s been on your back burner for a while is falling apart and has been for some time.
The only worse thing is having to break the news to your client.
But if your monthly report shows that something’s not working, you can use this opportunity to figure out what needs to change. You should regularly meet with your clients so they can see the data you’re seeing and accompany it with two talking points:
- Why the results haven’t met expectations
- What we can do as a team to improve this
- Why the results are really good
- What we can do to make them even better
The talking points 3 and 4, however, are a great opportunity to upsell your client and offer additional service that will make their Facebook Ads campaign even more successful.
Use this opportunity to show your client that you’re their partner and trusted advisor and not just a vendor providing a tool or service.
You can make this a brainstorming session where you can pitch some of your own ideas and use your expertise to guide them to a solution. Eventually, you should implement those actions ASAP and keep running.
2. Easier way to upsell clients
It goes without saying that clients need to hear from you regularly, even if you’re just hired to do a specific project. When you’re delivering results, you can prove you’re not a one-trick pony and turn it into a retainer.
Use the opportunity to prove value outside of showing that you can successfully run a Facebook Ads campaign.
For example, your main call to action (CTA) is a new software download. New prospects are lading at the website via your Facebook ad and filing a gated form to download a trial. As they enter the client’s database, most of them choose to receive emails on updates.
To turn this into a money-making scenario for both you and your client, offer them to
- Create an automated lead follow-up email that the prospect receives immediately after download, with a sales-focused CTA.
- Create a multi-touch drip campaign with several emails sent periodically providing valuable resources for the trial period.
- Write a series of blogs on different use cases for the software.
- Repurpose the blog content into a whitepaper, a webinar, or a series of social media posts.
- Run a similar campaign on LinkedIn, provided there’s little overlapping between the audiences.
These are just a few examples of how both you and your client can capitalize on the success of their Facebook Ads campaign, brought to you by a Facebook Ads report.
3. Allow clients to make better decisions on a budget
It’s natural that you and your client agree upon the KPIs and define what success looks like before you run your campaign. This way, everyone is on the same page regarding what actions to take based on specific results.
However, once the campaign takes off, it’s easy to run into information overload. Facebook offers a lot of data you can use to measure an ad campaign’s success, which is usually a good thing. Yet, your clients may not have the time or expertise to draw meaningful insights from all those stats.
It’s your job to filter through all the available data and reach for metrics that are the most important to your clients.
For each type of metric, you can see how much you’re spending per lead, and clients can see how their money is spent.
A Facebook Ads report can also give clients more intelligence about which campaigns are worth funding. They might be keen to pause or terminate a high-cost campaign, which can be misleading when observed on its own. However, if you have two similar paid ads campaigns and one costs more, it might also bring in more actions or high-quality leads.
In other words, a client's Facebook Ads report has additional benefits beyond simply answering the question, “Did we meet our goals?”
12 metrics to use in your Facebook Ads report
Before generating a Facebook Ads report, you need to know which Facebook Ads metrics you’re going to track. These are the essential ones:
- Cost Per Result
- Ad Impressions
- Ad Frequency
- Ad Clicks
- Click-Through Rates
- Cost Per Click and Cost Per Impression
- Conversion Rates
- Cost Per Conversion
- Ad Spend and Return on Ad Spend or ROAS
- Total Conversion Value
- Cost Per Action (CPA)
- Relevance Score
How to create a Facebook Ads report in 6 easy steps
1. Consider the client’s needs
Before you get down to writing the actual report, you need to consider who is going to read your report. Depending on the position of the person and their knowledge of marketing, the report will have different structures and contents.
Also, you need to consider the frequency at which your report is sent out. The more frequently your reports go out, the more details you can cover. For example, a weekly Facebook Ads report can cover a broader range of metrics than a C3 report you send out every month, not to mention an annual Facebook Ads report.
2. Grab a reporting tool
A report on a Facebook Ads campaign that you run often contains several different ad sets, each with its own Facebook ad creative and results. Copying these manually to your report can be painstaking, especially if you need to repeat it every week.
What you need is a Facebook Ads reporting tool like Whatagraph. Connect your client’s Facebook Ads account once to your report, and every time you create a new report, the data is refreshed.
The days of digging through dashboards for hours trying to make the numbers fit are over. Connect your accounts once, and the Facebook Ads data fills in ad updates automatically in the future.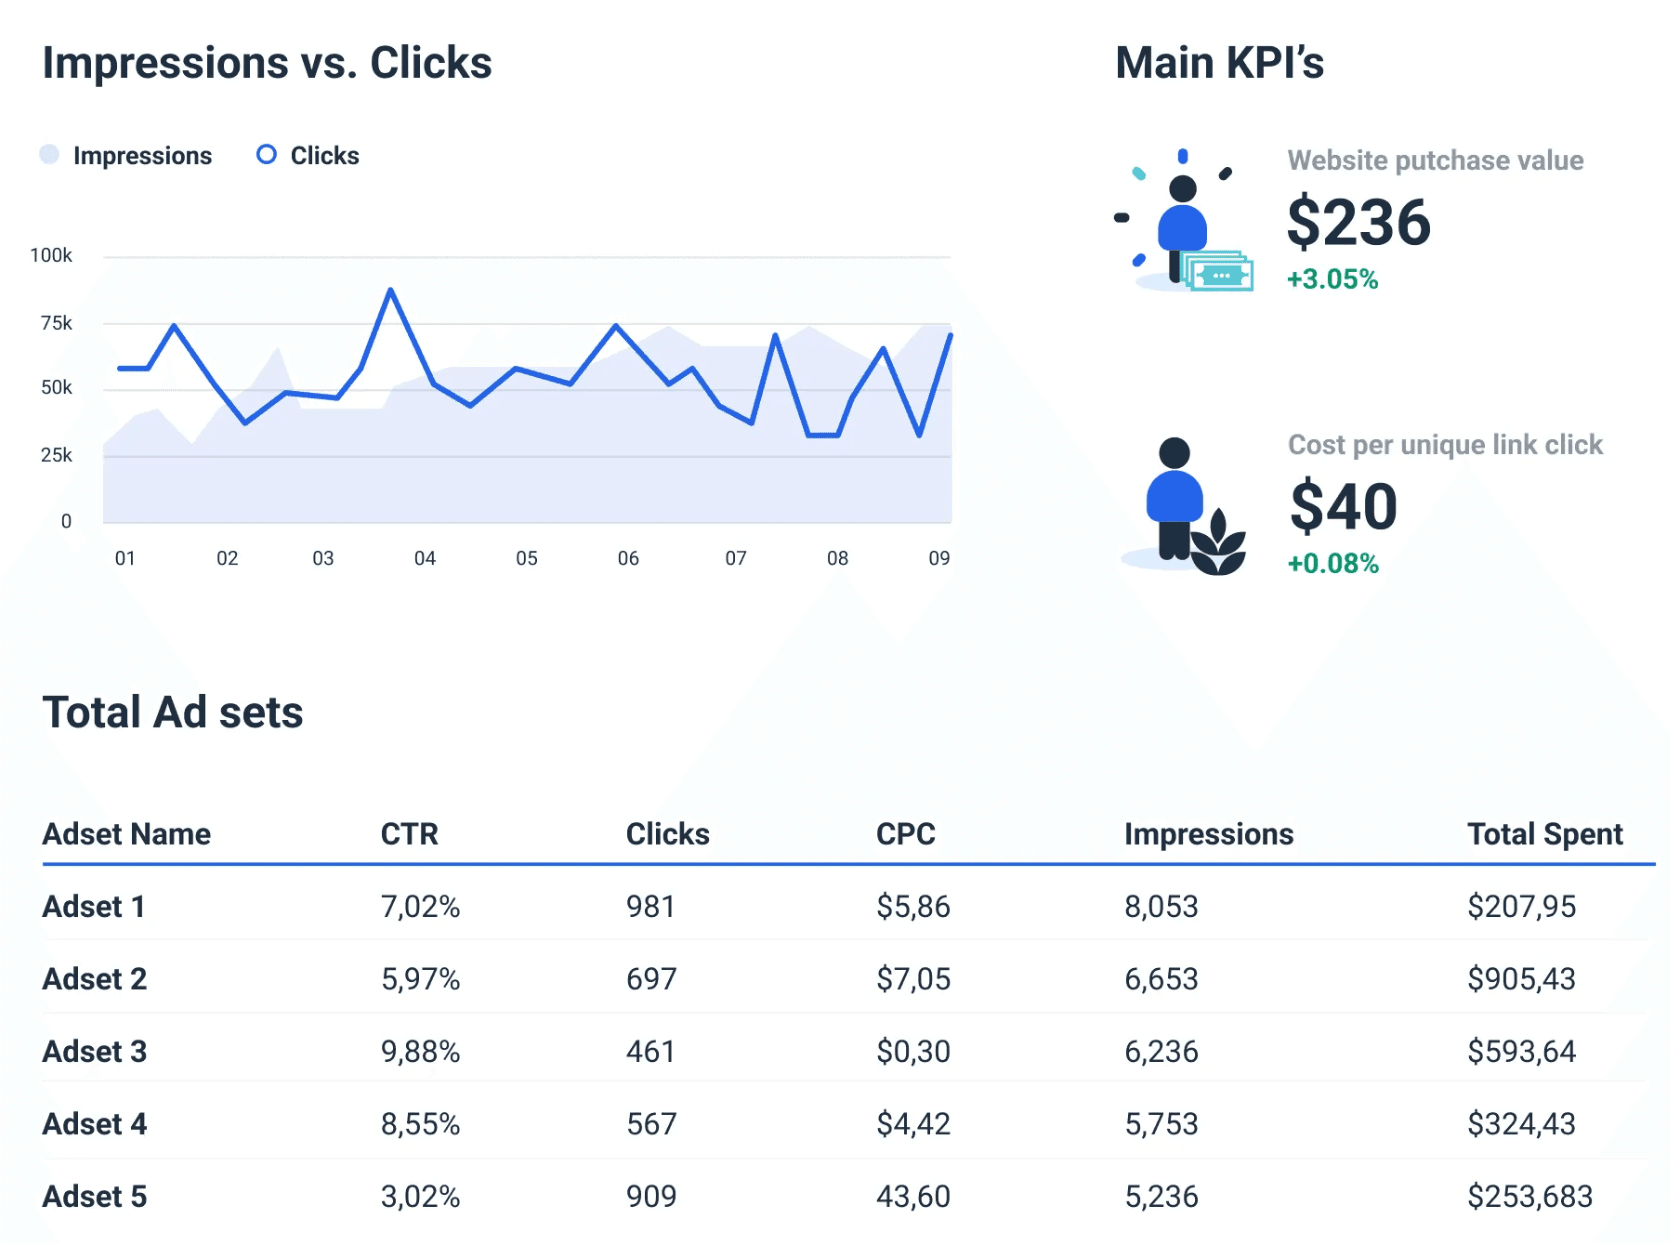
But it’s not just Facebook Ads. Whatagraph allows you to create a cross-channel analytics report using data from various marketing, SEO, PPC, web analytics, and eCommerce tools through beautiful interactive dashboards.
And the process is the same whether you need to visualize Facebook Ads metrics, data from Google Ads, performance metrics from Ahrefs and SEMrush, or create a custom report with channels you choose:
Connect sources once and create hundreds of different report types.
3. Add the Facebook Ads account as a source
Now we’ll show you how to add a Facebook Ads account as a data source.
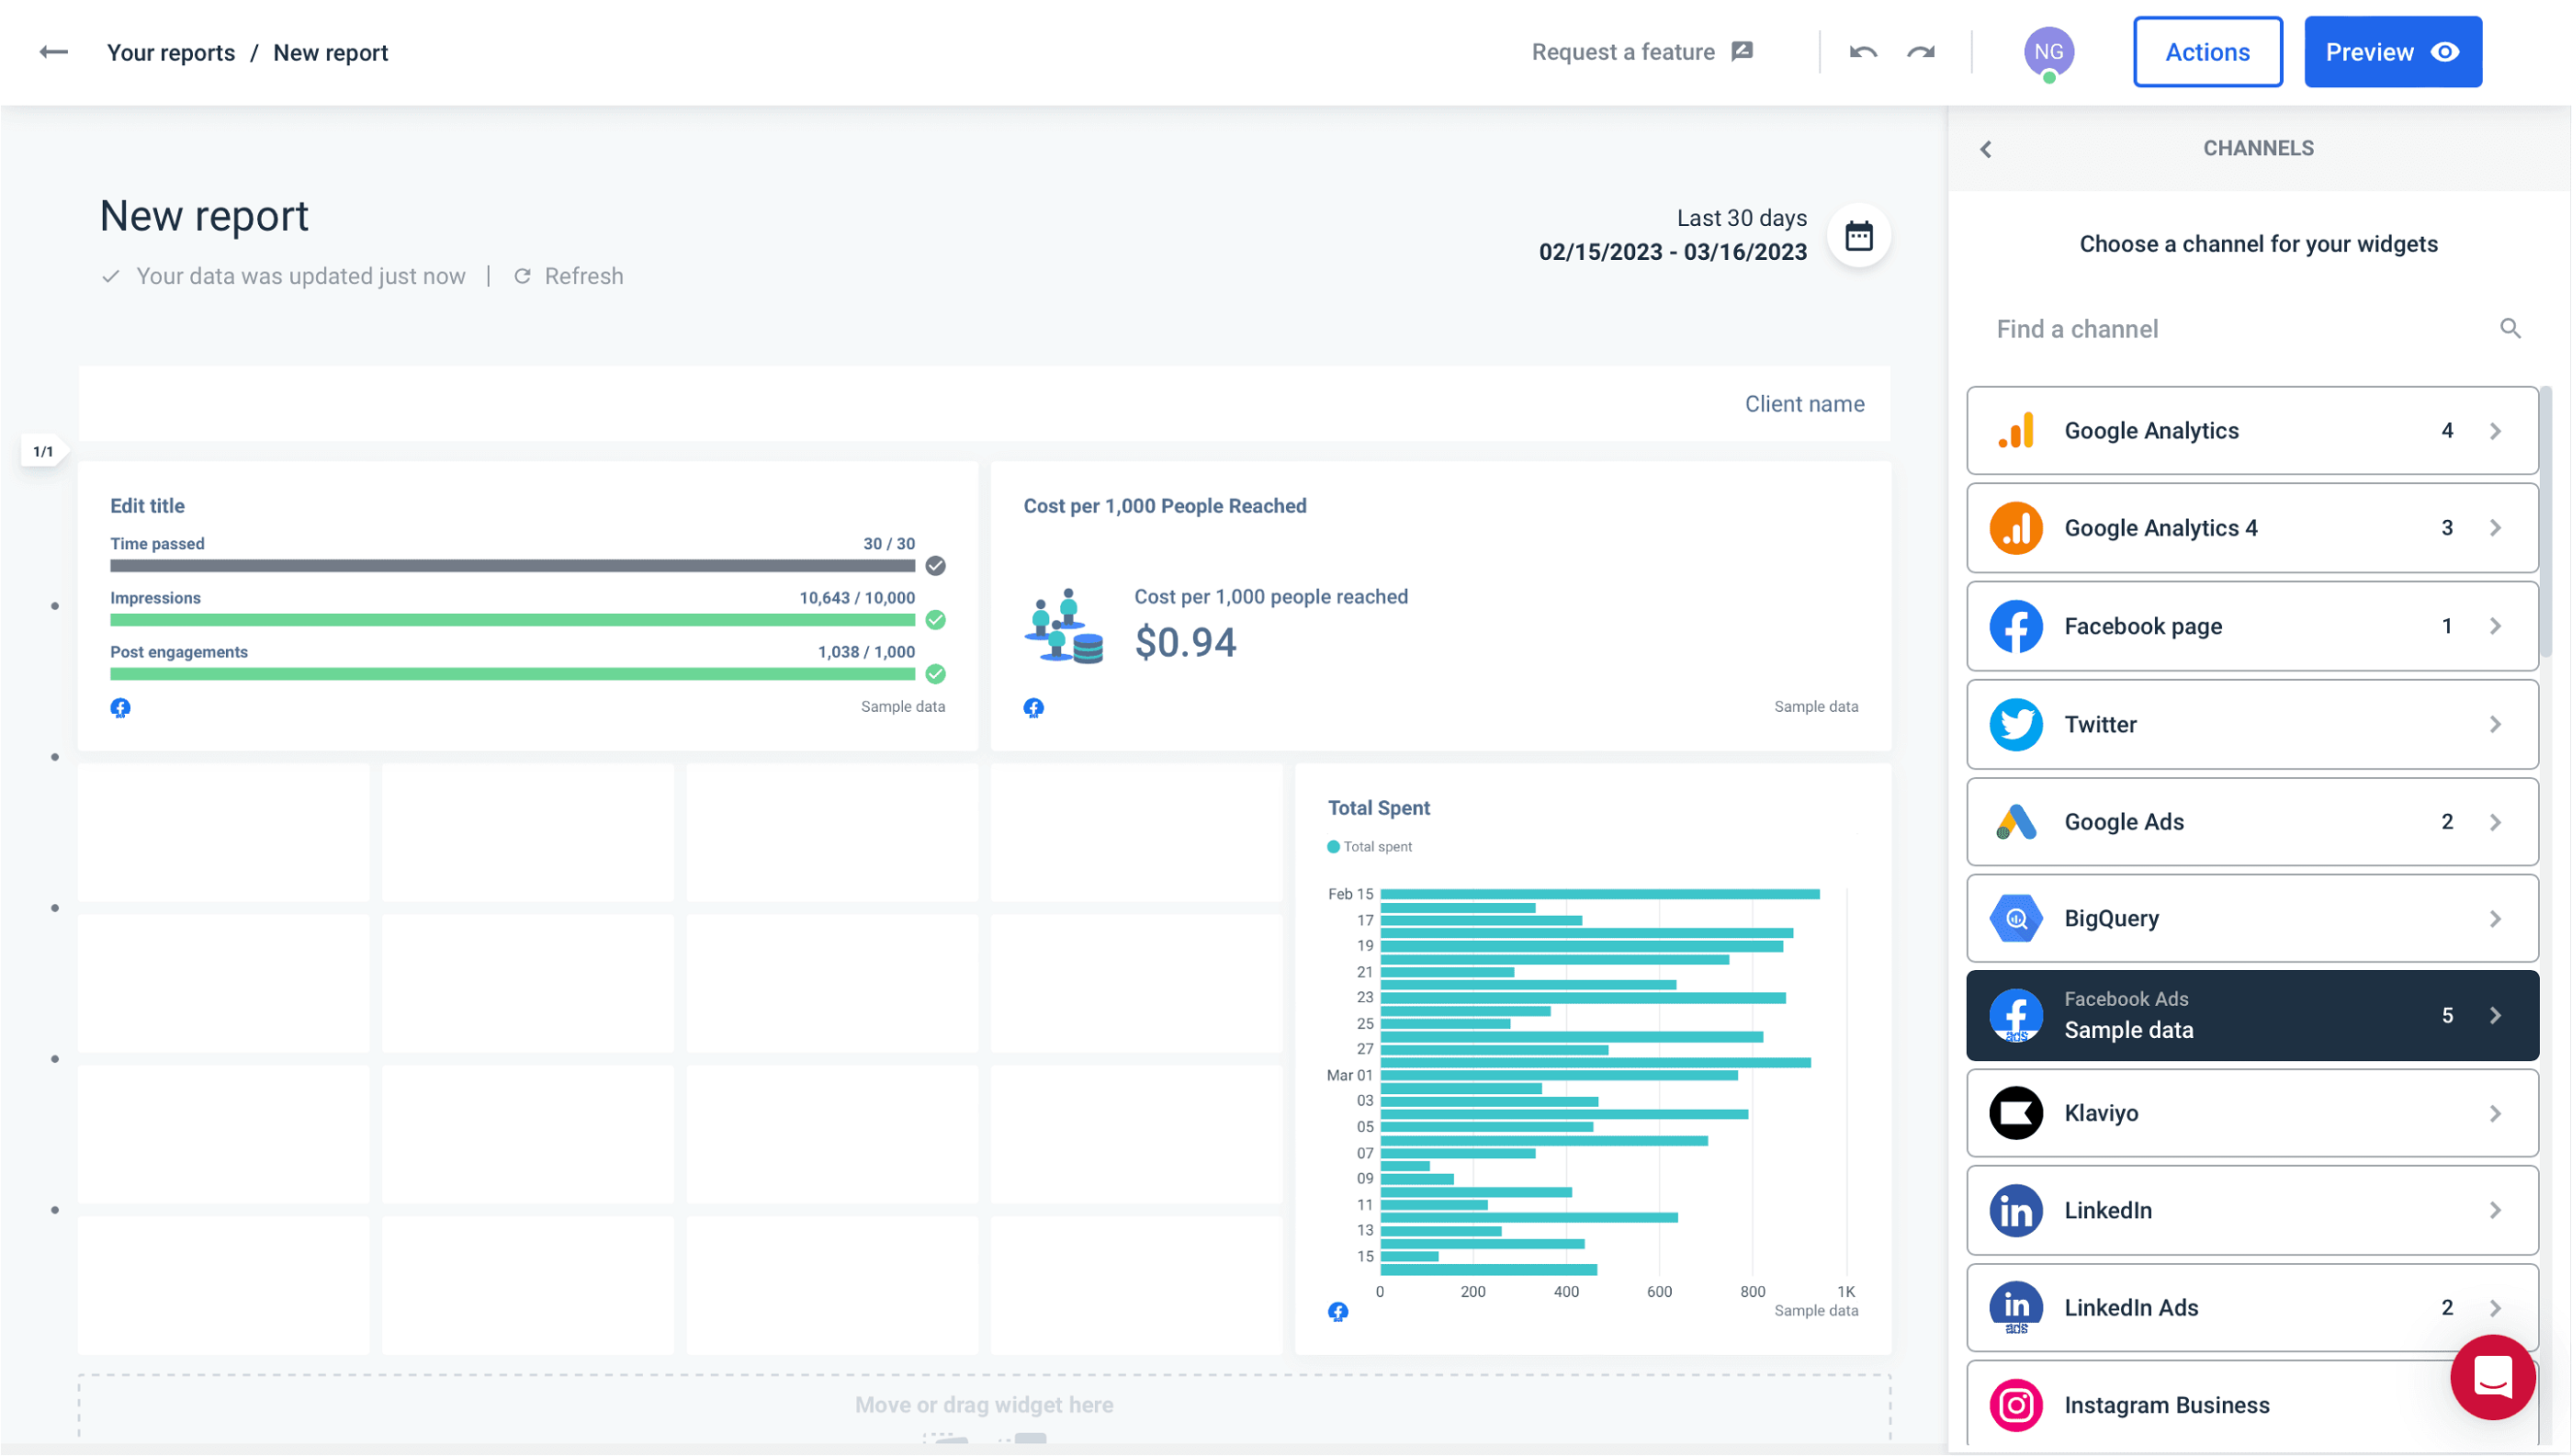
- Open Whatagraph and click Create new in the top-right corner.
- Choose to Create from template.
- Scroll down to find the Facebook Ads template and click on it.
- Now you have a Facebook Ads report with basic metrics.
- To add a Facebook Ads source, click Actions > Manage Data Sources, and then Browse More Sources.
- Select Facebook Ads and pick one of the available accounts.
4. Start with a report template
Whatagraph’s Facebook Ads template is designed to meet your client’s needs. It gives you an in-depth view of your Facebook Ads account performance and tracks ad set analytics.
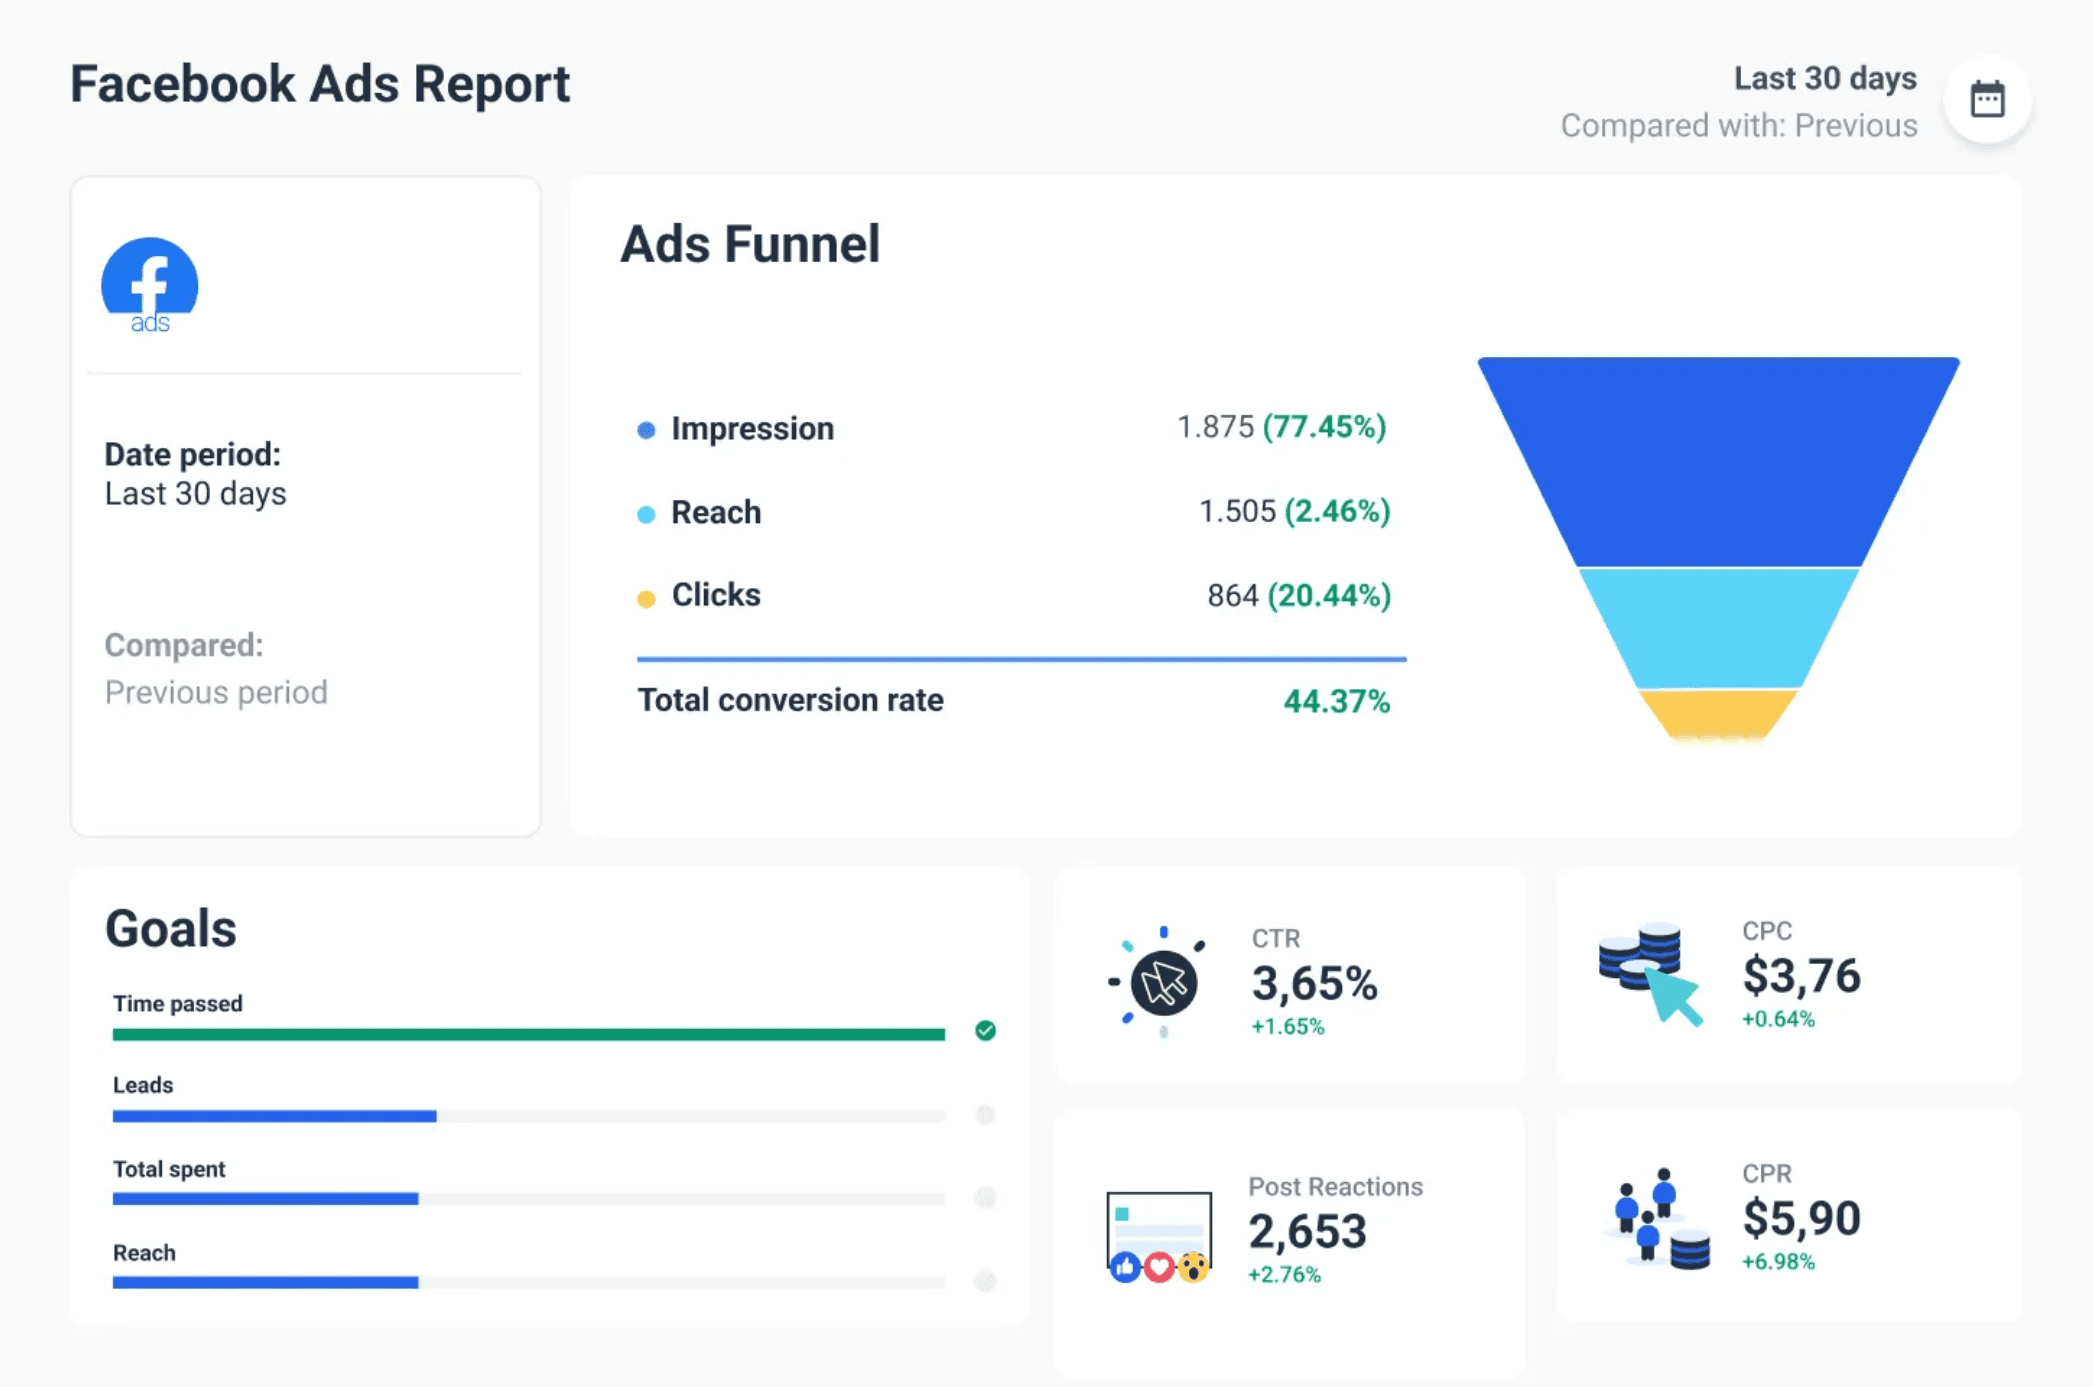
Using this template, you can present data that sheds light on your ad campaign performance. Highlight ad impressions, relevance score, cost per result, and audience demographics.
Since Whatagraph is big on visuals, the example report begins with a cover image of your campaign, followed by four sections of the report:
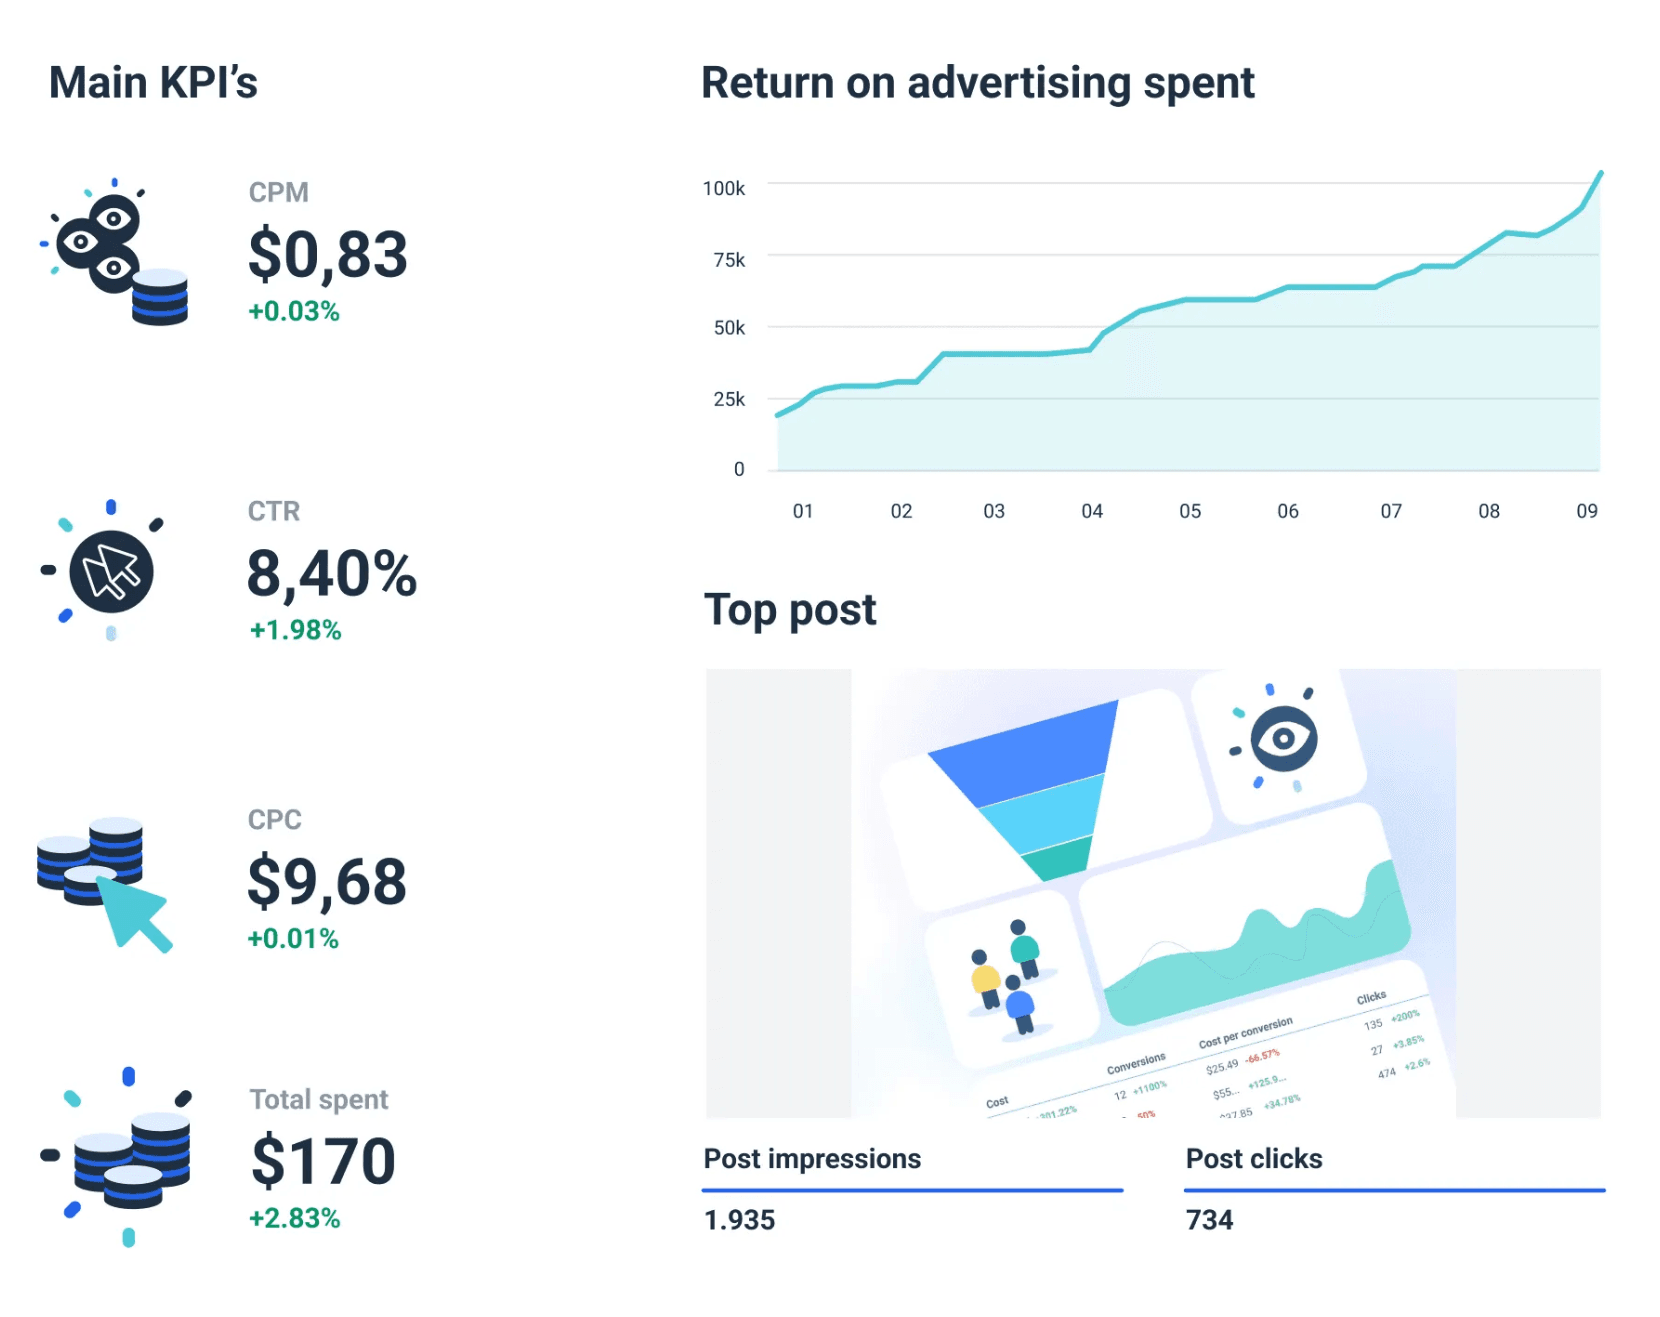
- Performance overview: KPIs like Amount spent, Clicks, CPC (cost per link click), Impressions, and CTR.
- Engagement overview: Engagements, Reactions, as well as Engagement and Campaign performance per month.
- Ad performance: Top 6 best Facebook ads by Link clicks and CTR performance.
- User and media insights: Ad breakdown by gender, age, device, and platform placement.
5. Edit the report to your client’s liking
Once you create a basic Facebook Ads report, you can choose to edit it by adding extra widgets for different metrics and dimensions.
Customize your Facebook Ads report template by adding graph and chart widgets, images, text boxes, calendars, and more. 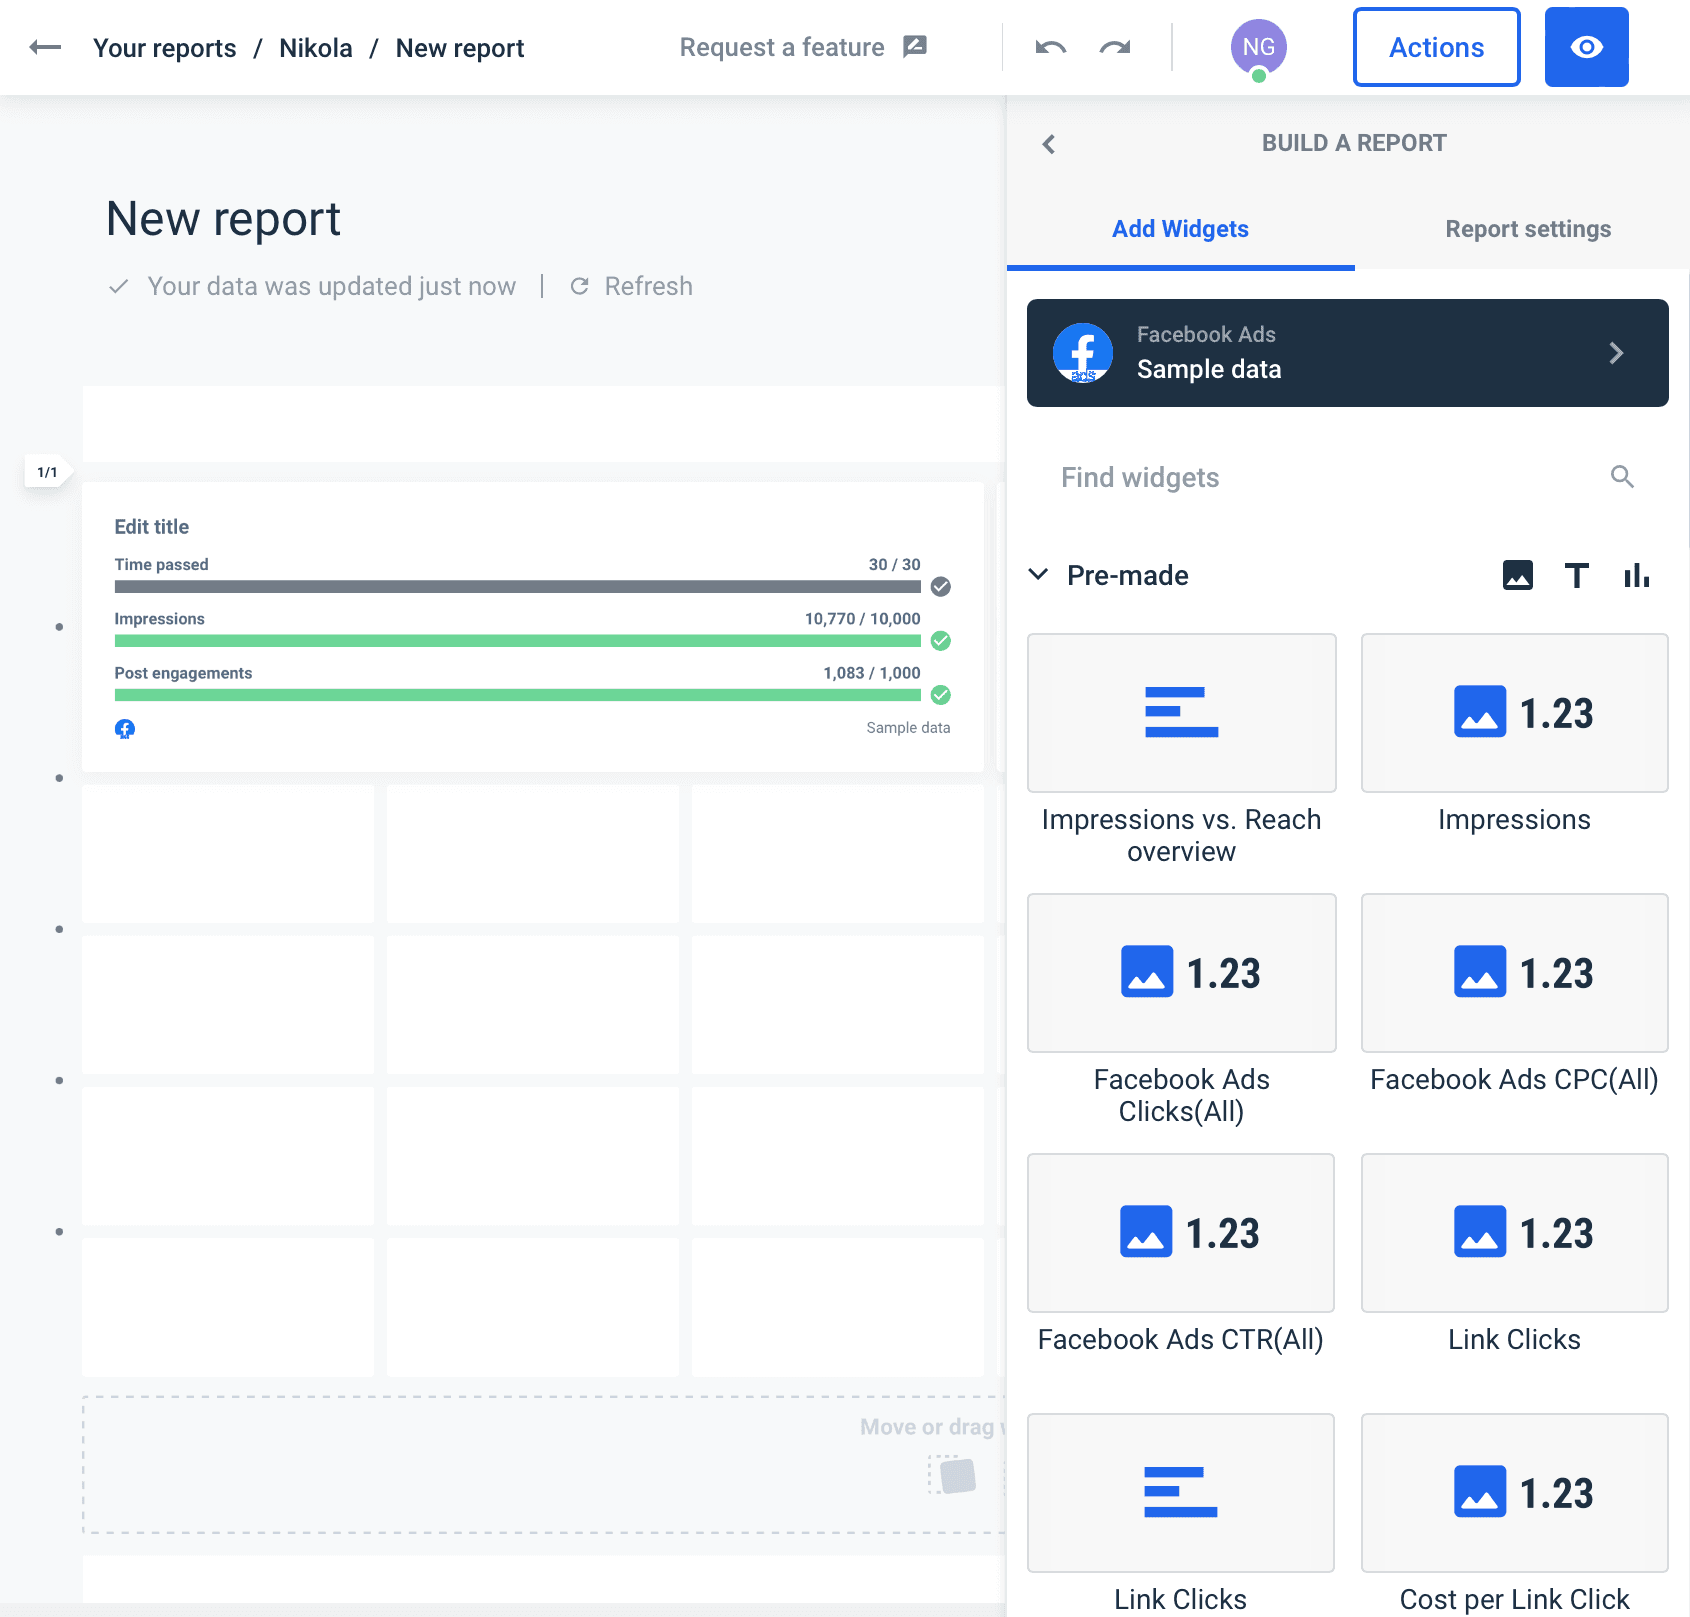
You can custom-name your report, add logos, as well as change the color of elements to create an impression of your or your client’s branding. 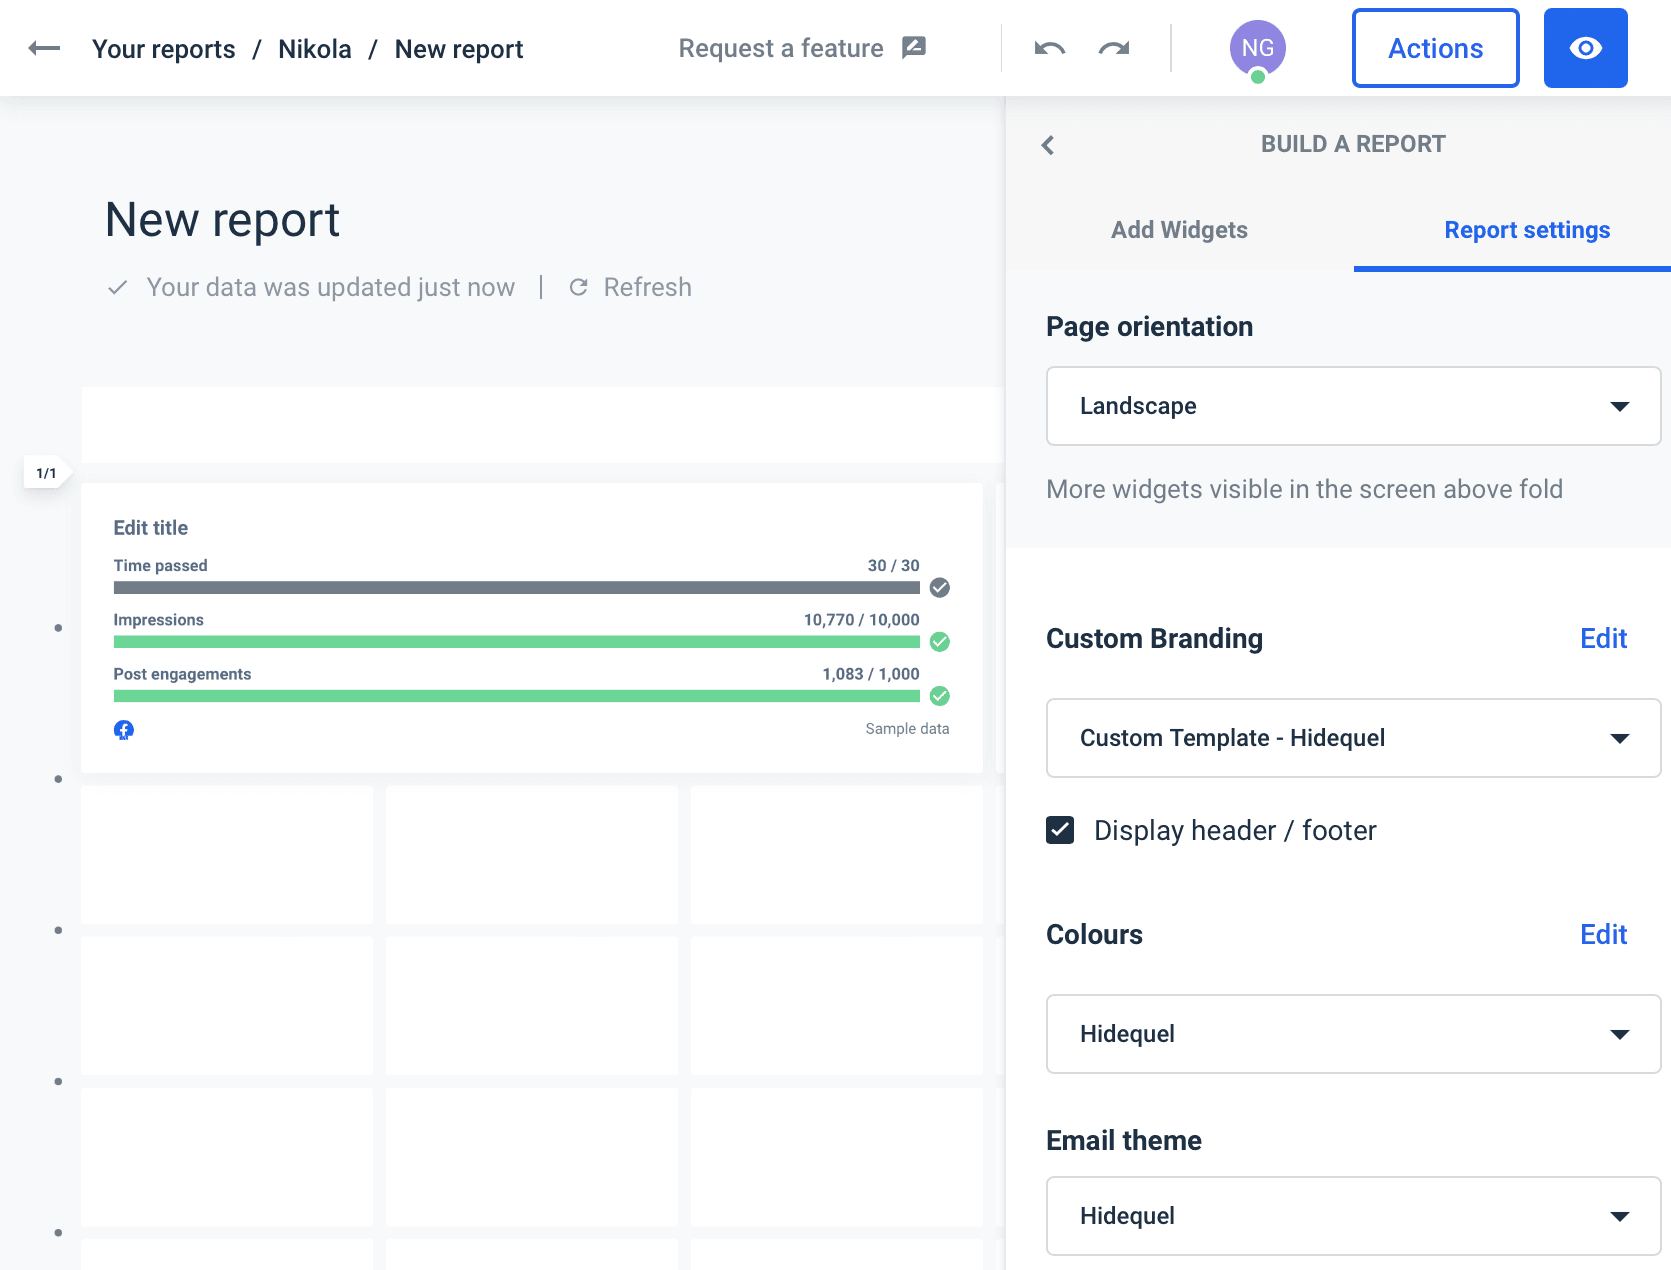
And if you want to raise the bar and make your report look more professional, you can white-label the report and remove the Whatagraph branding altogether.
6. Automate the report delivery
When you’re happy with your Facebook Ads report, the only thing that remains is to automate the report delivery. This allows you to cut the reporting time from hours every week to just minutes.
Some clients will want to get a Facebook Ads report every week, while others are more interested in the bigger picture that comes with a monthly report.
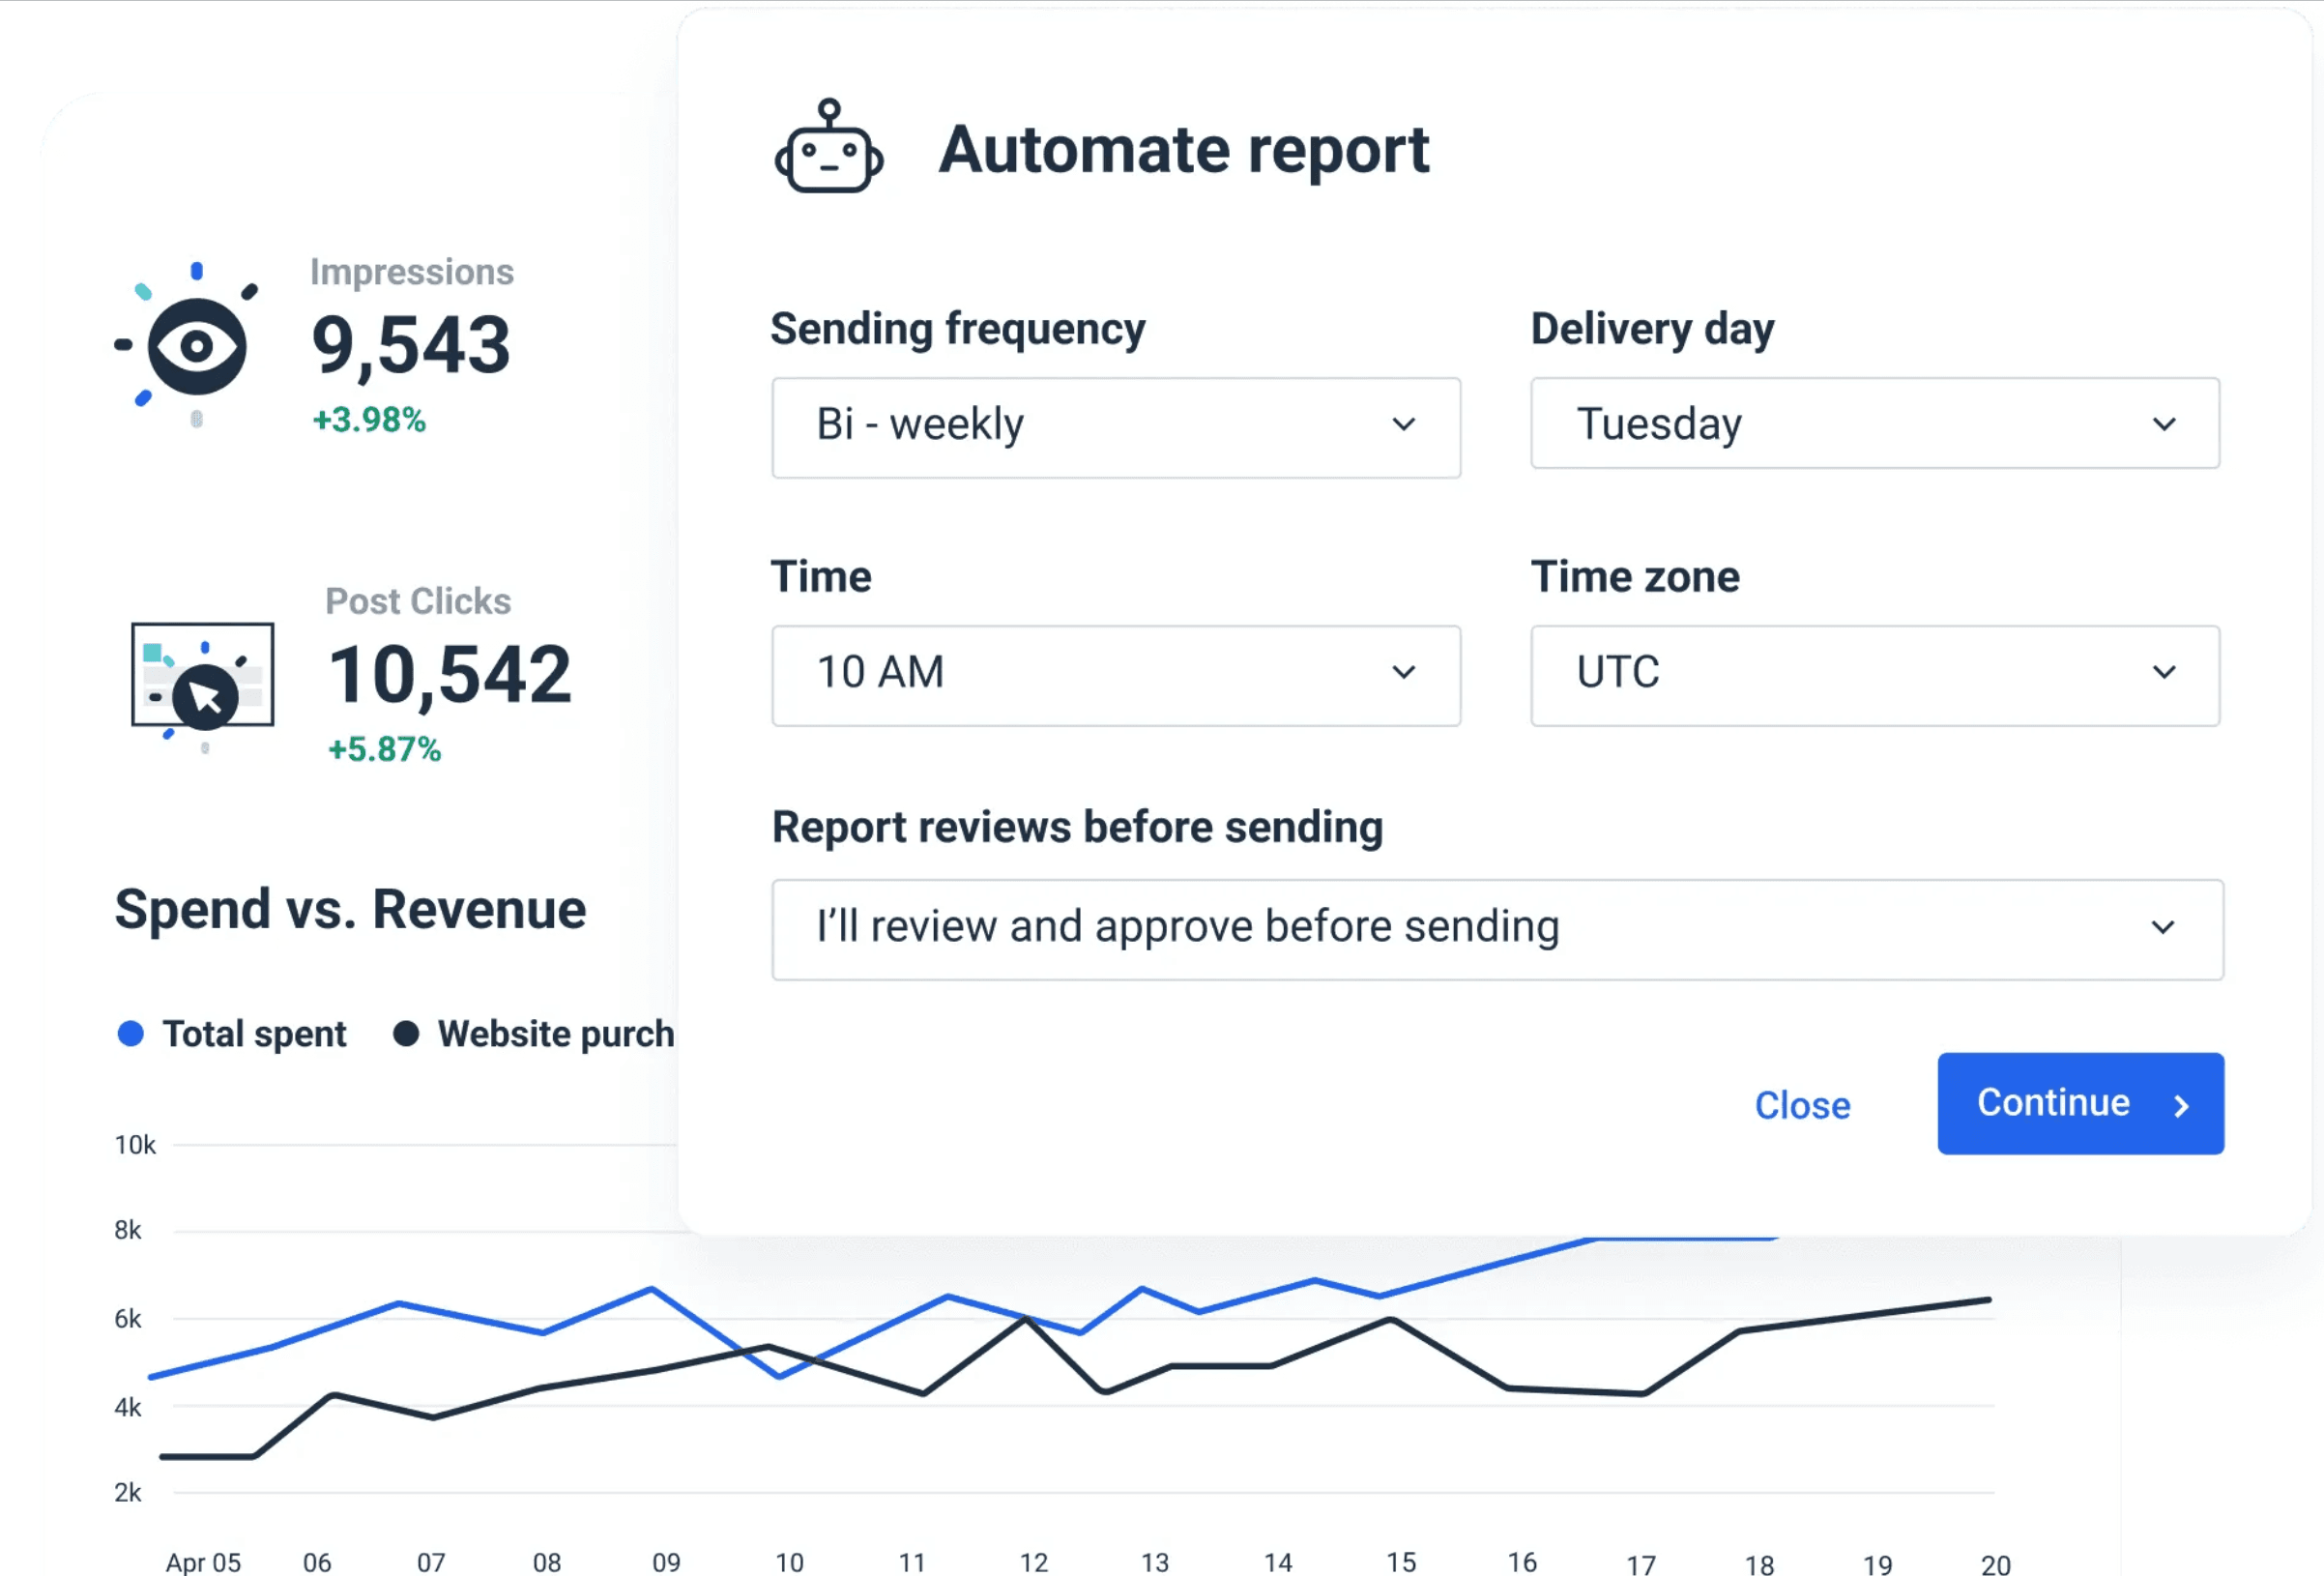
Luckily with Whatagraph, you don’t have to worry about those schedules. Once you connect a Facebook Ads account, the data is updated in real-time.
Now you should only set your sending intervals for every account, set the time period you want to report, and the number of recipients, and each Facebook Ads report will be delivered on autopilot.
Which Facebook Ads reporting tool will you use?
Facebook Ads collects a vast amount of data on your clients’ paid Facebook advertising.
So much so that any attempt to manually stitch data into a meaningful report would soon turn into a time-consuming disaster.
Don’t bother with manual reporting.
Use Whatagraph to create engaging Facebook Ads reports in minutes and schedule automated sending so that every client receives their custom-made report at a set interval.
And the best thing — there’s no limit on the number of reports you can create, edit, and send.
But Whatagraph is not a one-trick pony either.
Apart from Facebook Ads reports, you can use our automated reports to visualize marketing data from over 40 platforms. 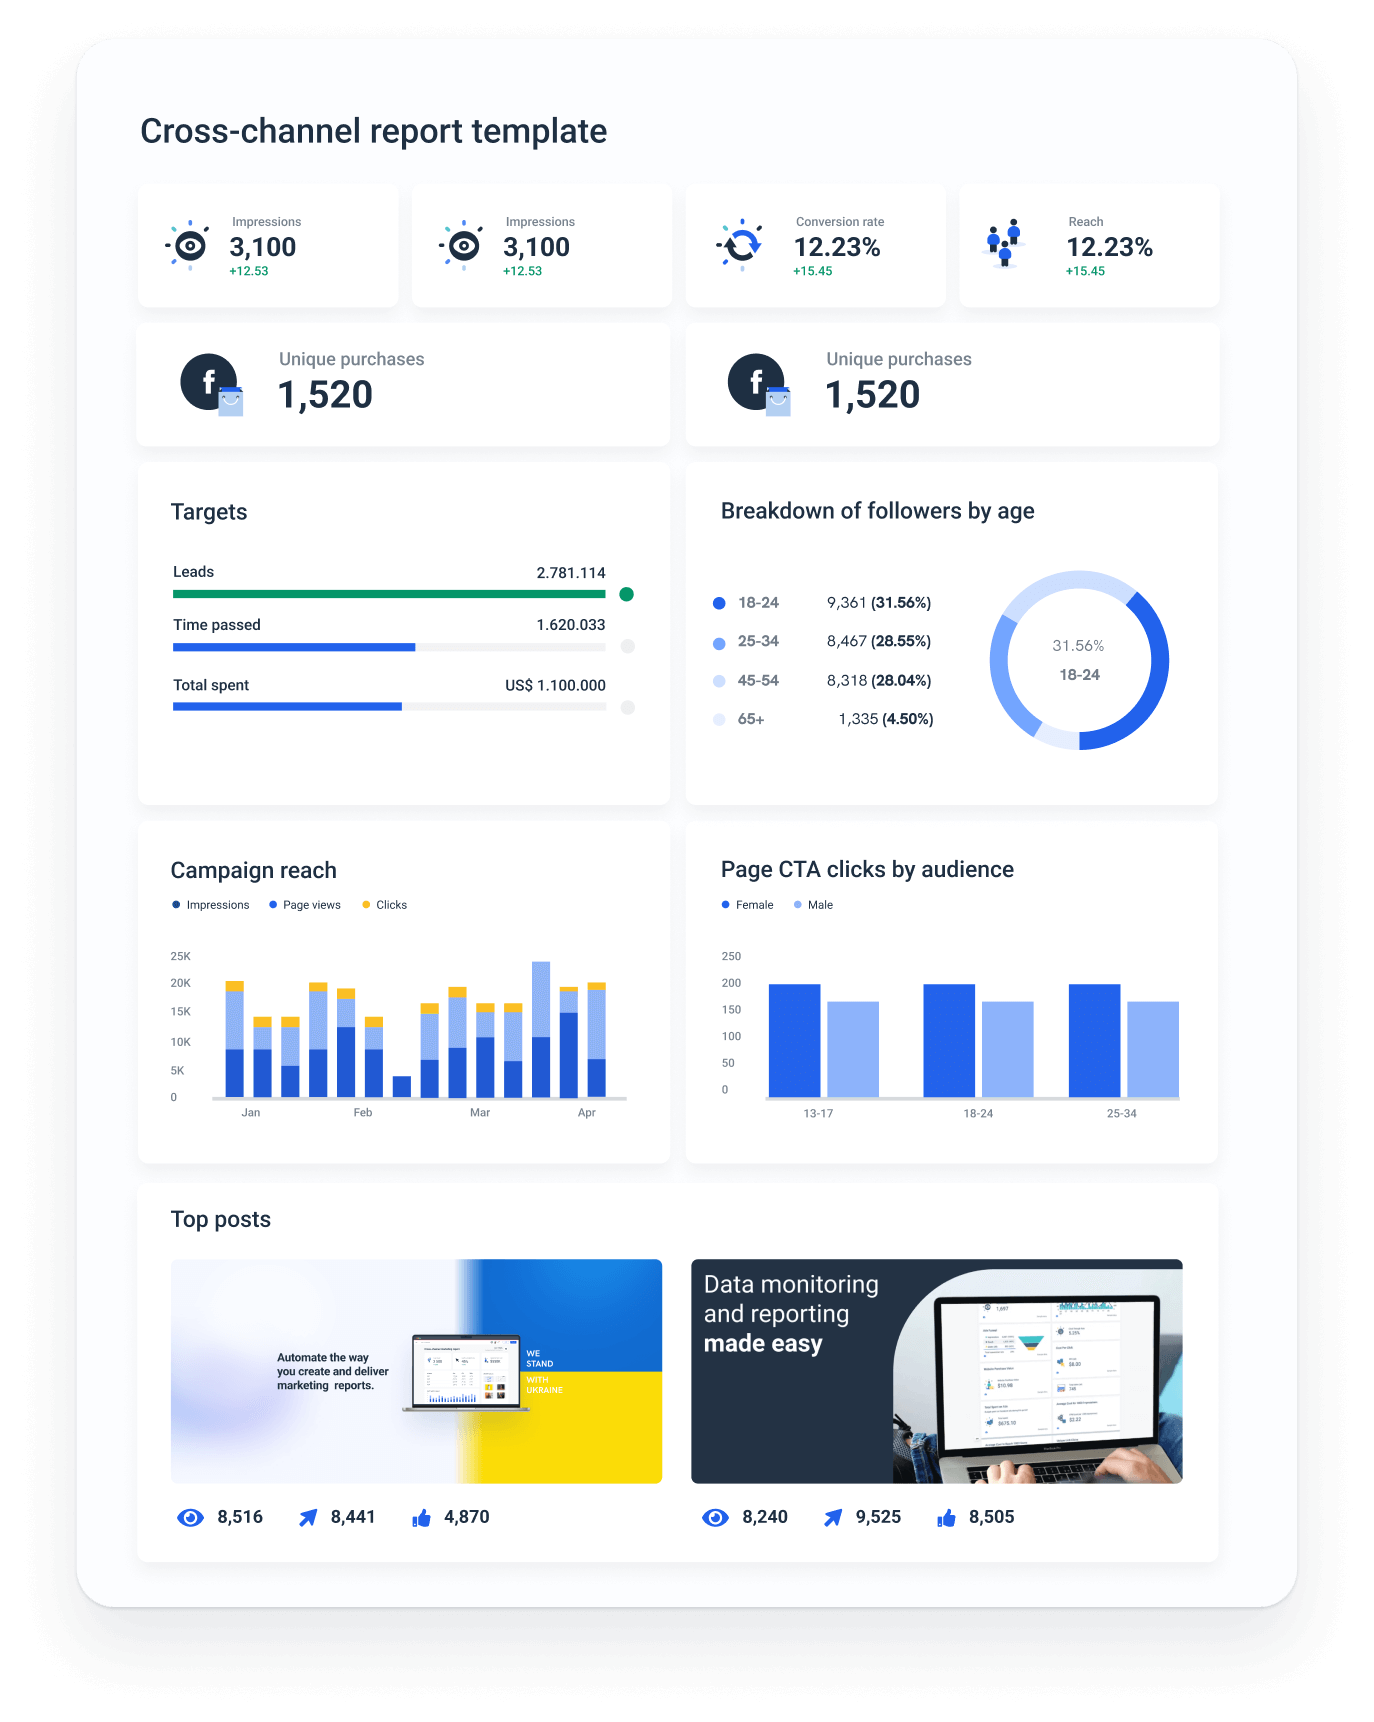
Sign up for a free trial to get a first-hand feel of what Whatagraph is all about and how it can help you automate your reporting.
Published on Mar 17 2023
WRITTEN BY
Nikola GemesNikola is a content marketer at Whatagraph with extensive writing experience in SaaS and tech niches. With a background in content management apps and composable architectures, it's his job to educate readers about the latest developments in the world of marketing data, data warehousing, headless architectures, and federated content platforms.